COVID-19 is impacting the world in unprecedented ways. Today, it is estimated approximately 75 percent of the U.S. population or, almost 250 million people, are staying at home. Globally, over 1.5 billion people have been asked to stay at home. Wine.com, an online wine distributor and one of our secondary investments, has seen demand in March more than double from the year earlier, and was accelerating to three times the year earlier pace in the early days of April1. It is too early to tell the full impact on the private capital market. However, if there are comparisons to be made to the global financial crisis, the secondary market may see opportunities to invest at highly attractive returns.
Secondary Market Impact and Opportunity
Secondary Volume
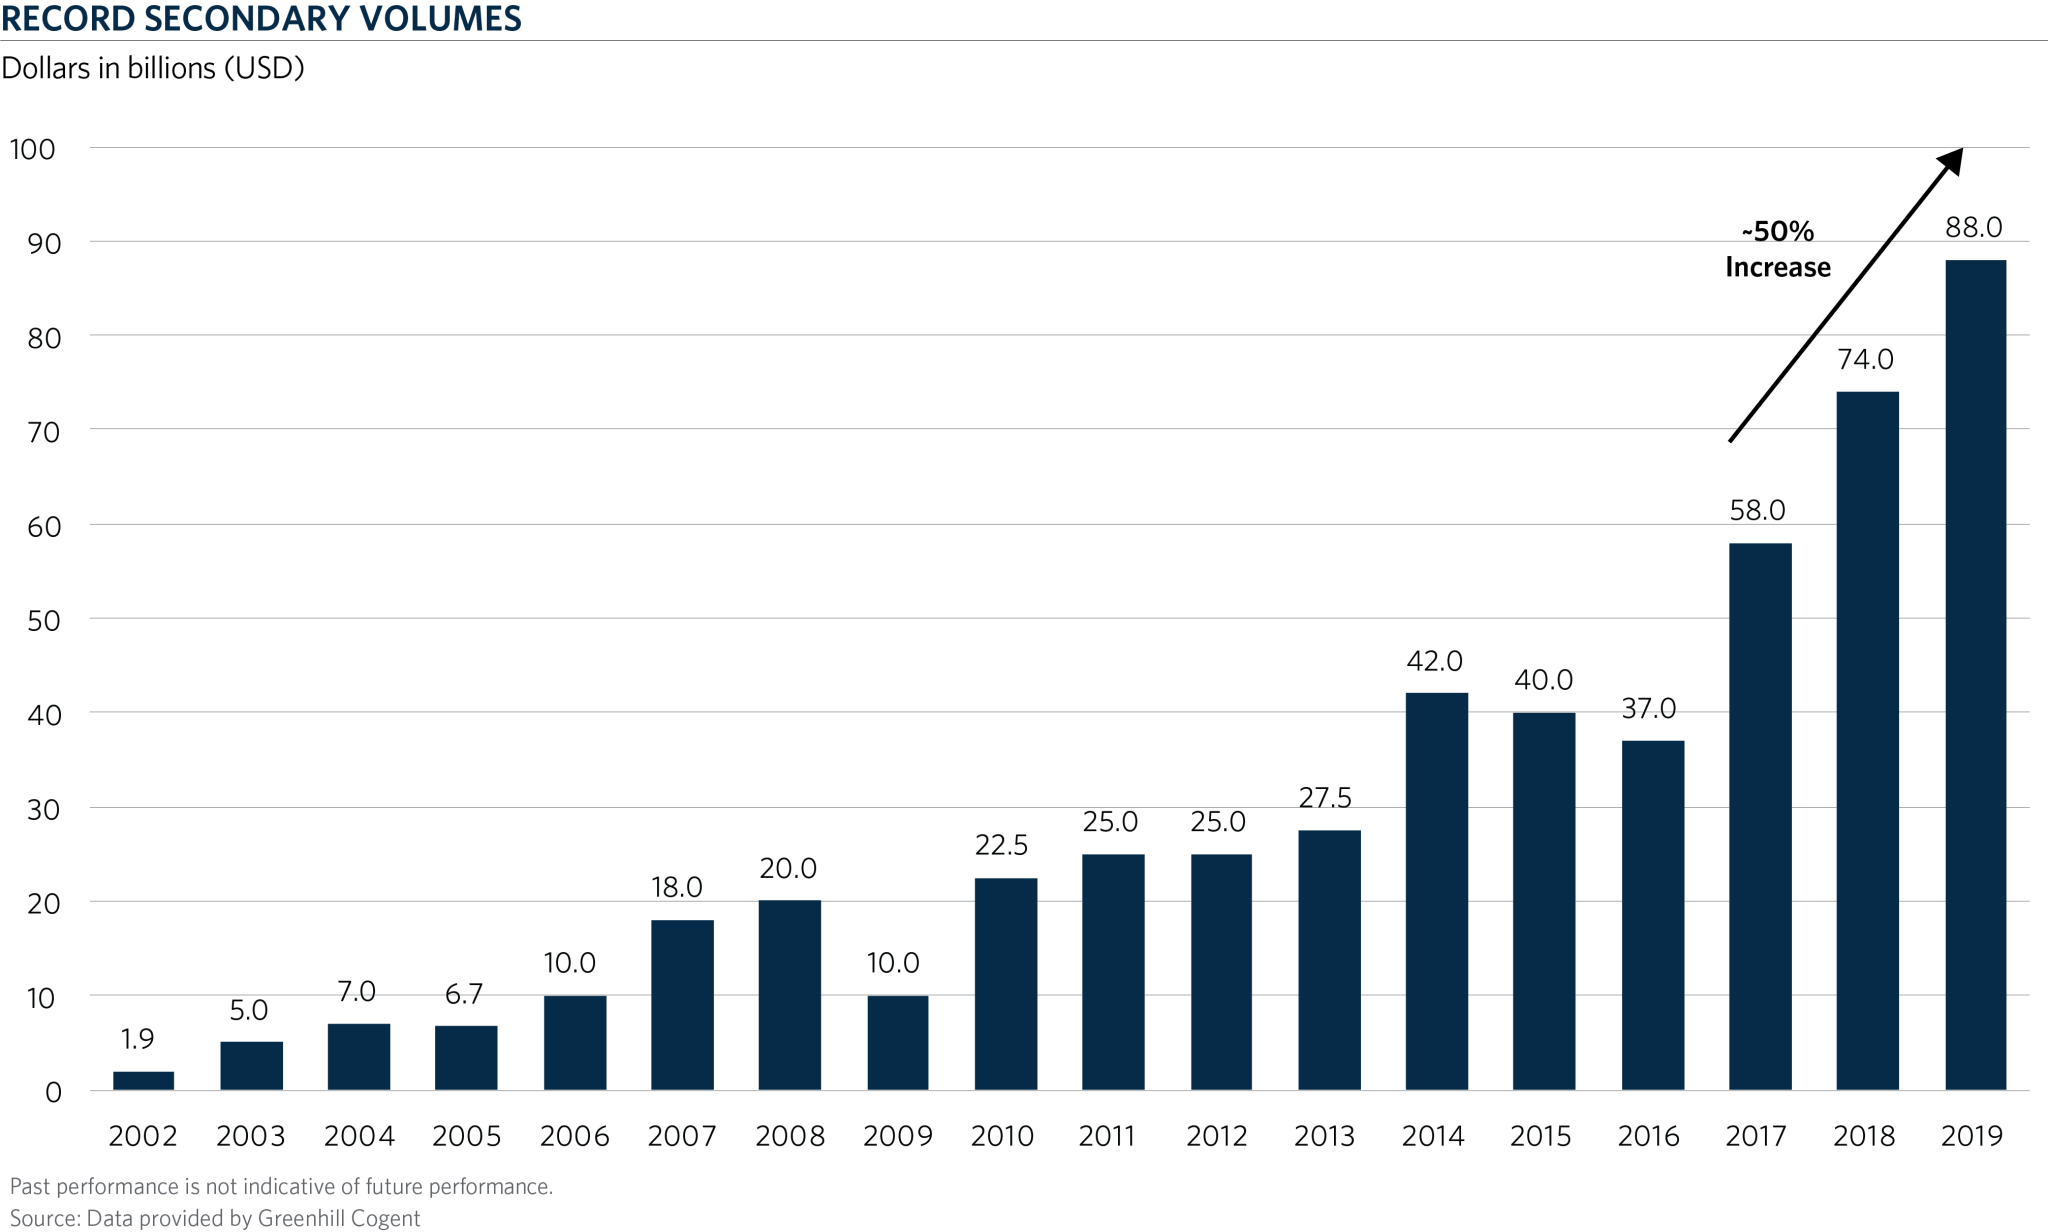
The secondary market remains small and inefficient. Even at the record $88 billion of deal flow last year2, the secondary market represents less than 2 percent of the overall $6.5 trillion private capital market3. Without COVID-19, we would have expected 2020 to be another record year. Some even projected that the annual secondary volume could reach $250 billion in the next 5 years. We believe that this medium-term prediction could still be achieved despite the current environment.
In the near term, however, given the pullback in the public markets, we expect that the secondary market will likely see a slowdown in the second and third quarters as we wait for March and June valuations. The private capital market values portfolio companies quarterly and in some cases only bi-annually (June and December).
According to secondary intermediaries, there is a strong pipeline of private capital investors who are looking to pursue secondary sales. However, most processes have been put on hold until 1Q20 and 2Q20 marks are available. In the meantime, we expect that there will be some secondary deal flow from distressed investors, as well as others looking to generate liquidity immediately to invest in what they may believe are unprecedented opportunities.
We would expect 2020 secondary volume to be approximately $40-50 billion contrasted with $88 billion in 2019, with a rebound in 2021 to $80-100 billion. The $520 billion in tail-end funds that exist today4 will continue to age and investors will continue to seek liquidity solutions. We believe that there may even be more desire to sell these positions.
As the chart below shows, a similar trend emerged in 2009 coming out of the global financial crisis. Deal flow halved in 2009 but rebounded to a record market in 2010.
One difference in the secondary market today versus the global financial crisis is the GP-led market (a secondary transaction initiated by the general partner of a fund to provide a liquidity option for all current limited partners). GP-led transactions represented 30 percent of the overall secondary market in 20195. We would expect to see a slowing of the opportunistic, high quality GP-led transactions. Instead, we believe that we may see some transactions with preferred equity solutions that help provide bridge capital to funds or solutions that help bridge to the post-COVID-19 world. In general, we would expect there to be fewer GP-led transactions.
Pricing
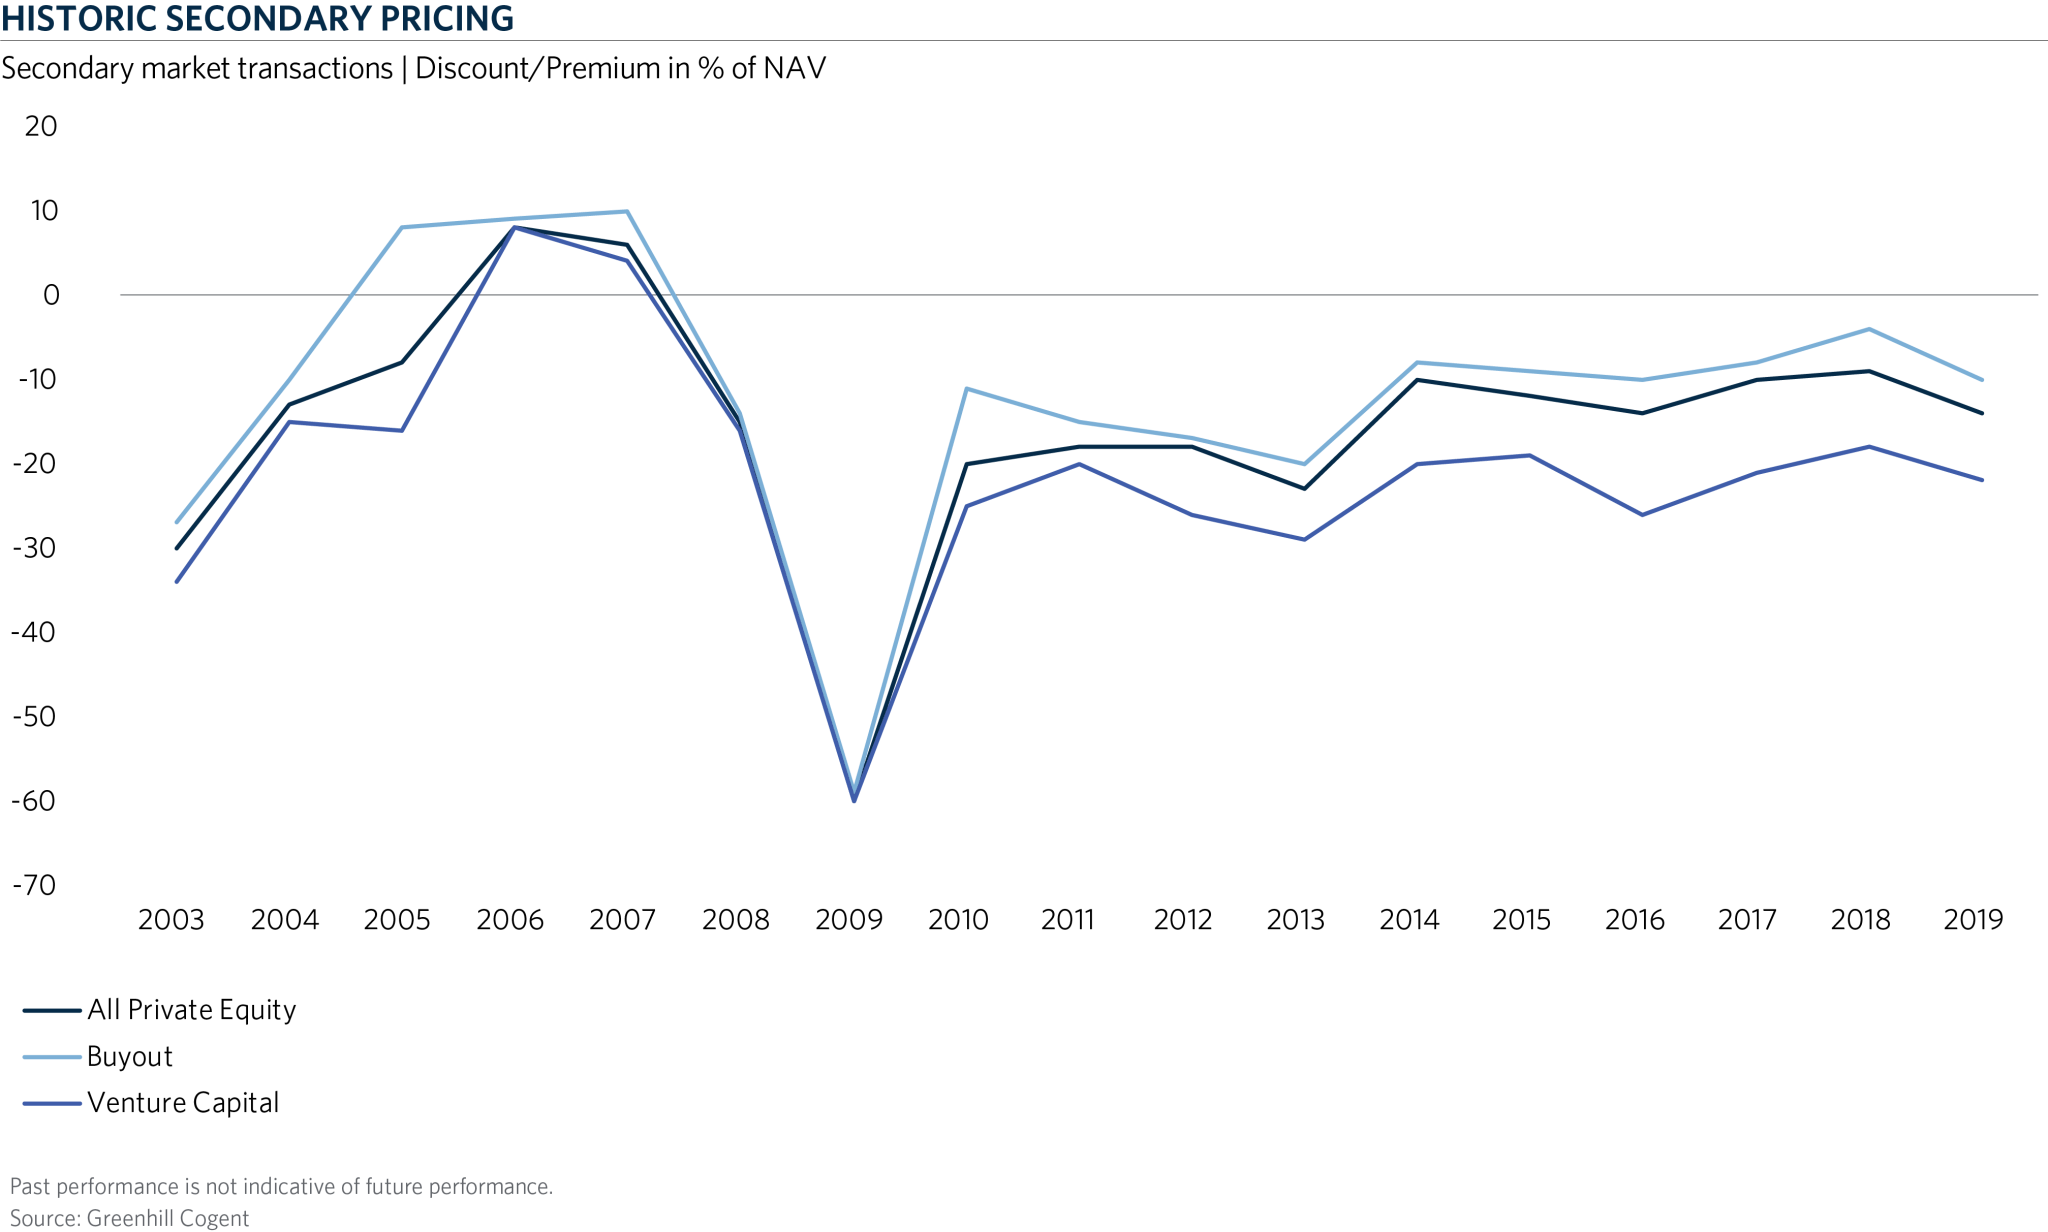
Only sellers who are distressed, or think they have other more attractive strategies to invest in, will likely stomach the massive discounts required to complete transactions in 2Q20 and 3Q20. In 4Q20 and into 2021 the bid/ask spread will narrow and because of that we would expect transaction volume to substantially increase.
Given the pullback in the public markets and the lag in valuations, steeper discounts are required today. We have seen transactions that were launched prior to March but not yet completed see substantial reductions in price.
Pricing is also impacted because the secondary market recorded its lowest overhang in 2019 (Near-term available capital/Last 12 months secondary market volume) of 1.6x. This means that the secondary funds could invest their funds in less than two years. The chart below shows the overhang ratios for the last six years.
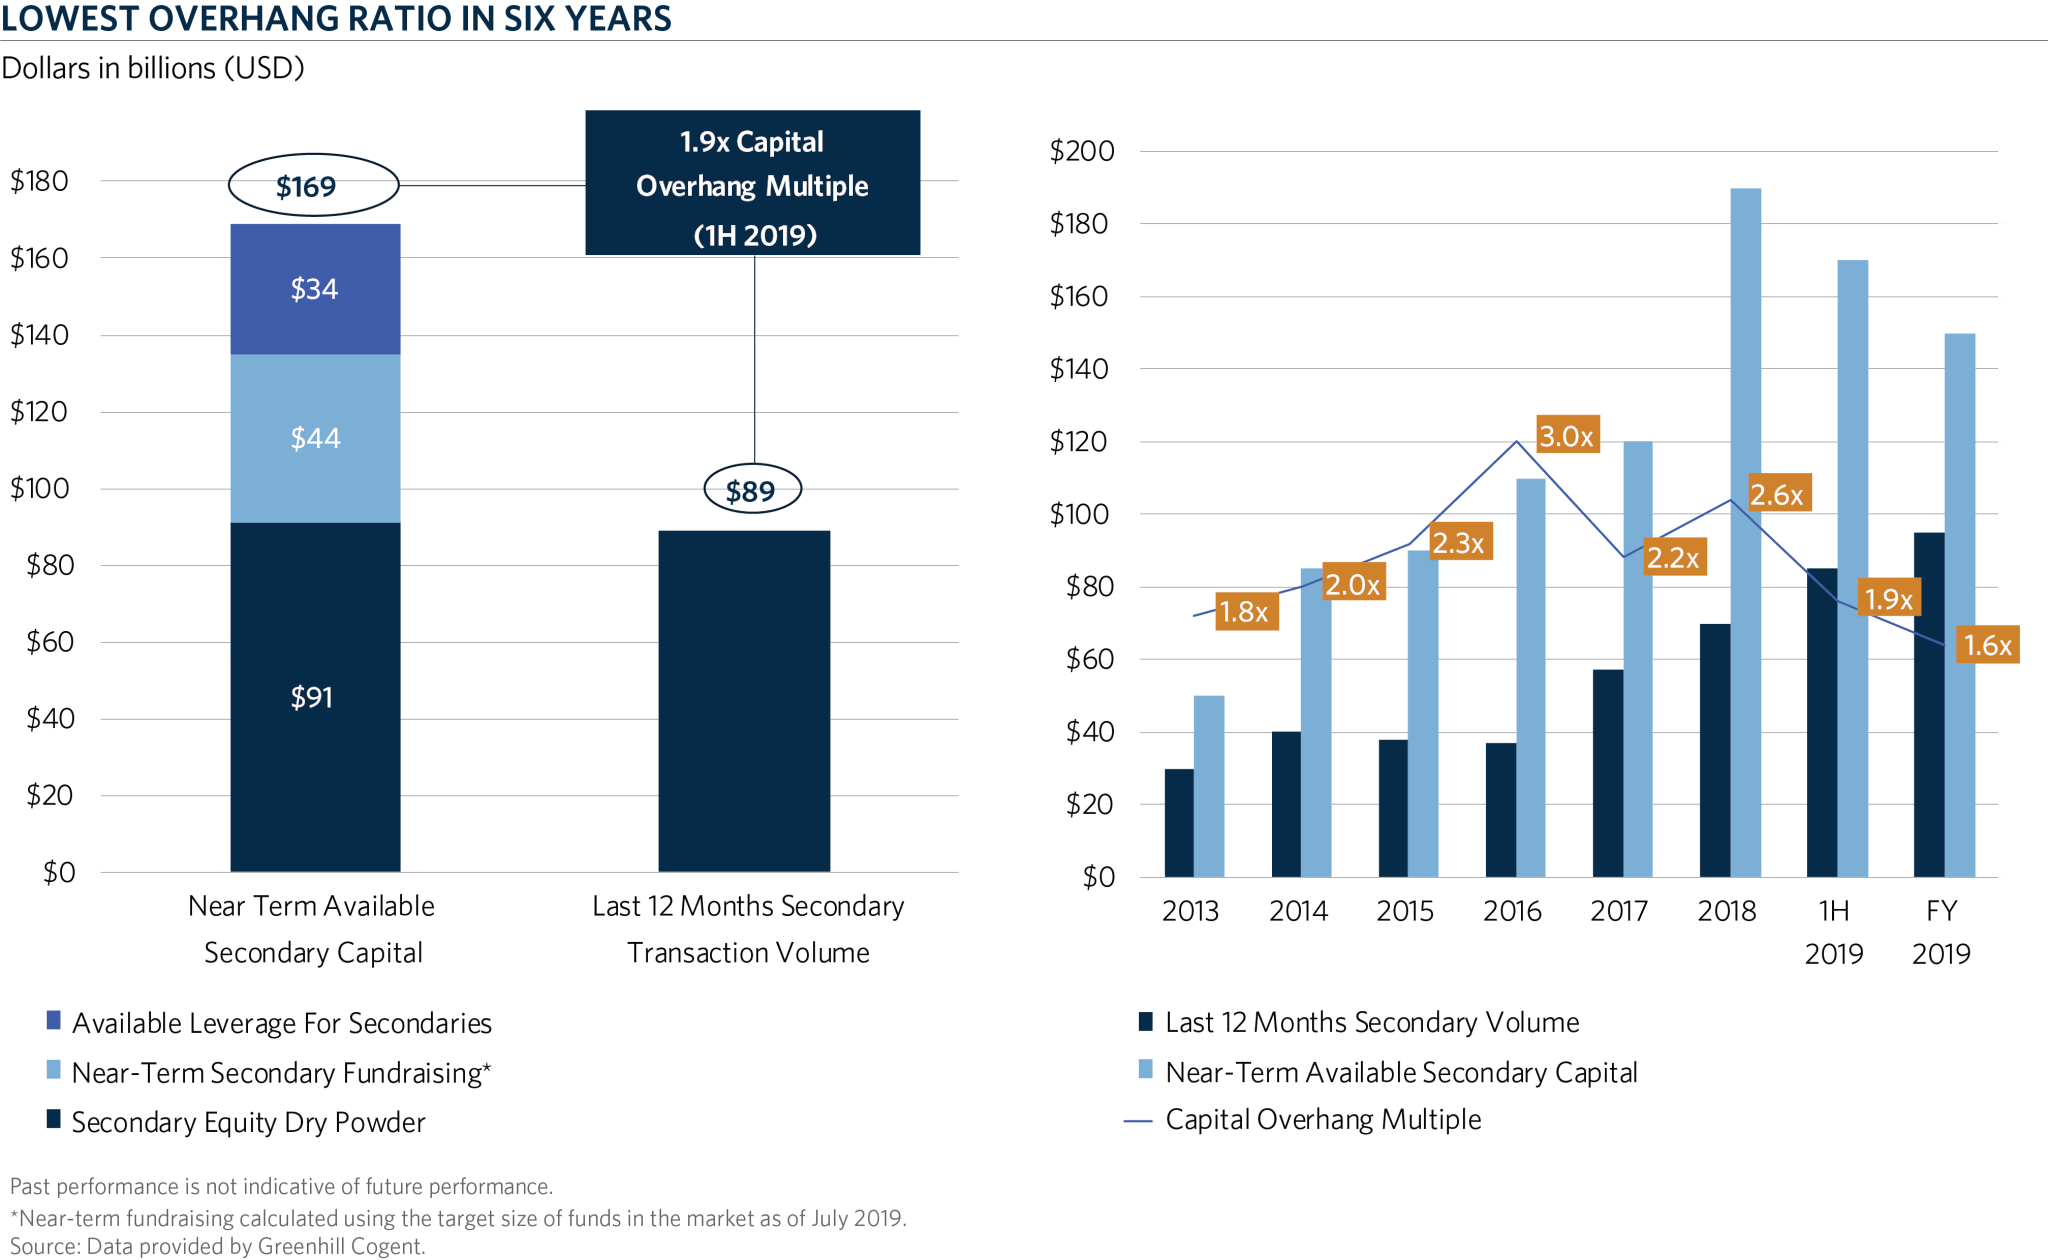
The hangover of the robust deal flow in 2019 is that most secondary funds feel no urgency to invest today. They can be patient and opportunistic. This should also apply downward pressure on pricing.
Drivers of Selling Activity
Private capital investors will need to evaluate their portfolios and find ways to create liquidity.
Capital Calls
General Partners are likely to call capital for both offensive and defensive reasons. We expect a significant decline in distributions in the coming quarters to fund these capital calls. This was evident in March 2020 as capital calls were up 64 percent with distributions down 72 percent from the year prior, for USD private capital funds6. Investors will have to find other sources of liquidity and may seek sales in the secondary market, especially in their older tail-end positions.
It is also possible that there will be an increase in capital calls as credit facilities roll off. Many investors have significant unfunded commitments to younger funds.
LPs Becoming Overallocated to Illiquid Investments (Denominator Effect)
According to a recent PEI survey, 51 percent of LPs were at or above their target allocations7. While lessons learned coming out of the global financial crisis have likely provided for more flexibility in these allocation targets—such as some investors considering private and public equity as one equity allocation—we would still expect to see pressure for liquidity. We would also expect to see certain limited partners selling because of the denominator effect.
Leverage and Volatility
Asset-based leverage in private capital portfolios may cause margin calls or a need for an equity cure. Investors may see more volatility and feel pressure to sell assets.
Increased Co-Investment Activity Leading Up to COVID-19 Pandemic
It has yet to be seen how investors who have increased their exposure to single assets through co-investments will react to the need for follow-on capital and impacts in valuation. It is possible that we see more activity through structured transactions or sales of co-investment portfolios.
Conclusion
Investors in the private capital markets are focused on the potential impacts of COVID-19 on their portfolios. General Partners are looking at their liquidity needs and ways to be both defensive and offensive in this environment. There may be parallels to be drawn from the global financial crisis that could lead to better pricing and opportunity in the secondary market.
- Wine.com Says Demand Doubled In March, With New Visits Up Sharply. Shaken News Daily (4/6/20)
- Source: Greenhill Cogent
- Source: McKinsey Global Private Markets Review 2020
- Tail-end funds defined as funds 10 years or older. Source: Greenhill Cogent as of July 2019
- Source: Global Secondary Market Trends & Outlook January 2020. Greenhill Cogent
- Investor Liquidity: Reading the Runes. Private Equity International (4/2/20)
- Lazard Impact of COVID-19 on the LP Secondary Market (April 2020)