Every year, the NACUBO-Commonfund Study of Endowments® (NCSE) reports new data—on investment returns, asset allocation, risk management, donations and gifts, and much more. But some data points are relatively static. Perhaps the prime example is the presence of a conflict of interest policy.
This year, 96 percent of Study respondents reported having such a policy. In Studies over the years, that figure can be counted on to remain above 95 percent. Underneath the basic existence of a broad policy, it is applied and interpreted in different ways, but the adoption of some type of conflict of interest policy is nearly universal. A few other data points are also fairly constant: We can infer that 91 percent of institutions adhere to some type of consistent spending policy discipline since this year only nine percent reported they decide on an appropriate spending rate each year. Eighty-six percent of respondents reported going beyond traditional asset class and strategy allocations to construct their portfolios using classifications that include risk reduction, inflation protection and liquidity among others. Both of these— articulating a spending policy and employing various classifications in portfolio construction— while not universal are practiced at very high rates.
That brings us to the matter of long-term investment objectives, the actual returns achieved over time and the investment policies that support the objectives of the endowment. One might surmise that adoption of a long-term investment objective for the endowment would be widespread among well-established, perpetual institutions with staff, trustee, consultant and/or investment manager resources to draw upon. In fact, this year, just 69 percent of institutions reported having long-term investment objectives. Twenty percent said they did not have long-term investment objectives and another 11 percent had no answer or were uncertain— indicating that if such an objective exists, it is foggy, ill-defined or poorly communicated. In recent years, a somewhat greater percentage of Study participants have reported having long-term investment objectives, ranging from 72 percent in FY2013 to 74 percent in fiscal years 2015 and 2016. Yet as far back as fiscal 2009 — the first year the Study was published as a joint effort of NACUBO and Commonfund Institute— 67 percent of institutions reported having long-term return targets, meaning that the overall rate of adoption is all but unchanged over the better part of a decade.
Rates of Adoption
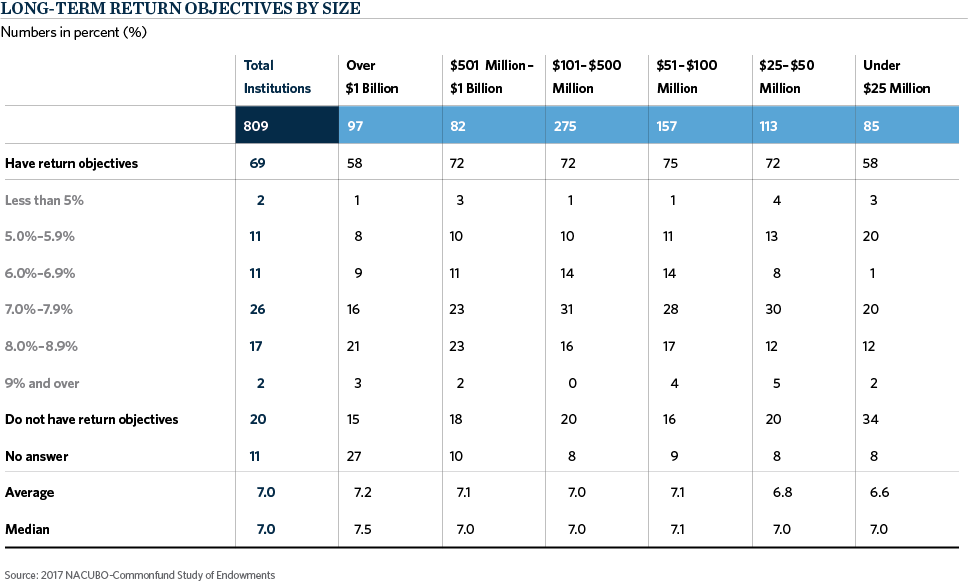
Even more surprising is the fact that the largest institutions are less likely than the Study universe to have a long-term investment objective. This year, just 58 percent of institutions with assets over $1 billion reported having one. Fifteen percent of this size cohort said they did not have an objective and 27 percent gave no answer. A similar 58 percent of the smallest participating institutions, those with assets under $25 million, said they did not have a long-term return target; in this instance, a full 34 percent reported having no investment objective. Among the other four size cohorts, adoption rates ranged from 72 percent (among three size categories) to 75 percent among institutions with assets between $51 and $100 million.
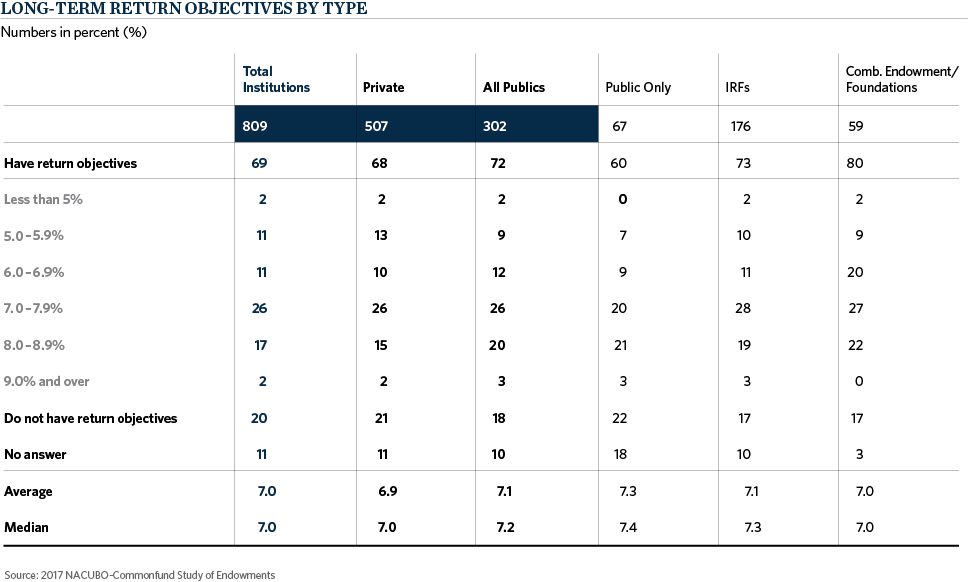
There is similar variability when the data are examined by type of institution. The highest rate of those with a long-term investment objective in FY2017 was 80 percent of combined endowment/foundations. The lowest rate, at 60 percent, was reported by public institutions. In between, 68 percent of private institutions and 73 percent of institution-related foundations (IRFs) reported having an investment objective.
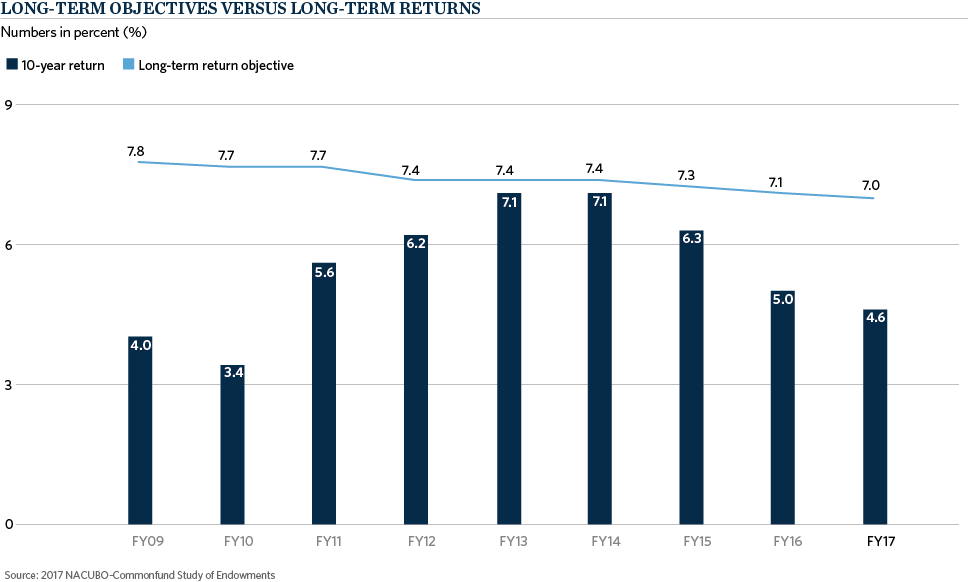
The relevance of—if not the outright need for—a long-term investment objective takes on a sense of urgency when one considers that endowments’ long-term investment performance does not appear to be delivering the returns necessary to cover annual spending and inflation.¹ The chart above illustrates this point by comparing 10-year trailing returns to long-term investment objectives for fiscal years 2009 through 2017. Not once in the nine-year period did the trailing 10-year return equal, much less surpass, the average long-term investment objective reported by respondents to the NCSE. Perhaps recognizing the gap between aspiration and reality, the average long-term investment objective has trended down over the period, from a high of 7.8 percent in FY2009 to a low of 7.0 percent in the current fiscal year.
To address this year’s Study data specifically, responding institutions earned an average annual return of 4.6 percent for the trailing 10-year period, yet this year they spent at an effective annual rate of 4.4 percent. The Higher Education Price Index (HEPI) reports that costs in fiscal 2017 rose at an annual rate of 3.7 percent (the highest since FY2008). To compare apples and apples, since the focus is on long-term returns, the average annual increase in HEPI for the past 10 years has been 2.4 percent, and the reported average annual effective spending rate for the past 10 years has been 4.4 percent. This suggests that a starting point for establishing an investment objective may be 6.8 percent (net of fees) or, in round terms, 7.0 percent— the figure needed to cover spending and inflation. In fact, that is in the modal range of return targets expressed by those FY2017 Study respondents with an investment objective. Twenty-six percent of respondents said their investment objective is in the 7.0–7.9 percent range. After that, 17 percent targeted returns between 8.0 and 8.9 percent and 11 percent each targeted returns of 6.0–6.9 percent and 5.0–5.9 percent. Only 2 percent said they seek a return of 9.0 percent or higher, and 2 percent target a return of less than 5.0 percent.
IPS Use Nearly Universal
While the adoption of a long-term investment objective is far from universal, we can say, with reasonable confidence, that a written investment policy statement (IPS) is close to it. The NCSE has not specifically inquired whether participants have such a policy, but, in addition to anecdotal evidence, there is some basis in history for this assertion. In its very first study (for FY2000), the predecessor to the NCSE (the Commonfund Benchmarks Study®) found that 91 percent of 563 participating institutions had a written investment policy (including 100 percent of institutions with assets of $501 million or more).
Most investment policies will advance objectives for the endowment. Typically, these objectives may be expressed as:
- Maintaining the real purchasing power of the fund after inflation, costs and spending (i.e., achieving intergenerational equity)
- Optimizing the fund’s risk-adjusted returns
- Providing a stable source of liquidity and financial support for the mission of the institution
Directly tied to the third objective is the expected annual contribution to the institution’s operating budget. There is specific data for this: The current NCSE reports that, on average, 7.9 percent of Study participants’ operating budget is funded by the endowment; this directly correlates to the size of the institution, as it ranges from an average of 12.1 percent of the annual budget of institutions with assets over $1 billion to 3.5 percent of the budget of institutions with assets under $25 million. Clearly, institutions rely on their endowments not only to support their mission in perpetuity but also to fund routine operations.
If, then, the endowment is expected to support the institution for both the long and short term, some sense of what the endowment is designed to deliver in terms of return seems reasonable. And constructing an endowment that supports the targeted return starts with the process of selecting a policy asset allocation. Investment committees design asset allocations with several thoughts in mind. Projected returns of various asset mixes are clearly a priority. But it is risk-adjusted returns that count, so the risks inherent in each asset allocation scheme are equally, if not more, important than projected returns. The point is that no coherent asset allocation policy can be designed and implemented without a return objective in mind. This view is widely held. To quote from a NACUBO/AGB publication:
To develop an asset allocation strategy, an investment committee must establish a return objective…[and] agree on a time horizon within which to meet its return objectives.²
Another recent publication on the subject captures a similar thought:
Defining the appropriate objectives is a critical element of any investment program…objectives for investment returns must be specific and measurable, so that the investment committee and the board can evaluate whether the portfolio is achieving its investment goals. These goals translate directly into an investment objective…³
Return Objectives and Risk
The selection of a return objective is also a major consideration in establishing the portfolio’s risk profile. One asset allocation mix may offer perceived safety to a board with a low tolerance for risk— but not support its spending policy. Another asset mix may be overly concentrated and produce top-tier returns when the allocation aligns with the market environment, but be overly susceptible to shifts in sentiment. Boards are highly unlikely to implement a proposed asset allocation without having an understanding of the risk-adjusted return it is projected to produce.
Thus, it is difficult to see how investment committees can do their job without knowing where they are going, i.e., having a long-term investment objective. It may be that they conduct their operations with an internal or “working” investment objective as a guideline or soft target, but do not confirm a specific long-term target as a written objective within the IPS. Instead, this document may express long-term objectives in terms of support for the institution’s mission (long term) and operations (short term) and leave numerical targets to the deliberations of the investment committee.
One of the main points of this discussion is the disparity between institutions’ long-term spending (plus inflation) and what has actually been delivered by endowment returns over the past 10 years. Recently, one other factor has emerged with the potential to widen that gap. We are referring to the Tax Cut and Jobs Act passed by Congress and signed into law by President Trump in December 2017. The act will impact the revenue streams of colleges and universities in many ways, but for purposes of this discussion the impact will be felt through anticipated reductions in charitable giving and a new tax.
Regarding the latter, the act imposes an excise tax of 1.4 percent on the net investment income of private colleges and universities that meet certain criteria, including assets (valued at the close of the previous tax year) of at least $500,000 per full-time student. Clearly, this provision will not affect many institutions—but it is likely to have an impact on institutions with the largest endowments, the very ones that are least likely to have long-term investment objectives, according to NCSE data over the years.
Conclusion
Perhaps it is time for long-term investment objectives to be adopted more widely as educational endowments address new challenges— including the new excise tax and the steepest one-year higher education inflation rate in a decade— but, above all, the historic shortfall when endowment returns over time are measured against spending rates and inflation.
