A Cost-Effective Approach to Hedge Fund Allocations: Part 1

October 1, 2018 |
3 minute read
|

At the risk of beating a dead horse, hedge funds are not an asset class.  This is especially true in the way in which Commonfund selects and constructs its hedge fund portfolios: focusing unambiguously on a broad range of disparate strategies designed to produce diversifying returns that are not the result of simple market (e.g., equity or credit) or factor risks (e.g., momentum or size).

Hedge funds do, however, warrant a slice of an institution’s asset allocation pie – but not for beta exposure.  We aim for pure alpha from our hedge funds and believe that the return, risk and correlation characteristics we can get from following this approach merit a strategic allocation of capital to hedge funds.

Our approach to hedge fund usage is atypical in the industry.  Broadly speaking, the institutional investing community accesses a meaningful portion of their total portfolio equity market risk from hedge fund allocations.  Furthermore, given the prevailing hedge fund fee structure (2 percent management fee and 20 percent incentive fee), these institutional investors are paying dearly for this market beta.  To be sure, many of these same institutional investors do get some alpha from their hedge fund investments; the problem is in the packaging and pricing (see our previous blog on bundling).  An increasingly less well-guarded secret of the hedge fund industry is that the market beta they provide is not special; it is, in fact, no different than the market beta one can access in an index fund.  It is just far more expensive!

Our approach to sizing hedge funds in a total asset allocation context is also differentiated from the industry.  We encourage a lower allocation to hedge funds than do our peers.

Examining Two Portfolios

Consider the following two investment portfolios.  Both deliver the same total portfolio equity market risk: an estimated beta of 0.77 to be exact.  Indeed, our mission-based clients rely on this equity risk to provide for growth and to protect purchasing power of their endowed pools.  The sources and costs of the beta being delivered are, however, quite different.

TB1-PortfolioA-B

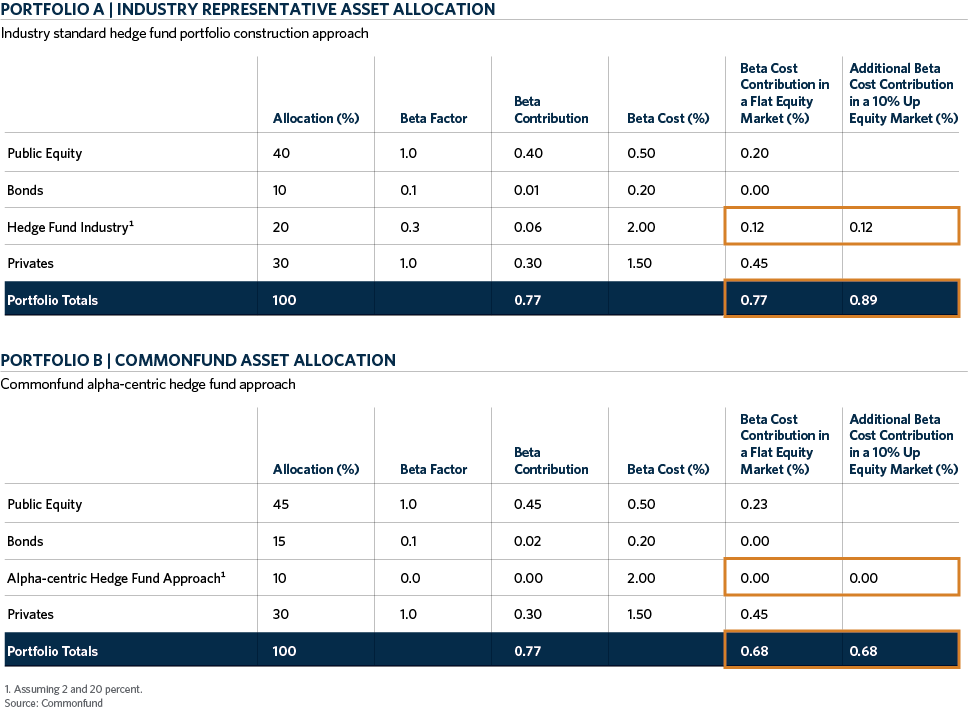
Portfolio A represents a typical institutional asset allocation and approach to hedge fund portfolio construction.  The keys in this allocation example are that:

  1. Hedge funds carry a 20 percent portfolio weight (based on the 2017 NACUBO-Commonfund Study of Endowments ).

  2. The beta factor (adjusts each allocation’s weight by the amount that can be explained primarily by equity market returns) applied to the hedge fund allocation is 0.3 (representative of the long term single factor beta of the HFRI Fund-of-Fund Index to the equity market).

Portfolio B, representative of Commonfund’s asset allocation framework that seeks to optimize for drawdown recovery time highlights a few important differences:

  1. The hedge fund allocation is reduced from 20 percent to 10 percent with the difference reallocated to more reasonably priced beta alternatives of public equity and bonds (in bonds we assume a 0.1 market beta .attributable to a credit component within the broader allocation).

  2. The beta factor assigned to the hedge fund portfolio is zero (reflecting our approach to eliminate market exposure in hedge fund portfolio construction).

The beta cost assumptions represent an approximate market average for active management, and are constant across the two portfolios to isolate the cost of equity beta.   Equally important to note is that both portfolios deliver the same amount of active risk (100 percent) in aggregate, so an investor is not giving up the potential excess return associated with active investing when they choose to allocate to the second portfolio.

An asset classes’ beta contribution is simply its allocation multiplied by its beta factor.  The sum of all beta contributions represents how much beta the institution is carrying at the total portfolio level.  Again, both portfolios carry equivalent amounts of beta risk.

Portfolio A is just paying a lot more for its beta allocation.

This can be seen in the beta cost contribution column.  Formulaically, beta cost contribution = allocation* beta factor* beta cost.

Why Pay More?

Focusing exclusively on the price paid for beta, all else being equal, in a flat equity market, Portfolio A is 9 basis points more costly than Portfolio B.  If the market goes up 10 percent in a year, tack on another 12 basis points to the cost of Portfolio A as an investor would pay a 20 percent incentive whether a hedge fund’s return is attributable to alpha or beta.  Why start out your investing day at this sort of disadvantage if you don’t have to?

In the context of our clients’ total asset allocations, we look to a hedge fund portfolio to serve as a ballast, a fixed income complement and a source of uncorrelated absolute return – not a source of market return which can be purchased for far less.

Stay tuned…In Part 2 of our blog we will examine reasonable expectations for hedge fund performance when portfolios are constructed with the alpha-centric approach we advocate.


Commonfund

Author

Commonfund

Disclaimer

Certain information contained herein has been obtained from or is based on third-party sources and, although believed to be reliable, has not been independently verified. Such information is as of the date indicated, if indicated, may not be complete, is subject to change and has not necessarily been updated. No representation or warranty, express or implied, is or will be given by The Common Fund for Nonprofit Organizations, any of its affiliates or any of its or their affiliates, trustees, directors, officers, employees or advisers (collectively referred to herein as “Commonfund”) or any other person as to the accuracy or completeness of the information in any third-party materials. Accordingly, Commonfund shall not be liable for any direct, indirect or consequential loss or damage suffered by any person as a result of relying on any statement in, or omission from, such third-party materials, and any such liability is expressly disclaimed.

All rights to the trademarks, copyrights, logos and other intellectual property listed herein belong to their respective owners and the use of such logos hereof does not imply an affiliation with, or endorsement by, the owners of such trademarks, copyrights, logos and other intellectual property.

To the extent views presented forecast market activity, they may be based on many factors in addition to those explicitly stated herein. Forecasts of experts inevitably differ. Views attributed to third-parties are presented to demonstrate the existence of points of view, not as a basis for recommendations or as investment advice. Market and investment views of third-parties presented herein do not necessarily reflect the views of Commonfund, any manager retained by Commonfund to manage any investments for Commonfund (each, a “Manager”) or any fund managed by any Commonfund entity (each, a “Fund”). Accordingly, the views presented herein may not be relied upon as an indication of trading intent on behalf of Commonfund, any Manager or any Fund.

Statements concerning Commonfund’s views of possible future outcomes in any investment asset class or market, or of possible future economic developments, are not intended, and should not be construed, as forecasts or predictions of the future investment performance of any Fund. Such statements are also not intended as recommendations by any Commonfund entity or any Commonfund employee to the recipient of the presentation. It is Commonfund’s policy that investment recommendations to its clients must be based on the investment objectives and risk tolerances of each individual client. All market outlook and similar statements are based upon information reasonably available as of the date of this presentation (unless an earlier date is stated with regard to particular information), and reasonably believed to be accurate by Commonfund. Commonfund disclaims any responsibility to provide the recipient of this presentation with updated or corrected information or statements. Past performance is not indicative of future results. For more information please refer to Important Disclosures.

Stay connected with the Insights Blog

Popular Blog Posts


Market Commentary | Insights Blog

Chart of the Month | U.S. Budget Deficit Hits Record Highs

In his first 100 days as President of the United States, Joe Biden has introduced three domestic funding proposals, totaling close to $6.0 Trillion, reflecting a desire to enhance the role of the...
Perspectives | Insights Blog

The Case for Using the Higher Education Price Index® (HEPI) to Define Inflation for Colleges

When calculating return targets for an endowment portfolio, a conventional piece of the equation is often the Consumer Price Index (CPI). CPI plus 5% is the common short-hand formula for institutions...
Market Commentary | Insights Blog

Chart of the Month | The Surprising Relationship Between Money Supply and Inflation

The potential for rising inflation is becoming a top concern for many investors and consumers. Many believe that inflation is already here as evidenced by price increases in commodities, homes,...

Disclaimer

Certain information contained herein has been obtained from or is based on third-party sources and, although believed to be reliable, has not been independently verified. Such information is as of the date indicated, if indicated, may not be complete, is subject to change and has not necessarily been updated. No representation or warranty, express or implied, is or will be given by The Common Fund for Nonprofit Organizations, any of its affiliates or any of its or their affiliates, trustees, directors, officers, employees or advisers (collectively referred to herein as “Commonfund”) or any other person as to the accuracy or completeness of the information in any third-party materials. Accordingly, Commonfund shall not be liable for any direct, indirect or consequential loss or damage suffered by any person as a result of relying on any statement in, or omission from, such third-party materials, and any such liability is expressly disclaimed.

All rights to the trademarks, copyrights, logos and other intellectual property listed herein belong to their respective owners and the use of such logos hereof does not imply an affiliation with, or endorsement by, the owners of such trademarks, copyrights, logos and other intellectual property.

To the extent views presented forecast market activity, they may be based on many factors in addition to those explicitly stated herein. Forecasts of experts inevitably differ. Views attributed to third-parties are presented to demonstrate the existence of points of view, not as a basis for recommendations or as investment advice. Market and investment views of third-parties presented herein do not necessarily reflect the views of Commonfund, any manager retained by Commonfund to manage any investments for Commonfund (each, a “Manager”) or any fund managed by any Commonfund entity (each, a “Fund”). Accordingly, the views presented herein may not be relied upon as an indication of trading intent on behalf of Commonfund, any Manager or any Fund.

Statements concerning Commonfund’s views of possible future outcomes in any investment asset class or market, or of possible future economic developments, are not intended, and should not be construed, as forecasts or predictions of the future investment performance of any Fund. Such statements are also not intended as recommendations by any Commonfund entity or any Commonfund employee to the recipient of the presentation. It is Commonfund’s policy that investment recommendations to its clients must be based on the investment objectives and risk tolerances of each individual client. All market outlook and similar statements are based upon information reasonably available as of the date of this presentation (unless an earlier date is stated with regard to particular information), and reasonably believed to be accurate by Commonfund. Commonfund disclaims any responsibility to provide the recipient of this presentation with updated or corrected information or statements. Past performance is not indicative of future results. For more information please refer to Important Disclosures.