Investment Manager Fees: Out of Sight, Out of Mind

May 22, 2019 |
3 minute read
|

One of the most pressing questions facing fiduciaries is that of investment management fees. We think it is a healthy and necessary discussion, as even small fees can have a big impact on performance and portfolio values, especially given the perpetual time horizon of most nonprofits. But, if you believe as we do, that alpha exists and is worth pursuing, then the the next question is; what is it worth? In our view, investors should focus their attention on value, meaning net of fee returns, rather than simply looking for the lowest gross fees.

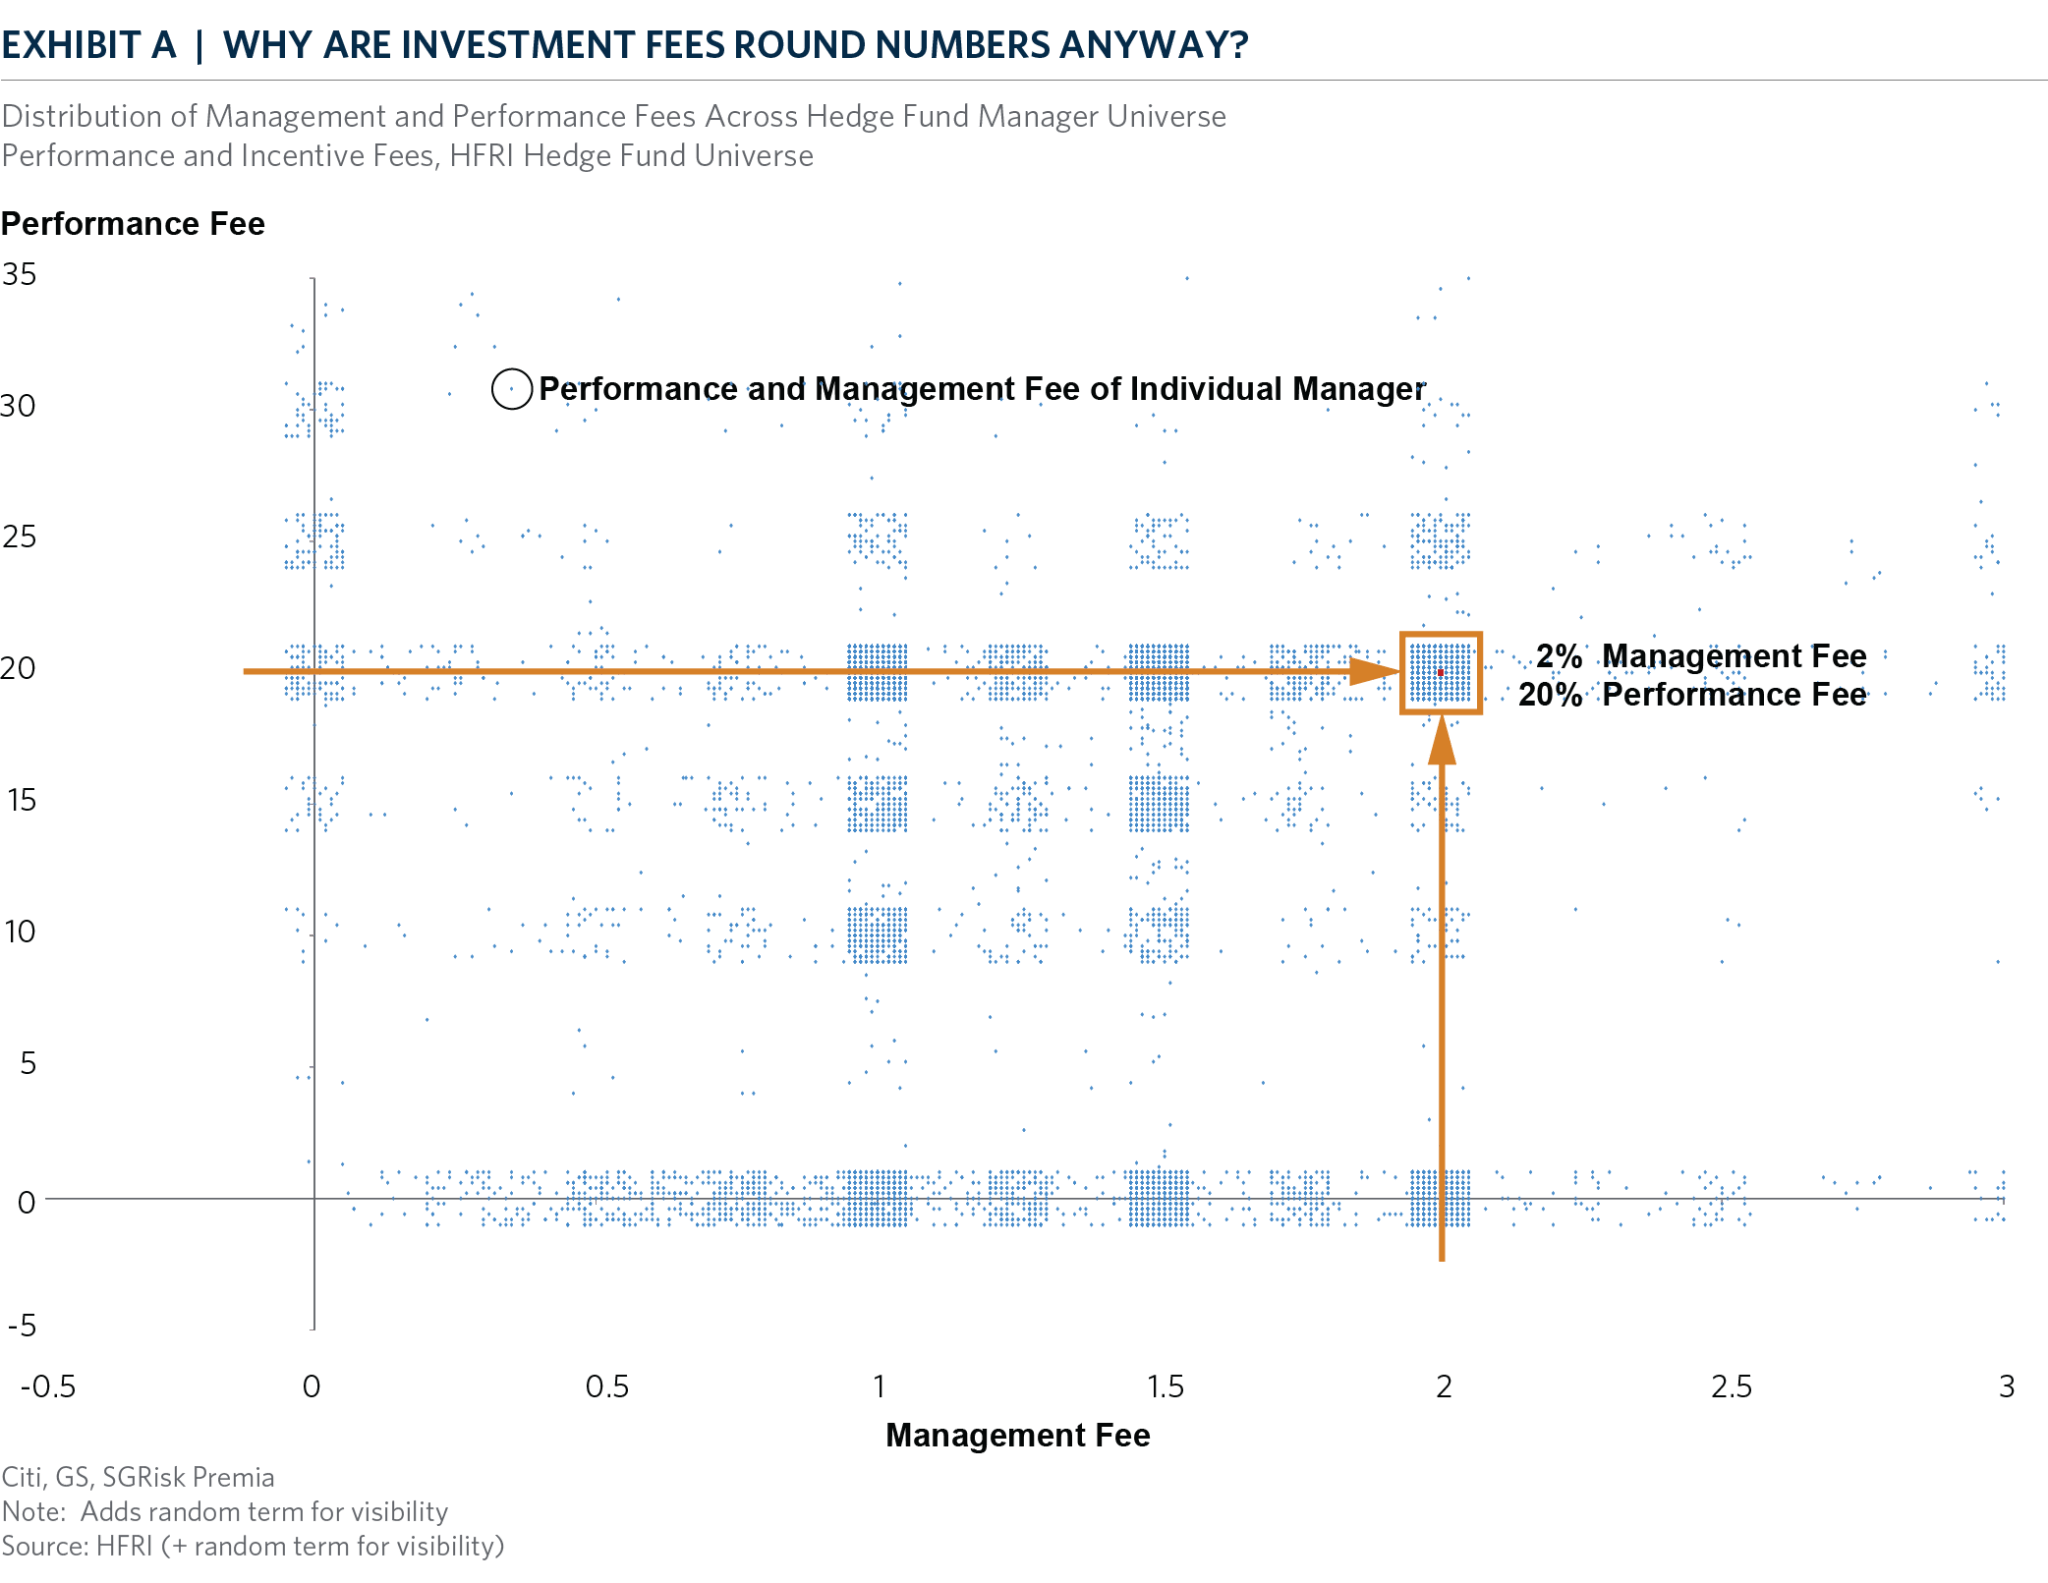
It is informative to look at hedge funds as we consider what fees we should be paying to a manager in return for excess performance. Exhibit A shows the fee schedules of all managers in the HFRI hedge fund universe. Each blue dot represents an individual manager plotted by their management and performance fees. One thing you can see immediately is that the blue dots are clustered into regular squares even though there are thousands of individual fee schedules. This tells us that most managers charge the same or similar fees, such as the commonly known 2 percent management fee and 20 percent performance fee (aka, 2 and 20). These squares also tell us something about investor behavior – it is a clear example of what we call “fee herding” – meaning this marketplace of buyers and sellers is inefficiently priced. Imagine if insurance companies charged the exact same fee for flood insurance on every house in America, regardless of location.

CH_01_Exhibit A_Why are Investment Fees Round Numbers Anyway

How do we determine the fair price for a manager?

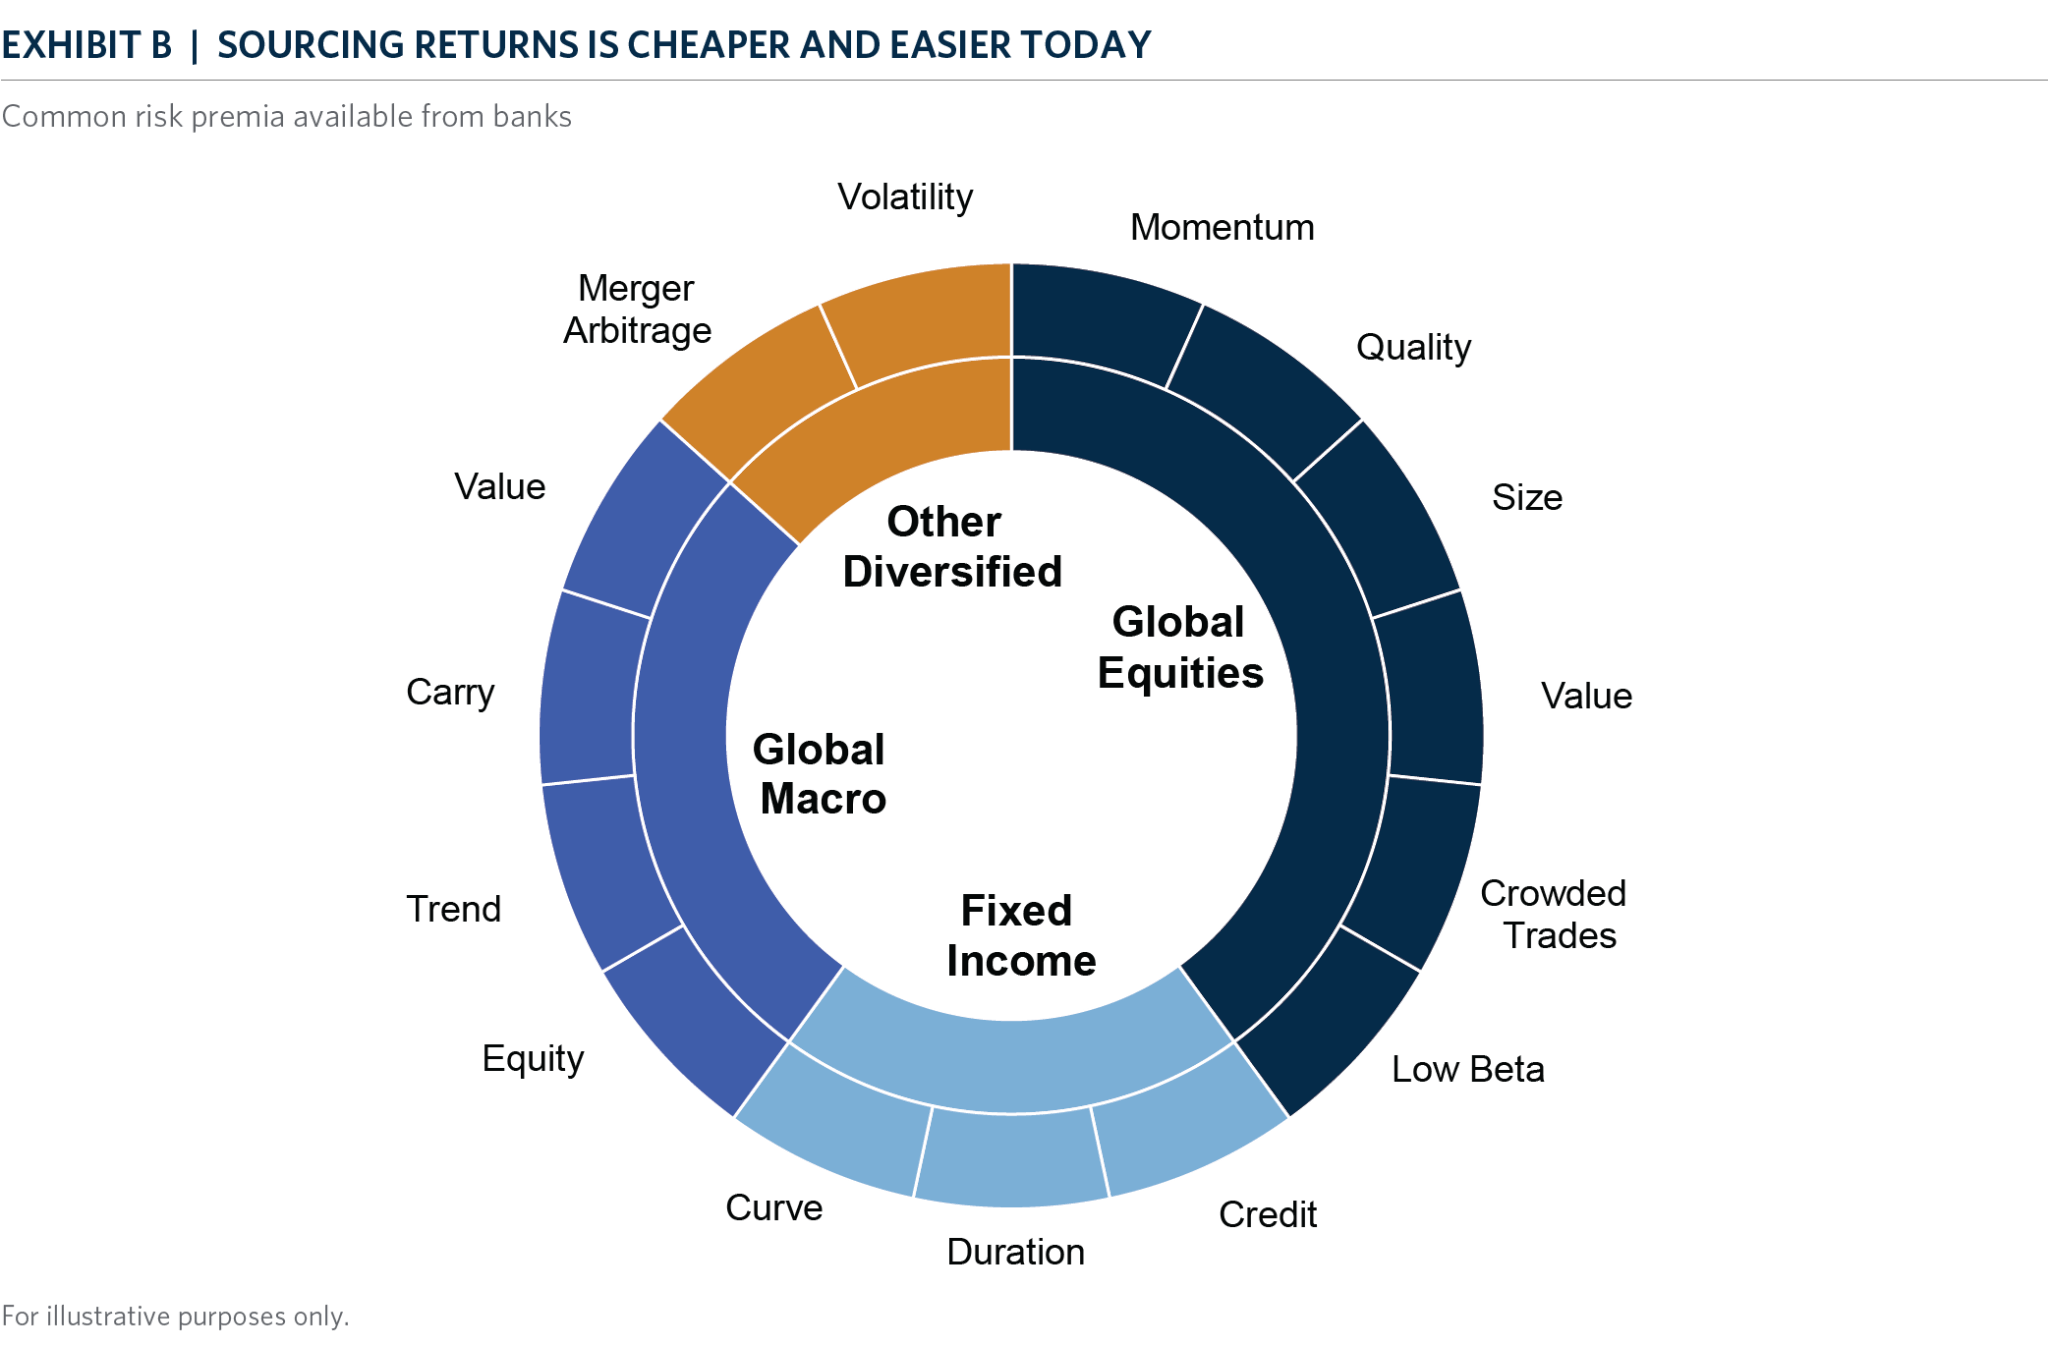
To assess the value of a manager, we start by understanding their returns – specifically, how closely we can replicate the manager’s strategy using inexpensive, easily accessible, liquid factor exposures. This step is like breaking a manager down into the sum of its parts. The building blocks that we use for this can include ETFs or simple equity market trackers, “smart beta” products, or other alternative sources from different beta providers. What these instruments all have in common is that they do not come with any performance fees. Exhibit B shows some of the many factor exposures that are available today.

CH_02_Exhibit B_Sourcing Returns is Cheaper and Easier Today

Starting with this analysis forms the basis for a clearer picture of the value that the manager represents, in comparison to the cost savings that can potentially be realized through a factor portfolio. In many cases, this analysis shows that a manager is far from the “low-cost” producer for their specific strategy.

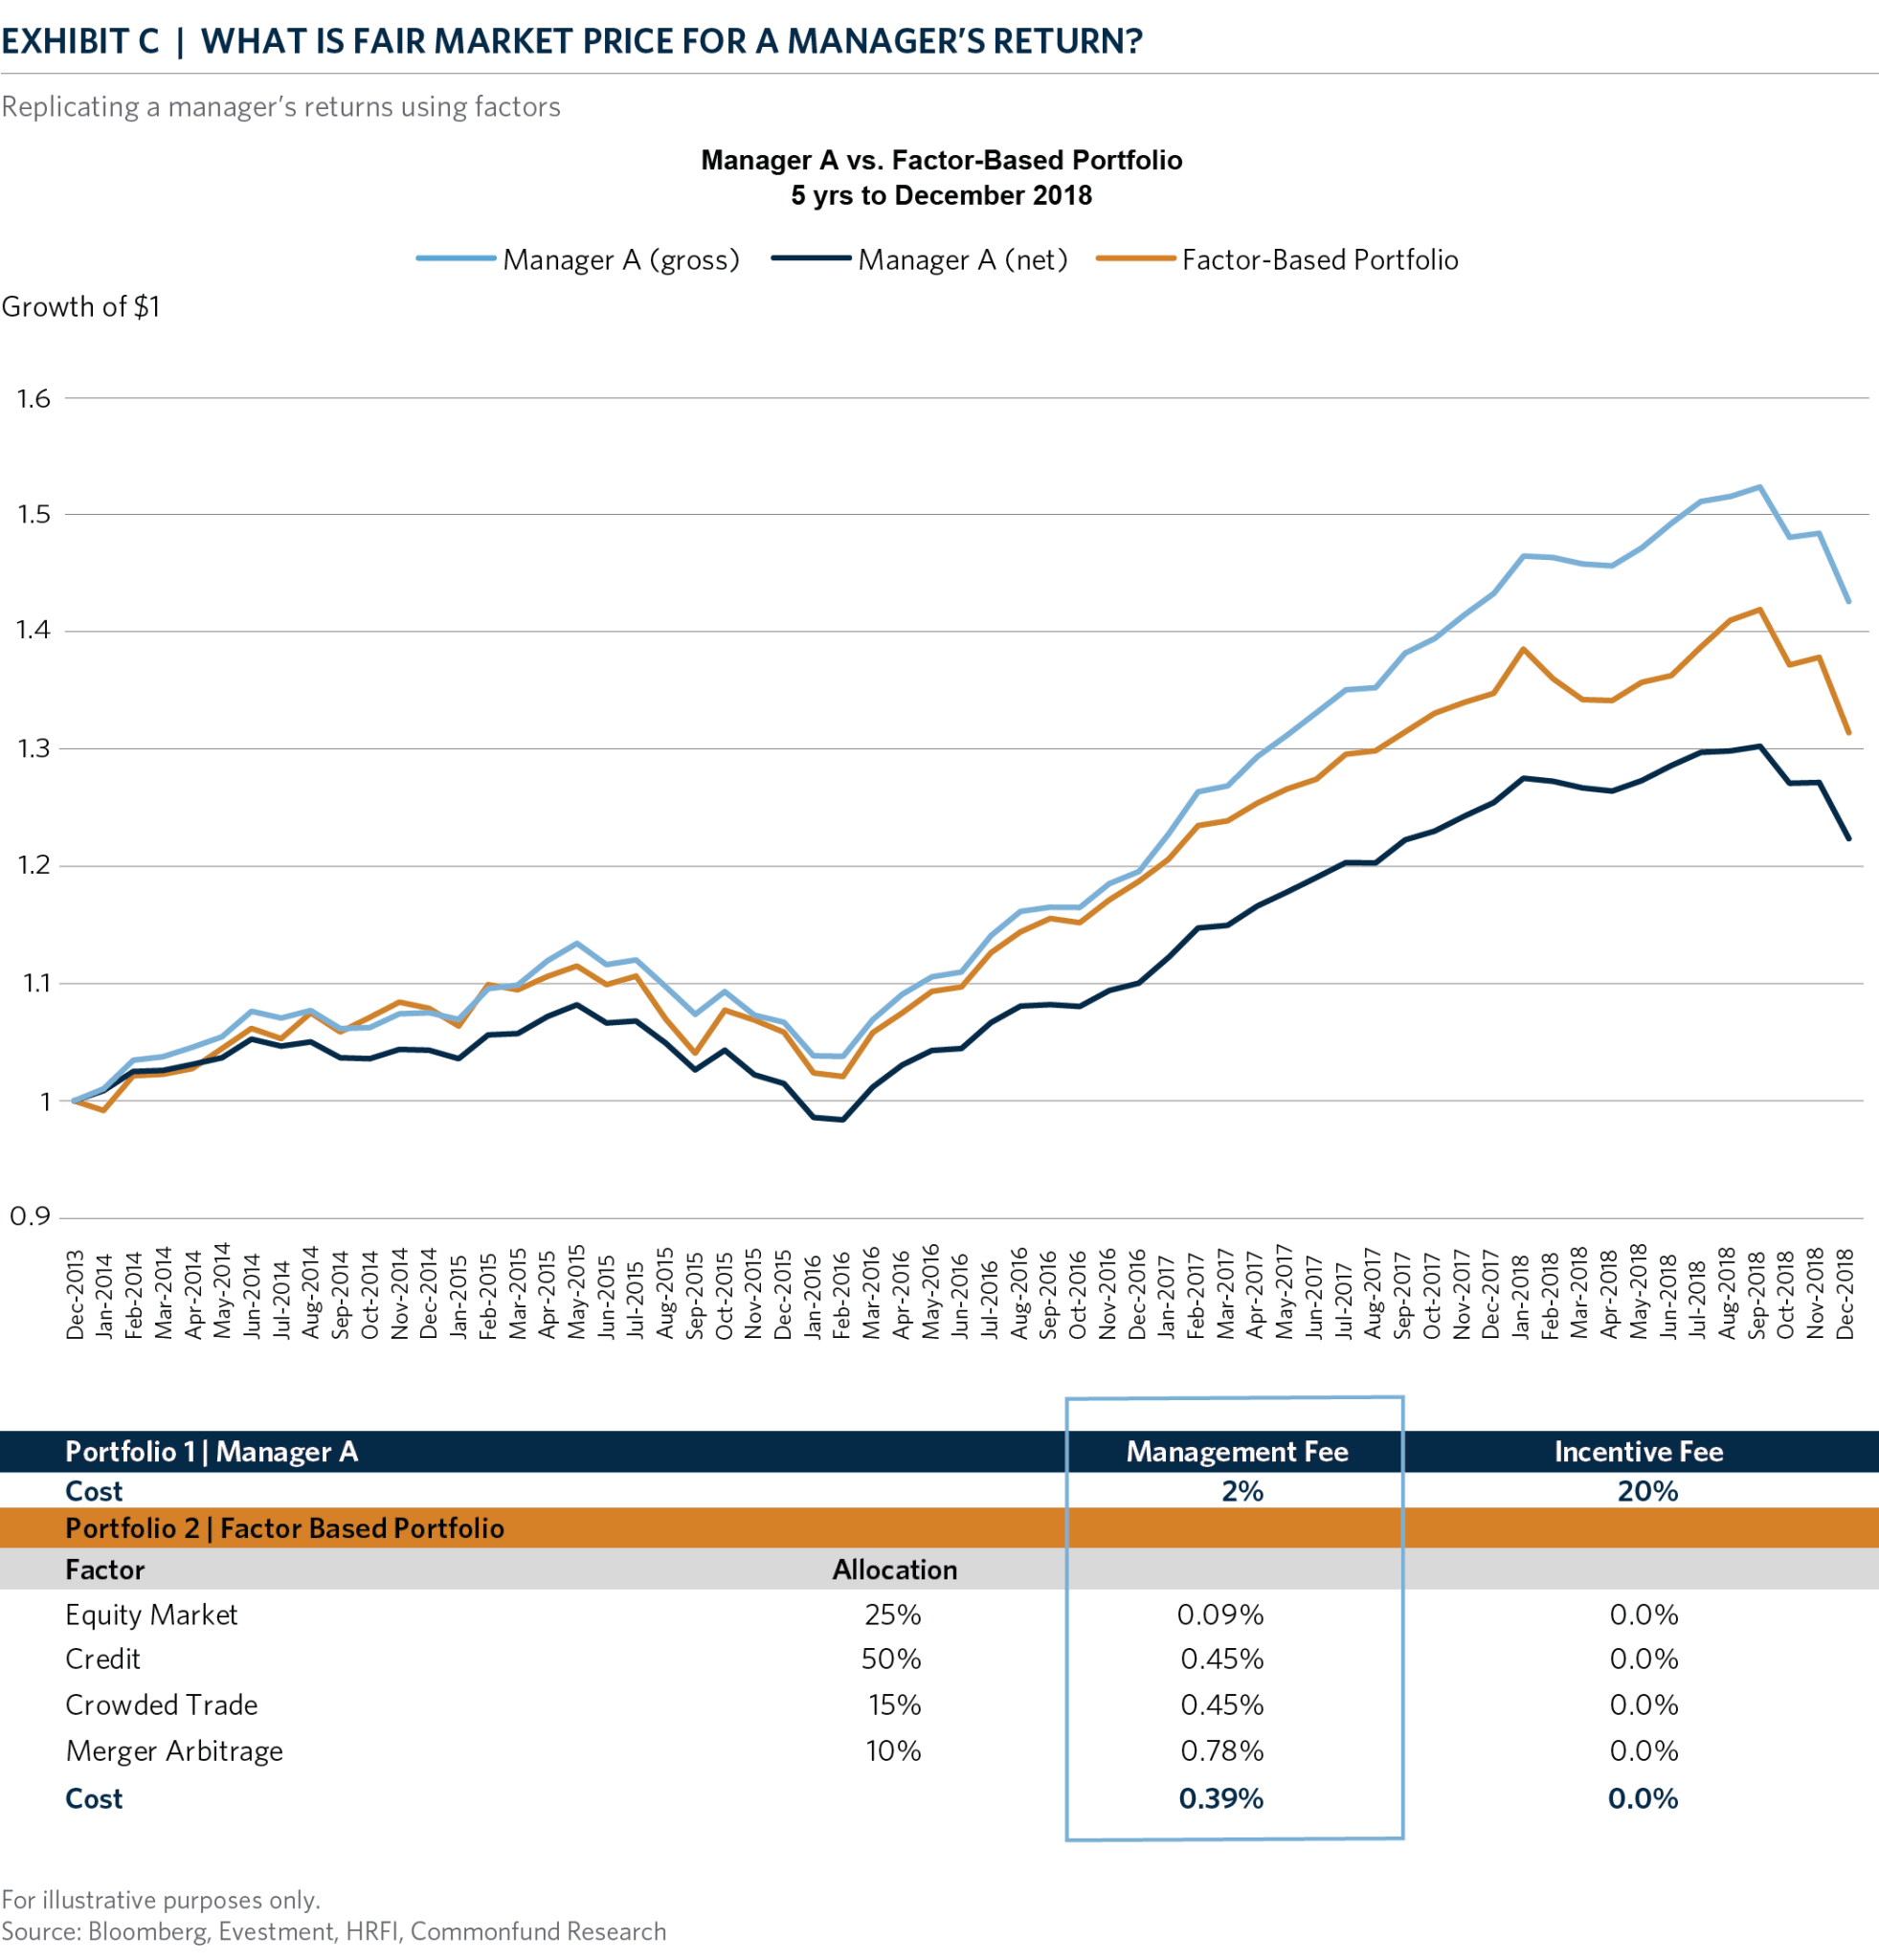
For example, Exhibit C shows the growth of a dollar invested in a large, well-known credit and event-driven hedge fund (manager A) alongside a factor-based replication portfolio constructed using four factors/sources of return: credit, merger arbitrage, equity market, and equities commonly held by hedge funds. The manager produced gross of fee returns of 7.4 percent but, net returns after two percent management fee and 20 percent performance fee are reduced to 4.1 percent. Meanwhile, the factor replication portfolio net of fee return is 5.6 percent. If bread costs $30 a loaf but we can buy flour and water and make it for less, the cost of the bread should come down. In this case, if we can replicate this manager that charges 2 percent management fee and 20 percent performance fee for just 39 basis points, then there may be a discrepancy in their value proposition.

CH_03_Exhibit C_What is Fair Market Price for a Mgrs Rtn - Replicating Mgrs Rtn Factors

Calculating the fee indifference curve

This analysis may conclude that a manager is overpriced or appropriately priced. In any case, it is a starting point to further evaluate how different combinations of management and performance fees affect the returns the manager ultimately delivers, and how we can evaluate those trade-offs.

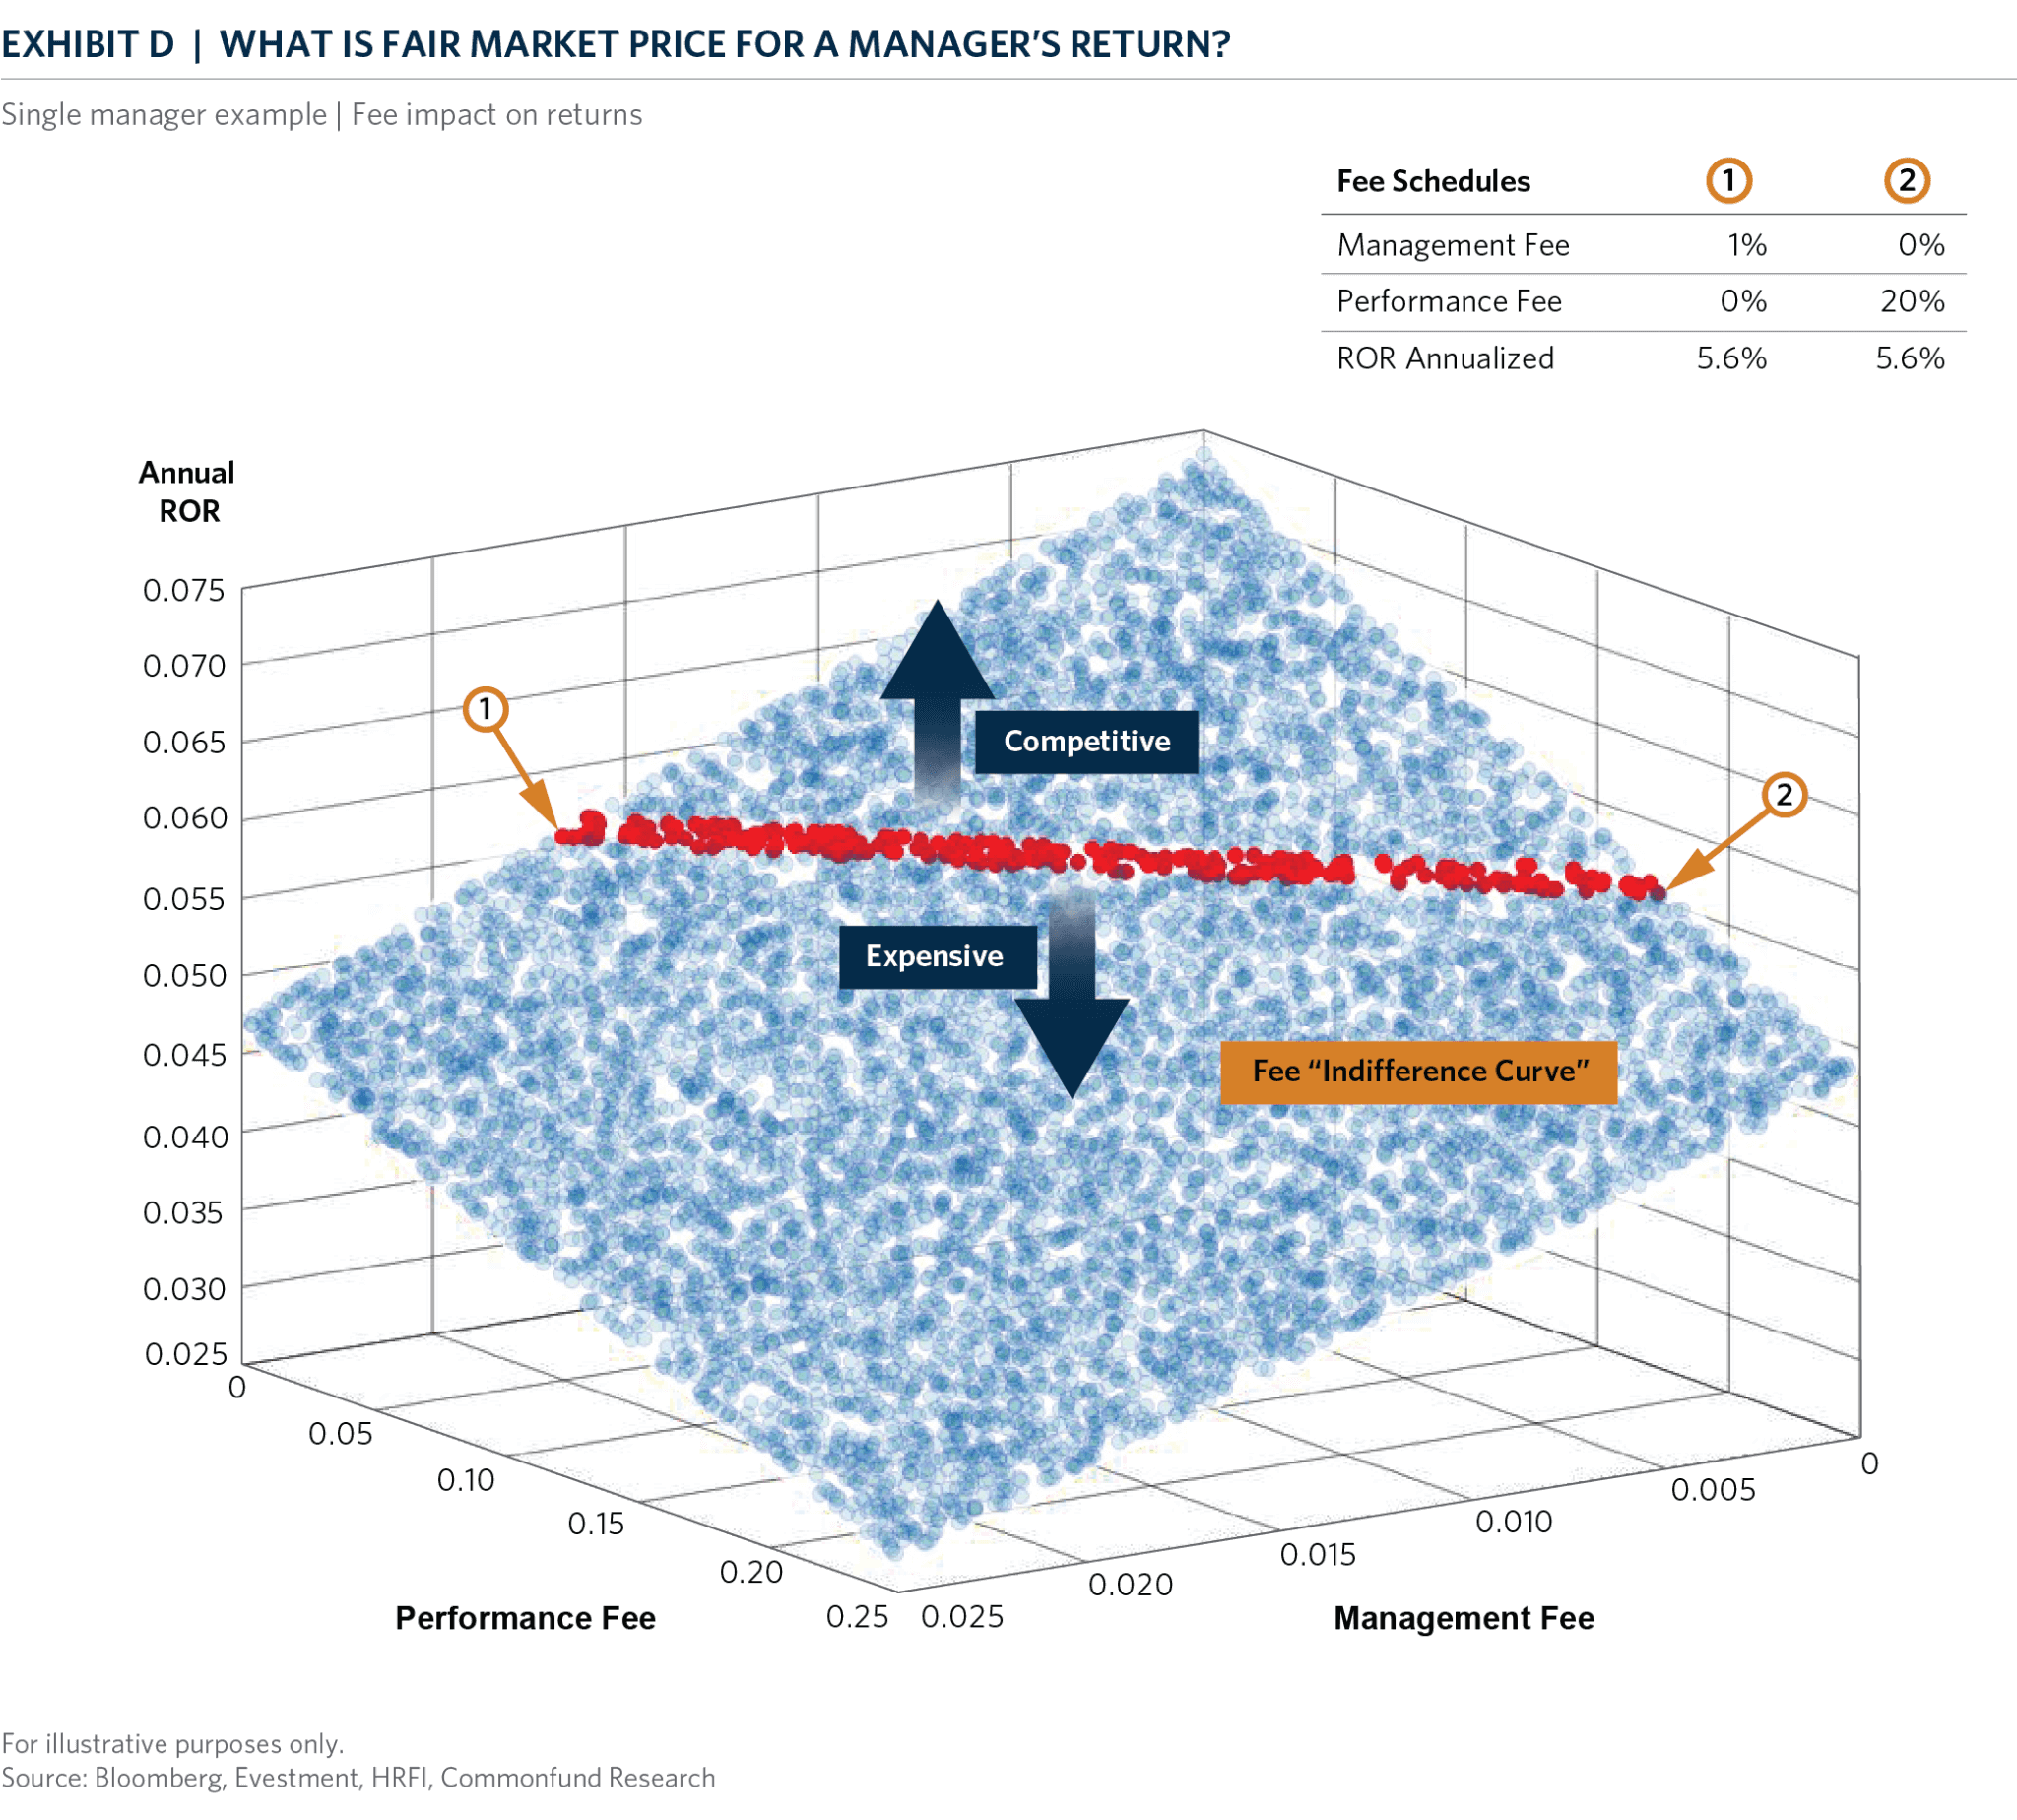
Exhibit D quantifies this trade-off: each blue dot represents the result when the manager’s gross returns are subjected to many different fee schedules, varying from 0 to 2.5 percent management fee and from 0 to 25 percent performance fee. In this example, a factor portfolio that comes close to replicating the manager’s strategy and would therefore play a comparable role in a portfolio demonstrates a hypothetical return of 5.6 percent. That’s the point, shown in red, at which all things equal we are “indifferent” to the fees.

All the other potential combinations of management and performance fees that result in that same net return of 5.6 percent are on the red line–we call this the “fee indifference curve”. The fee combinations below this red line are deemed expensive and those above the line are competitive.

CH_04_Exhibit D_What is Fair Market Price for a Mgrs Rtn - Single Mgr - Fee impact on returns

While the manager’s return gross of fees cannot be entirely matched by a factor portfolio, the replicating portfolio does provide a frame of reference for determining how much we can accept in either management, performance fees, or both, allowing us to pay the right price for the manager’s “loaf of bread.”

This is a critical part of our manager evaluation and due diligence at Commonfund because years of running this analysis have shown us that most managers are not competitive – allowing us to focus on only those managers that we deem to be delivering a superior value.

In part two of this blog series we will delve into fee alignment – our approach to ensuring that we not only have secured a good value but that we are also properly incentivizing the investment manager while maximizing net returns for the investor. Sign up for the Commonfund Insights Blog to assure you get this next installment delivered directly to your inbox.

Kristofer Kwait

Author

Kristofer Kwait

Chief Market Strategist

Kristofer Kwait

Author

John Delano

Managing Director, Head of Research and Analytics

Disclaimer

Certain information contained herein has been obtained from or is based on third-party sources and, although believed to be reliable, has not been independently verified. Such information is as of the date indicated, if indicated, may not be complete, is subject to change and has not necessarily been updated. No representation or warranty, express or implied, is or will be given by The Common Fund for Nonprofit Organizations, any of its affiliates or any of its or their affiliates, trustees, directors, officers, employees or advisers (collectively referred to herein as “Commonfund”) or any other person as to the accuracy or completeness of the information in any third-party materials. Accordingly, Commonfund shall not be liable for any direct, indirect or consequential loss or damage suffered by any person as a result of relying on any statement in, or omission from, such third-party materials, and any such liability is expressly disclaimed.

All rights to the trademarks, copyrights, logos and other intellectual property listed herein belong to their respective owners and the use of such logos hereof does not imply an affiliation with, or endorsement by, the owners of such trademarks, copyrights, logos and other intellectual property.

To the extent views presented forecast market activity, they may be based on many factors in addition to those explicitly stated herein. Forecasts of experts inevitably differ. Views attributed to third-parties are presented to demonstrate the existence of points of view, not as a basis for recommendations or as investment advice. Market and investment views of third-parties presented herein do not necessarily reflect the views of Commonfund, any manager retained by Commonfund to manage any investments for Commonfund (each, a “Manager”) or any fund managed by any Commonfund entity (each, a “Fund”). Accordingly, the views presented herein may not be relied upon as an indication of trading intent on behalf of Commonfund, any Manager or any Fund.

Statements concerning Commonfund’s views of possible future outcomes in any investment asset class or market, or of possible future economic developments, are not intended, and should not be construed, as forecasts or predictions of the future investment performance of any Fund. Such statements are also not intended as recommendations by any Commonfund entity or any Commonfund employee to the recipient of the presentation. It is Commonfund’s policy that investment recommendations to its clients must be based on the investment objectives and risk tolerances of each individual client. All market outlook and similar statements are based upon information reasonably available as of the date of this presentation (unless an earlier date is stated with regard to particular information), and reasonably believed to be accurate by Commonfund. Commonfund disclaims any responsibility to provide the recipient of this presentation with updated or corrected information or statements. Past performance is not indicative of future results. For more information please refer to Important Disclosures.

Stay connected with the Insights Blog

Popular Blog Posts


Market Commentary | Insights Blog

Chart of the Month | U.S. Budget Deficit Hits Record Highs

In his first 100 days as President of the United States, Joe Biden has introduced three domestic funding proposals, totaling close to $6.0 Trillion, reflecting a desire to enhance the role of the...
Perspectives | Insights Blog

The Case for Using the Higher Education Price Index® (HEPI) to Define Inflation for Colleges

When calculating return targets for an endowment portfolio, a conventional piece of the equation is often the Consumer Price Index (CPI). CPI plus 5% is the common short-hand formula for institutions...
Market Commentary | Insights Blog

Chart of the Month | The Surprising Relationship Between Money Supply and Inflation

The potential for rising inflation is becoming a top concern for many investors and consumers. Many believe that inflation is already here as evidenced by price increases in commodities, homes,...

Disclaimer

Certain information contained herein has been obtained from or is based on third-party sources and, although believed to be reliable, has not been independently verified. Such information is as of the date indicated, if indicated, may not be complete, is subject to change and has not necessarily been updated. No representation or warranty, express or implied, is or will be given by The Common Fund for Nonprofit Organizations, any of its affiliates or any of its or their affiliates, trustees, directors, officers, employees or advisers (collectively referred to herein as “Commonfund”) or any other person as to the accuracy or completeness of the information in any third-party materials. Accordingly, Commonfund shall not be liable for any direct, indirect or consequential loss or damage suffered by any person as a result of relying on any statement in, or omission from, such third-party materials, and any such liability is expressly disclaimed.

All rights to the trademarks, copyrights, logos and other intellectual property listed herein belong to their respective owners and the use of such logos hereof does not imply an affiliation with, or endorsement by, the owners of such trademarks, copyrights, logos and other intellectual property.

To the extent views presented forecast market activity, they may be based on many factors in addition to those explicitly stated herein. Forecasts of experts inevitably differ. Views attributed to third-parties are presented to demonstrate the existence of points of view, not as a basis for recommendations or as investment advice. Market and investment views of third-parties presented herein do not necessarily reflect the views of Commonfund, any manager retained by Commonfund to manage any investments for Commonfund (each, a “Manager”) or any fund managed by any Commonfund entity (each, a “Fund”). Accordingly, the views presented herein may not be relied upon as an indication of trading intent on behalf of Commonfund, any Manager or any Fund.

Statements concerning Commonfund’s views of possible future outcomes in any investment asset class or market, or of possible future economic developments, are not intended, and should not be construed, as forecasts or predictions of the future investment performance of any Fund. Such statements are also not intended as recommendations by any Commonfund entity or any Commonfund employee to the recipient of the presentation. It is Commonfund’s policy that investment recommendations to its clients must be based on the investment objectives and risk tolerances of each individual client. All market outlook and similar statements are based upon information reasonably available as of the date of this presentation (unless an earlier date is stated with regard to particular information), and reasonably believed to be accurate by Commonfund. Commonfund disclaims any responsibility to provide the recipient of this presentation with updated or corrected information or statements. Past performance is not indicative of future results. For more information please refer to Important Disclosures.