Summary
- TODAY, THERE IS A GOOD DEAL OF HAND WRINGING OVER THE RISK OF RISING RATES.
- WHILE RISING LONG-TERM RATES COULD BE A HEADWIND FOR CORE FIXED INCOME, AS LONG AS RATES RISE FAIRLY MODESTLY THE IMPACT SHOULD NOT BE TOO GREAT.
- THE MOST LIKELY SCENARIOS SUPPORT A MODEST UNDERWEIGHT TO CORE FIXED INCOME IN POLICY PORTFOLIOS.
When You Need Fixed Income the Most
Most institutional portfolios have strategic allocations to core (investment grade) fixed income, and for good reasons. Core fixed income can serve as an anchor during times when risk assets such as equities and lower grade credit are under assault. The two most extreme such periods in recent history were the tech crisis (2000-2002) and the financial crisis (2007-2009). Using the Bloomberg Barclays U.S. Aggregate Bond Index (“Barclays Agg”) as our proxy for core fixed income, the historical total return charts in Exhibits 1 and 2 show how core fixed income acted as a safe haven during these periods of market turmoil.
EXHIBIT 1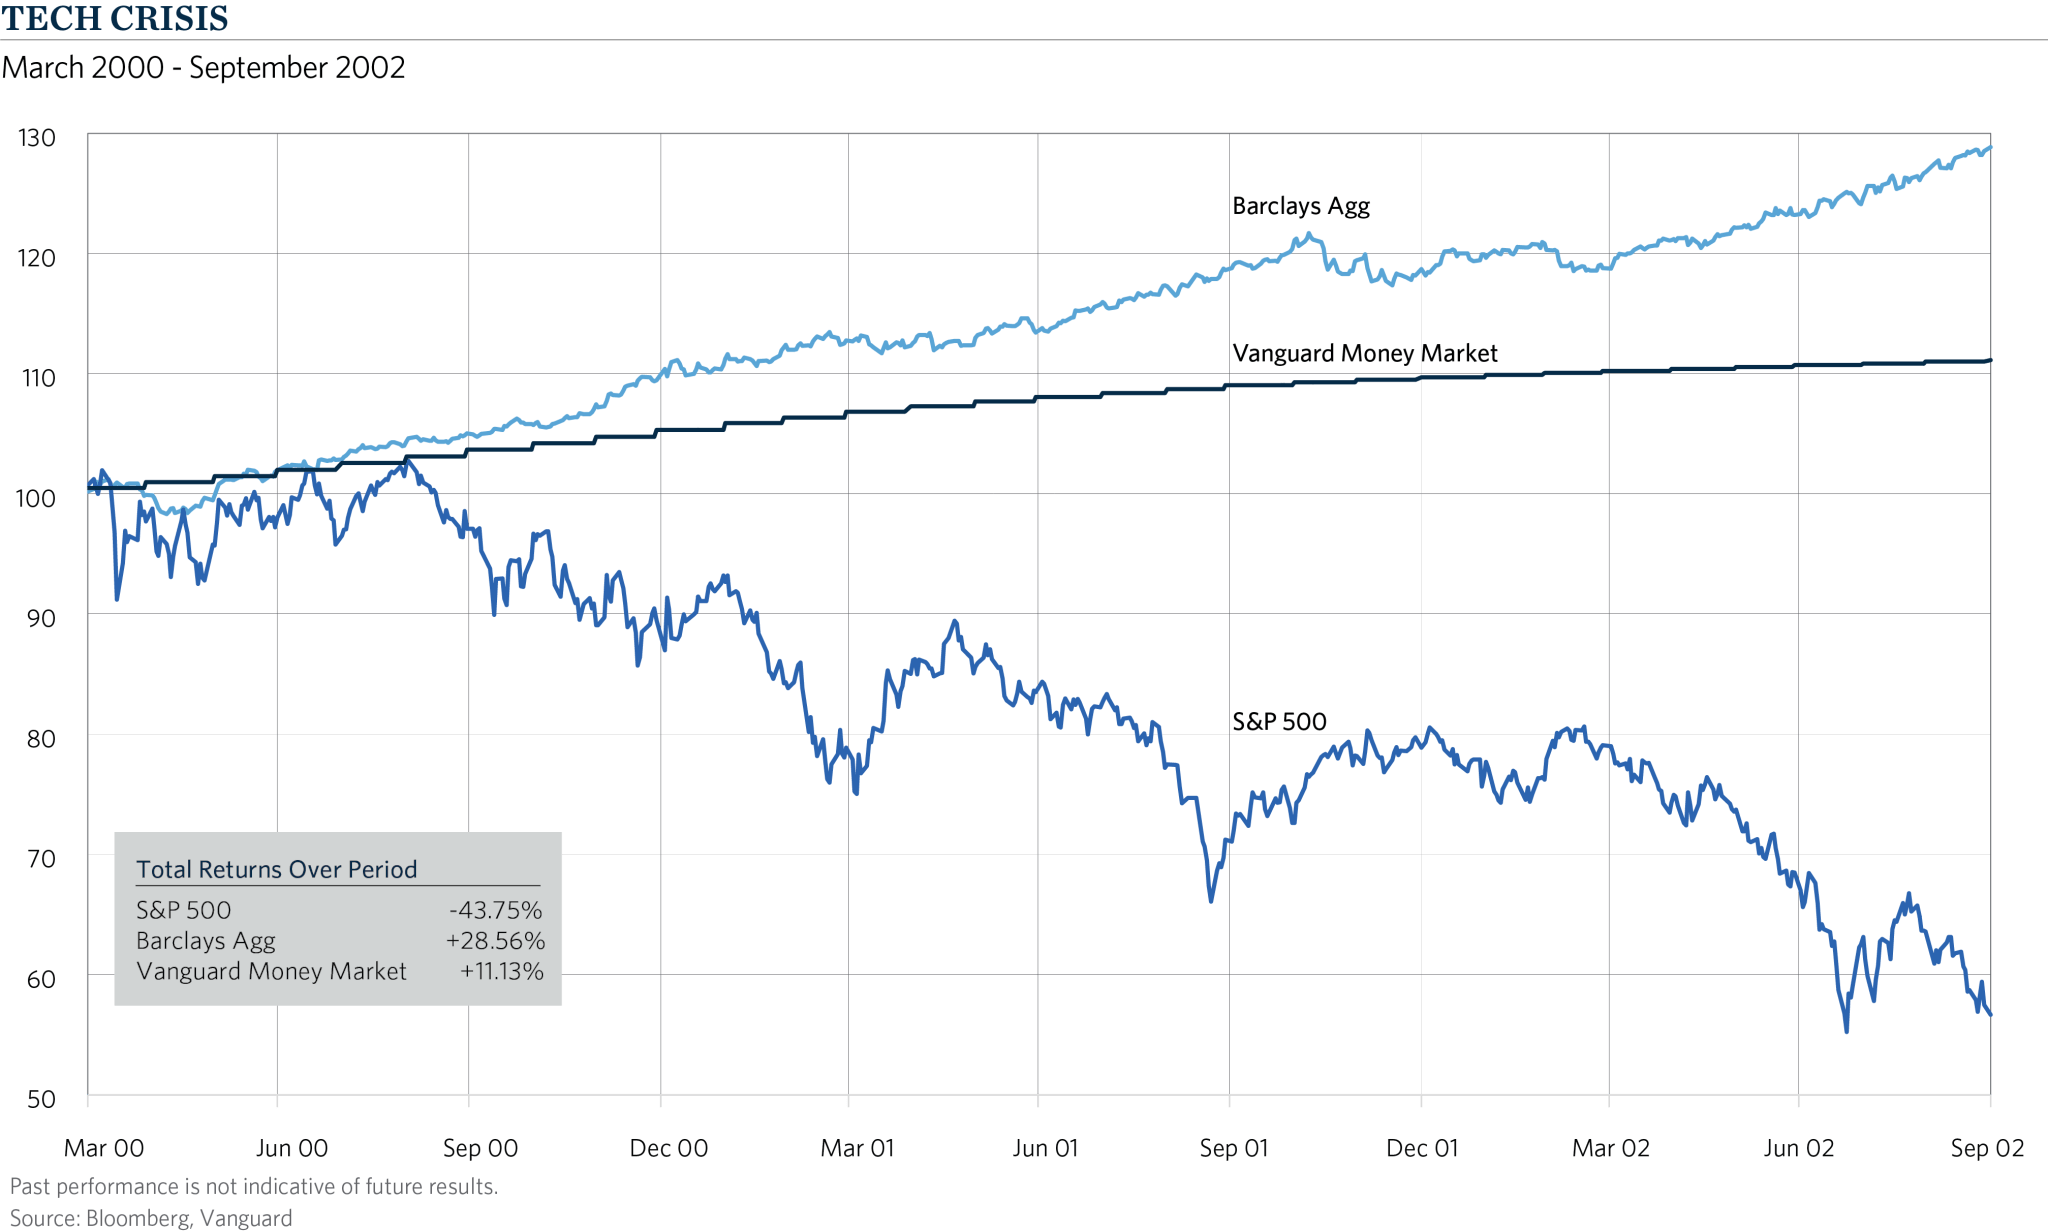
EXHIBIT 2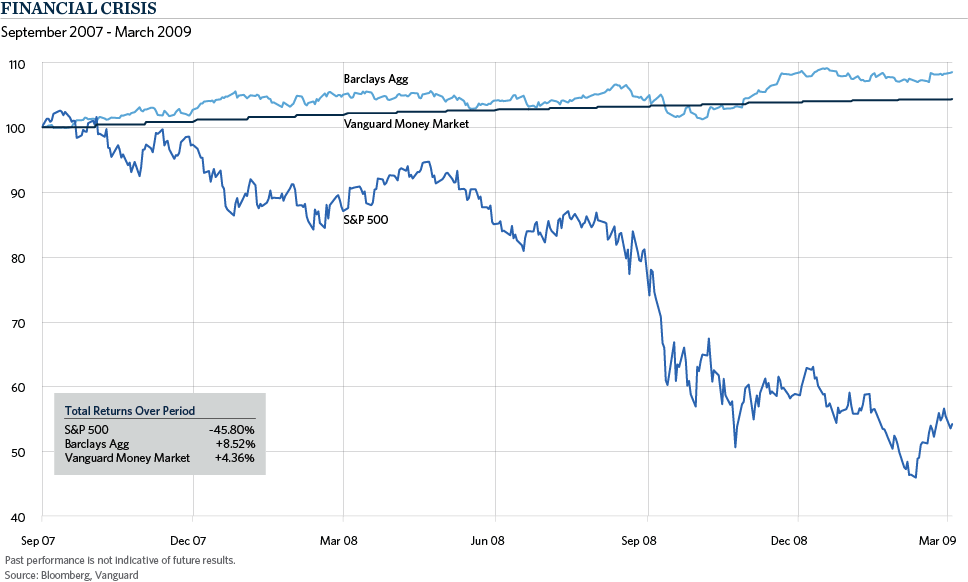 Today, however, there is a good deal of hand wringing over the risk of rising rates. After all, the U.S. Federal Reserve is in the process of normalizing rates, hiking the Fed Funds target from emergency levels around zero at the end of 2015, to the current midpoint target of 1.375 percent as of the last hike on December 19, and possibly hiking as much as 25 basis points per quarter in 2018. At the same time, the Fed has started the process of reducing the size of its balance sheet, starting at a target pace of $10 billion per month in the fourth quarter of 2017, and increasing the pace each quarter by $10 billion per month before peaking at $50 billion per month in the last quarter of 2018. Expectations are that the Fed will continue this process until the balance sheet shrinks by about $2 trillion from the current level of about $4.5 trillion. It should be noted, however, that the balance sheet actually only declined by $7 billion in the fourth quarter, considerably short of the $30 billion targeted reduction.
A Flattening Yield Curve (for now)
Hikes in the Fed Funds target have totaled 125 basis points since December 2015, with four of the five hikes occurring since December 2016. This primarily has impacted the front end of the yield curve. Over the course of 2017, the two year Treasury yield moved up by 70 basis points (from 1.19 percent to 1.88 percent) while the 10 year yield actually fell slightly, from 2.44 percent to 2.41 percent. The long end was held in check by a number of factors, including low rates in Europe and Japan and benign inflation in the United States. However, there is concern that the combination of continued rate hikes and a significant reduction of the Fed’s balance sheet could begin to have a negative impact on the long end.
How concerned should we be about this? While rising long-term rates could be a headwind for core fixed income, as long as rates rise fairly modestly the impact should not be too great. Taking a longer term view, the current yield of the Barclays Agg has historically been a good predictor of the future five year total annualized return, as shown in Exhibit 3. Given that the index today has a yield of 2.75 percent, it’s a reasonable bet that the annualized return over the next five years should be about 2.75 percent.
EXHIBIT 3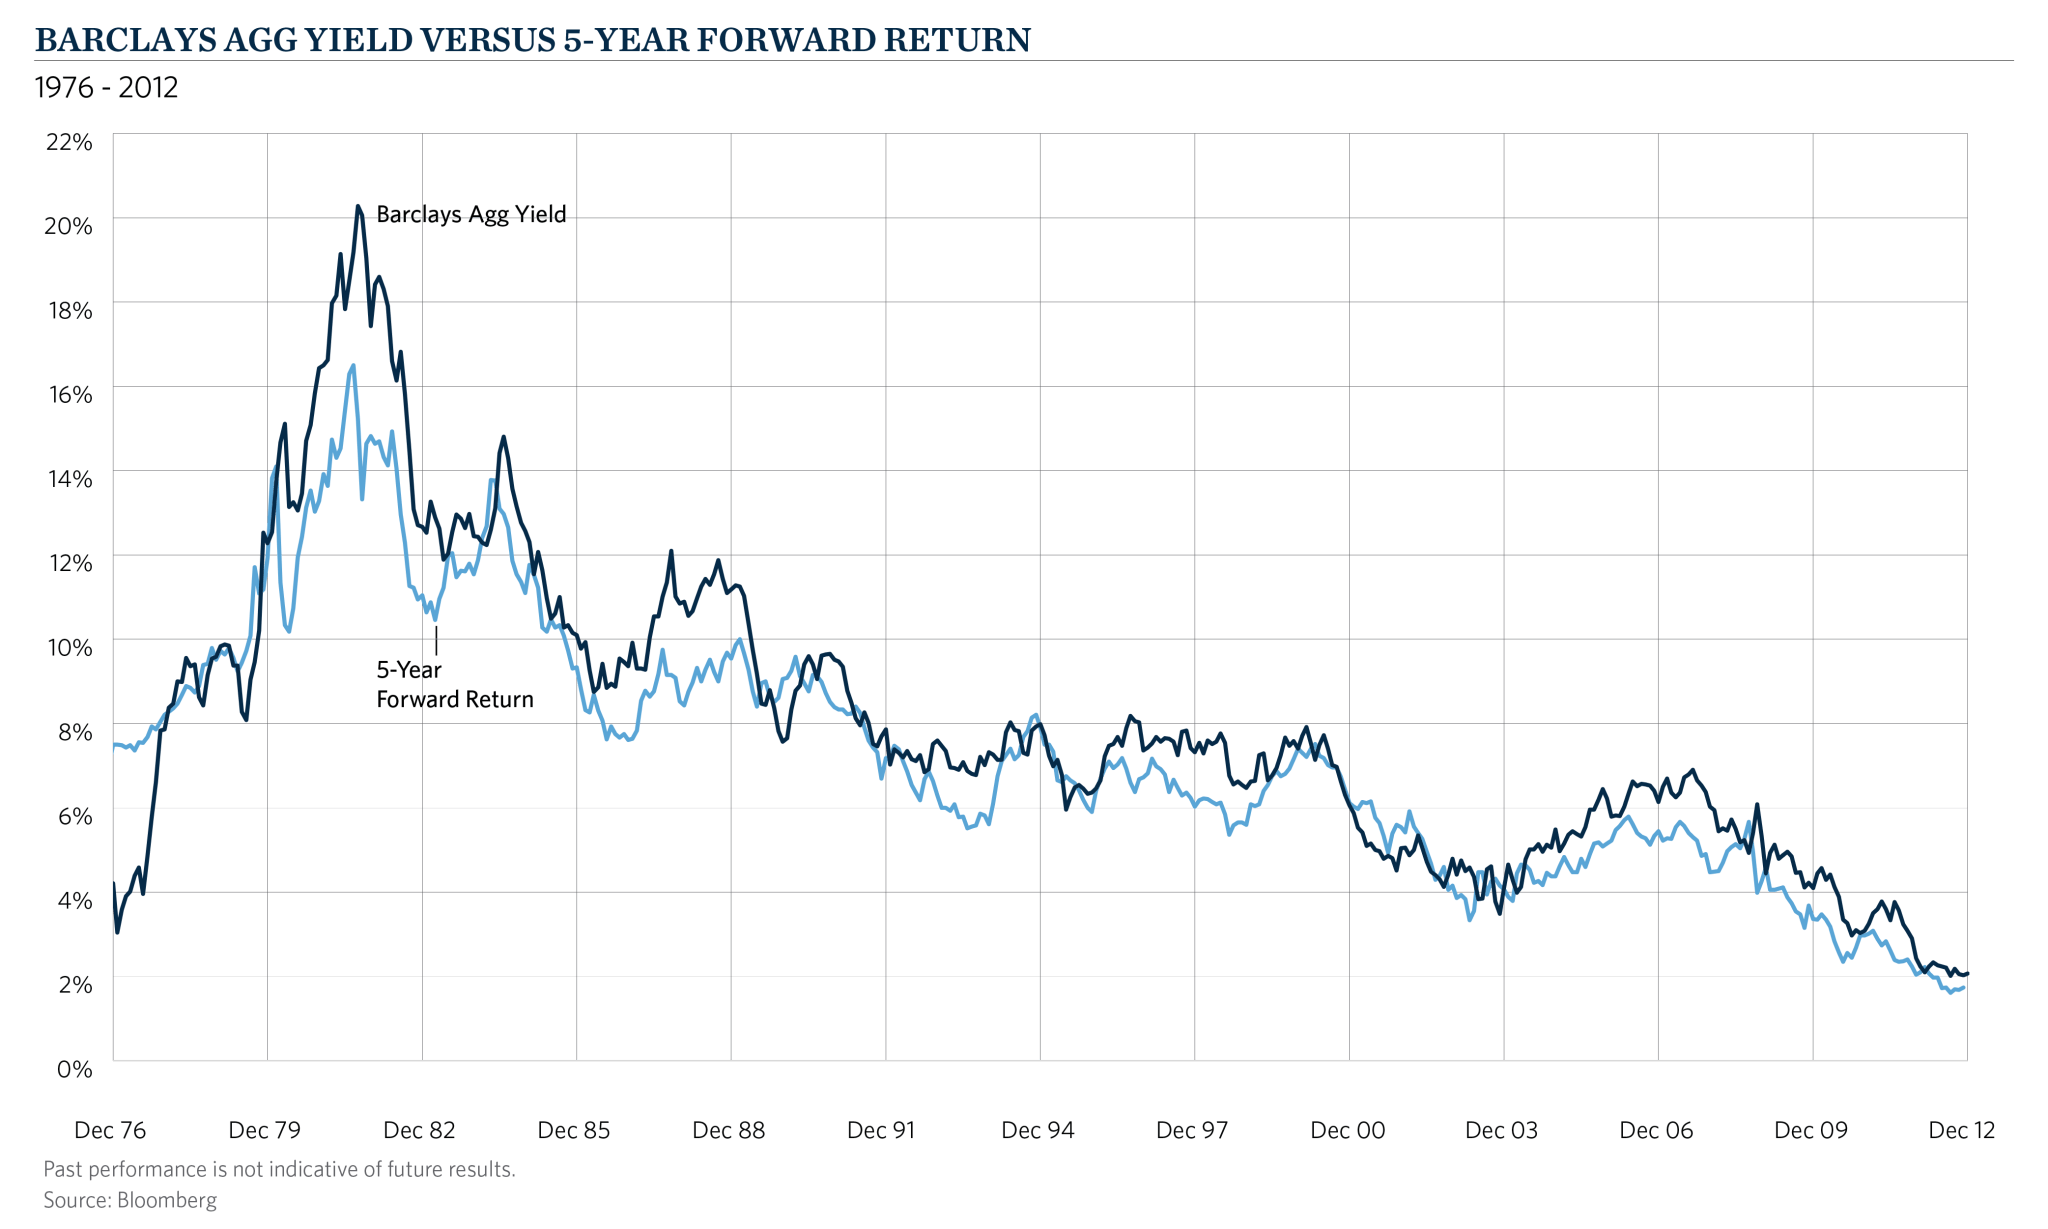
The Impact of a More Aggressive Fed
A fairly negative view for rates in 2018 would be four quarterly hikes in the Fed Funds target of 25 basis points each, and a parallel shift higher in the entire yield curve, taking the benchmark index yield from 2.75 percent to 3.75 percent. The approximate six year duration of the index would lead to a principal loss of about six percent, offset by income of about 3.25 percent, for a negative total return of 2.75 percent. However, keep in mind that about 75 percent of active core fixed income managers typically outperform the index.
This scenario would take the Fed Funds midpoint target to 2.375 percent by the end of 2018, higher than the current pace of inflation (roughly two percent) but perhaps about the same as the future pace of inflation should the economy remain strong. A Fed Funds target which is at or slightly above the perceived level of inflation is considered to be a neutral monetary policy and it seems reasonable the Fed could temper or maybe even end the hiking of interest rates at that point, assuming that inflation remains subdued and the economy does not overheat.
Exhibit 4 shows the returns that are associated with this scenario. The Barclays Agg suffers in the first year while rates are rising, but gradually recovers its losses over the next four years, achieving a 2.44 percent annualized return over the five year period. That’s not too far off the initial yield of 2.75 percent, consistent with the historical relationship shown in Exhibit 3. The money market fund yield is assumed to be 1.25 percent in Q1-18, rising to 2.25 percent in Q1-19, then remaining steady for the next four years, with a constant par value.
EXHIBIT 4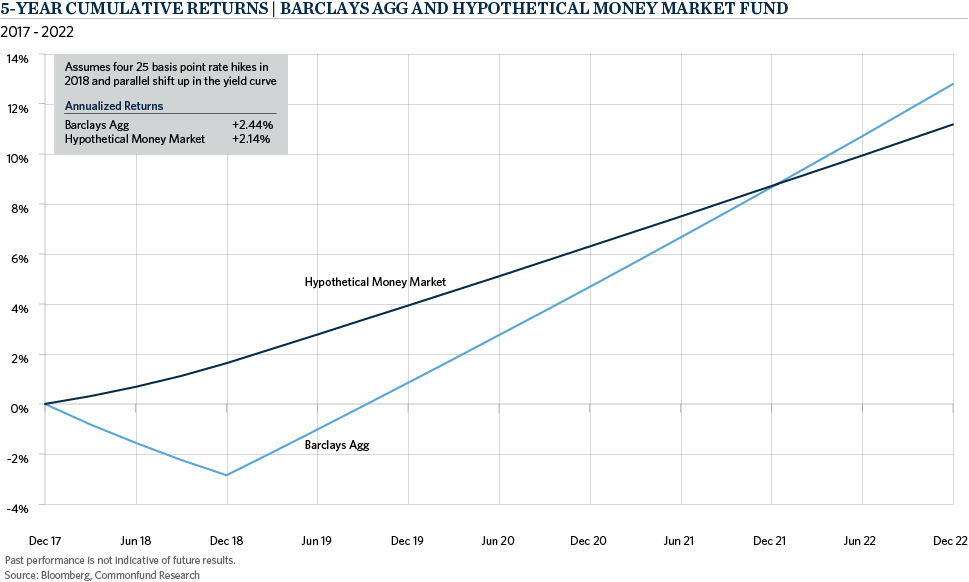
While this scenario for rates may be fairly aggressive in the first year, it assumes that rates remain steady in the following four years. If inflation remains subdued, the 3.75 percent yield assumed for the Barclays Agg (or about 3.5 percent for the 10 year Treasury note) by the end of 2018 would look quite attractive to many market participants. Keep in mind that the Fed has signaled only three hikes for 2018 and the long end was very well anchored in 2017, so the actual outcome could be better than this scenario suggests.
Considerations for Policy Allocations
With the recent strength of equity markets, modest return expectations for core bonds and the prospect of higher interest rates, it is perhaps not surprising that fixed income allocations get little attention in investment committee discussions. But while bonds may not be loved, they should not be forgotten. In our view, the most likely interest rate scenarios support a modest underweight to core fixed income in policy portfolios. This recognizes the risk of rising rates in the near term but also the long term benefit to the overall portfolio due to the favorable correlation properties of fixed income during stress periods in the market and the need for an anchor in the portfolio during turbulent times.