As we progress through calendar year 2017, we have witnessed the continuation of the equity bull market started in 2009. One difference however, is that leadership has turned (finally!) to non-U.S equity markets.
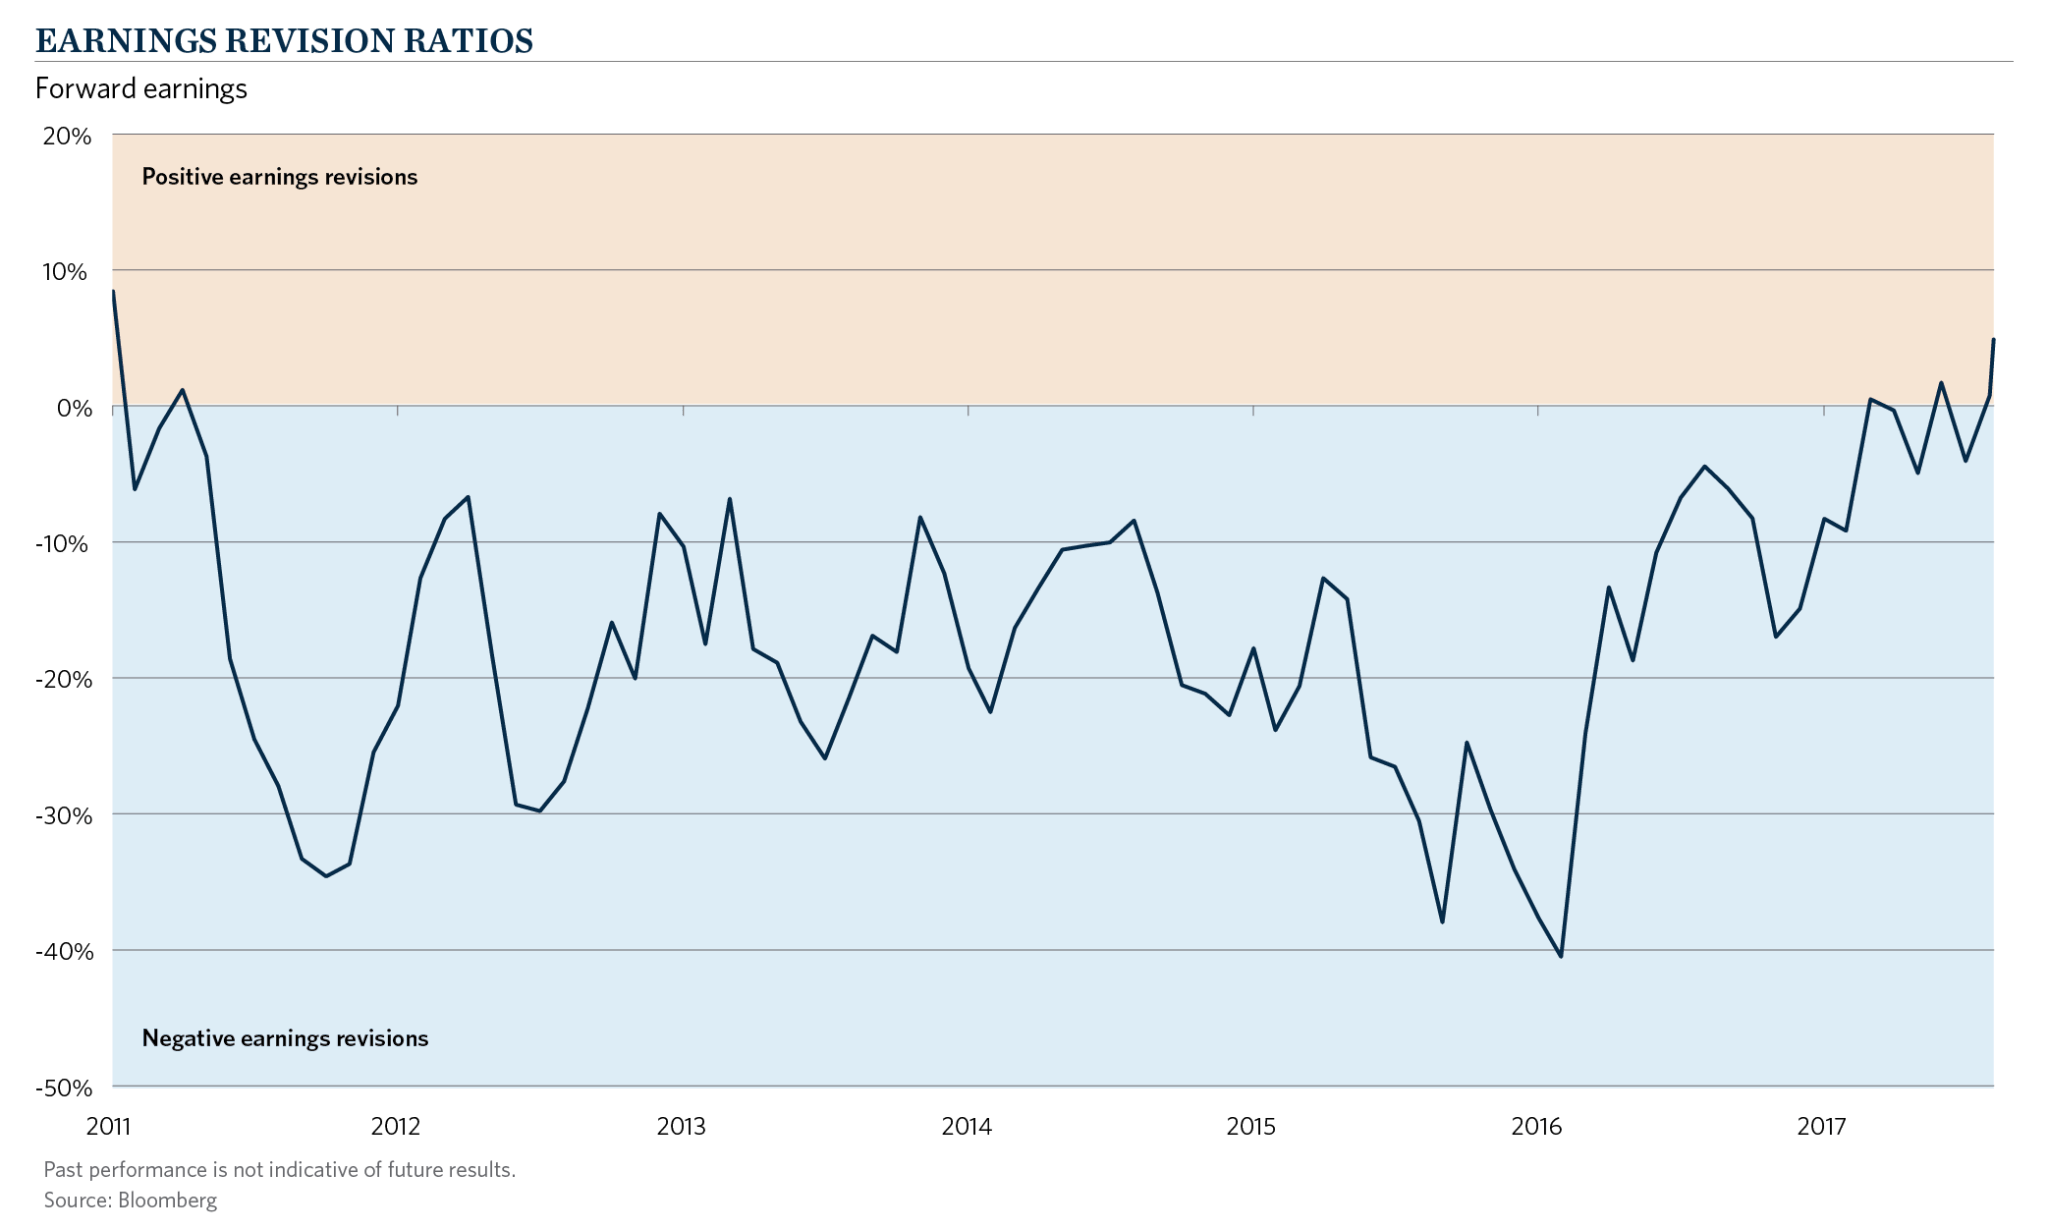
On a year–to-date basis, the MSCI ACWI ex U.S. Index has returned 21.13 percent through September, ahead of the S&P 500 Index by nearly 700 basis points. Within the Non-U.S. markets, emerging markets have been the stalwart performer, advancing over 30 percent. After many years of favorable valuations, investors in EM are finally being rewarded. Why is it now that patience is being rewarded? After all, many of the world’s geopolitical problems (North Korea nuclear threat, Brazilian political corruption, Turkish religious and political movements, etc.) emanate from these markets. To put it simply, earnings are finally coming through, driving share prices higher in the emerging world. As the chart below depicts, it has been over 6 years since estimate revisions have been positive. Said differently, earnings estimates have been revised downward for six straight years, until 2017. When earnings growth is persistently overvalued, it is hard for shares to rise, no matter how attractive valuation is. The story today is different, as the earnings backdrop has improved, or at the very least stabilized, allowing competitive global relative valuations to be viewed with more optimism.
 Investors have historically held emerging market allocations because of the favorable GDP growth these developing countries experienced. This growth largely came through during the 2003-2007 time frame, when emerging markets also lead equity markets higher. Positive impacts from globalization and urbanization carried through to emerging markets growth, benefiting industrial and infrastructure dependent companies in the emerging world. Many of the beneficiaries of strong GDP growth were state–owned enterprises (SOE’s) in countries such as China, Russia and Brazil, and the make-up and characteristics of the emerging markets index reflected this. As table 1 below indicates, at the beginning of 2003 nearly 27 percent of the EM Index was made up of materials and energy stocks, with the largest of these holdings representing state-owned interests in Brazil, South Korea, and Russia. Banks also represented a large segment of the index back then at nearly 17 percent, with large weightings from China and Brazil, particularly in SOE’s. The 2003-2007 period was strong for EM equities, with 5-year annualized returns at the end of 2007 of over 37 percent. At the end of this run, infrastructure related sectors (energy, materials) grew to over 33 percent of the index, while financials grew to over 20 percent. Remember, many of the largest companies in these sectors were SOE’s, and these three sectors represented over 50 percent of the index at the time.

At their peak, public emerging markets equities, as defined by the EM Index had characteristics of a deep cyclical stock. Commodity prices (materials and energy) and interest rates (financials) played a large role in determining year-to-year returns of this index, given the sector make-up. In retrospect, public EM equities were never a great proxy for capitalizing on the emergence or growth of a middle class in many of these economies. Admittedly, the private markets during this time have been better positioned to access the consumption growth that was so attractive in this asset class.
Fast forward nearly 10 years, and the emerging market index has changed substantially, a reflection of the latest market leadership. Today, as the table above depicts, those large weightings to materials and energy (33 percent in 2007) are much lower (14 percent today), consistent with underperformance in these two sectors over the past five years. Conversely, technology is by far the largest weighting in the index at almost 28 percent, a reflection of continued outperformance of the sector along with the listings of very large technology companies in the past few years, such as Tencent, Baidu and Alibaba. Technology, financials (banks) and consumer discretionary comprise over 60 percent of the index today and represent areas of the market that are directly related to the emergence of a middle class in the developing world, which is more consistent with the opportunity that attracted investors in the first place. The index today is now a better proxy for the attractive elements investors want to capture in the emerging markets. At Commonfund we advocate for policy portfolios that maintain broad global allocations across public and private equities to give investors an opportunity to capture these shifts in leadership without trying to time them, which we believe is exceedingly difficult to do well.