Despite 12.2 percent return for FY2017, educational endowments report a decline in their 10-Year return while large institutions lead increase in effective spending rate
Data gathered from 809 U.S. colleges and universities for the 2017 NACUBO-Commonfund Study of Endowments® (NCSE) show that participating institutions’ endowments returned an average of 12.2 percent (net of fees) for the 2017 fiscal year (July 1, 2016 – June 30, 2017) compared with -1.9 percent for the 2016 fiscal year and 2.4 percent for fiscal 2015. Despite this year’s improved return, the mission-critical 10-year average annual return fell to 4.6 percent from last year’s 5.0 percent, as FY2007’s strong 17.2 percent return dropped out of the trailing 10-year average.
Institutions participating in the Study reported increasing their average effective spending rate to 4.4 percent in FY2017 from 4.3 percent a year ago; the increase was led by institutions with endowment assets over $1 billion, which raised their effective spending rate to 4.8 percent from last year’s 4.4 percent. Among all institutions increasing their dollar spending, the median increase was 6.5 percent, well above the inflation rate.
“Continued substantial increases in endowment spending dollars, despite lower long-term investment returns, demonstrate the deep commitment colleges and universities have to student access and success,” said NACUBO President and Chief Executive Officer John D. Walda. “However, continued long-term growth of 5 percent or less, along with the coming changes to tax and charitable giving laws under the recently passed Tax Cuts and Jobs Act, will make it much more difficult for colleges and universities to increase endowment dollars to support their missions. Despite this year’s higher returns, we remain concerned about the continued long-term results for most endowments.”
Catherine M. Keating, President and Chief Executive Officer of Commonfund, underscored these comments by noting that “the goal of achieving real returns to cover spending has been a daunting task for higher education for more than a decade—and we don’t expect the challenge to get any easier. At the same time, with tuition discount rates at historic highs and inflation, as measured by the Commonfund Higher Education Price Index, at its highest level since 2008, the importance of endowments in the ecosystem of colleges and universities has never been greater. This year’s reported increased spending levels stand out as one example of that.”
The 809 institutions in this year’s Study represented $566.8 billion in endowment assets. While the size of the median endowment was approximately $127.8 million, 44 percent of Study participants had endowments that were $100 million or less.
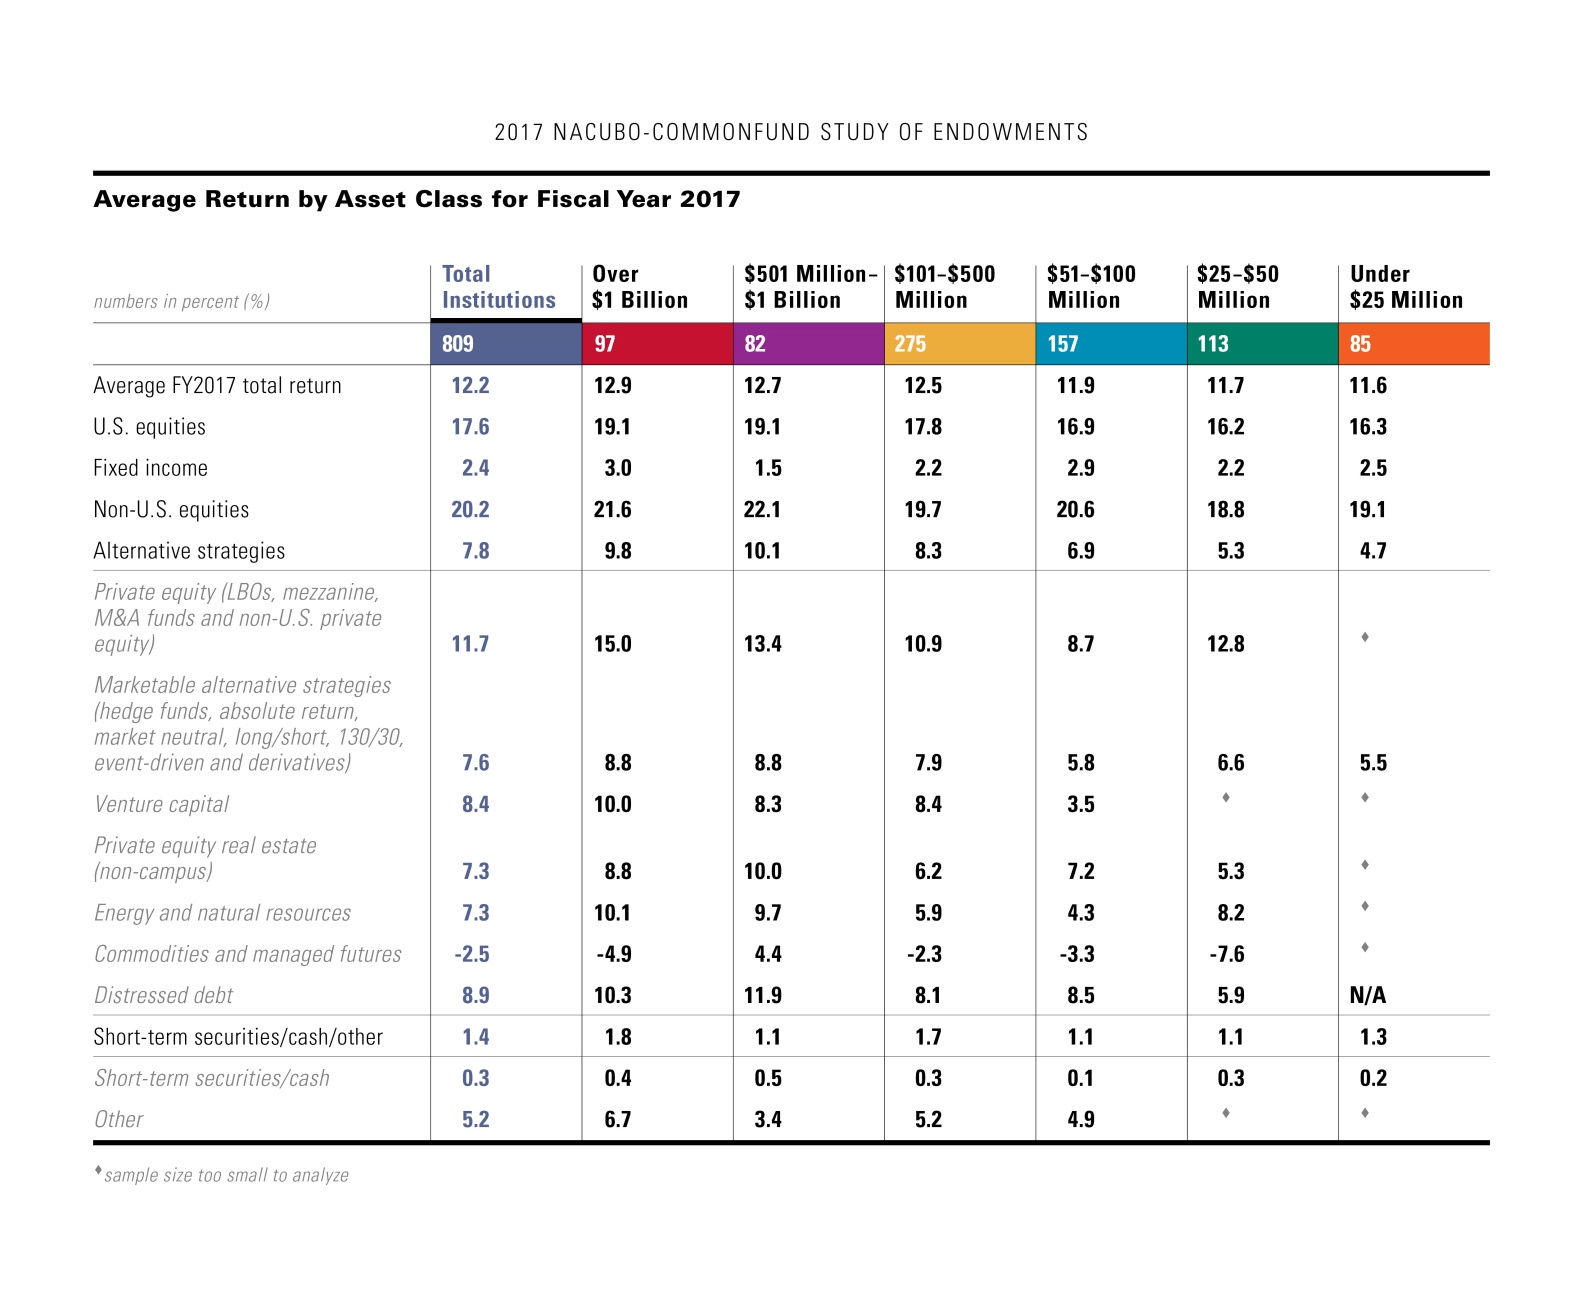
FY2017 Returns by Asset Class
Of the five primary investment categories tracked in the Study, only fixed income produced a return that was lower in FY2017 compared with FY2016. In this instance, the return declined to an average of 2.4 percent from the prior year’s 3.6 percent. Non-U.S. equities, which produced last year’s lowest return, an average of -7.8 percent, generated this year’s highest return, at 20.2 percent. U.S. equities followed, returning 17.6 percent, a substantial increase from last year’s -0.2 percent return. Alternative strategies turned in a 7.8 percent return versus -1.4 percent in FY2016, while short-term securities/cash/other returned 1.4 percent compared with last year’s 0.2 percent.
Examining reported FY2017 returns for the various alternative investment strategies, private equity (LBOs, mezzanine, M&A funds and non-U.S. private equity) provided the highest return, at 11.7 percent. Distressed debt and venture capital followed, generating returns of 8.9 percent and 8.4 percent, respectively. Three strategies produced returns in the 7 percent range: marketable alternative strategies (hedge funds, absolute return, market neutral, long/short, 130/30, event-driven and derivatives) returned 7.6 percent, while private equity real estate (non-campus) and energy and natural resources both returned 7.3 percent. Commodities and managed futures produced the only negative return for FY2017, at -2.5 percent. Each strategy produced a better return in FY2017 compared with the year-ago period.
Study data are broken down into six endowment size categories, ranging from institutions with total endowment assets under $25 million to those with assets in excess of $1 billion. Average FY2017 returns were positive for institutions in all six categories, reversing last year’s results, when returns were negative for all six. From high to low this year, the spread of returns across the size cohorts was a tight 130 basis points (1.3 percentage points).
The annual NCSE analyzes return data and a broad range of related information gathered from U.S. colleges and universities, both public and private, as well as their supporting foundations. The size and scope of the Study make it the most comprehensive annual report on the investment management and governance practices and policies of institutions of higher education across the U.S.
Longer-Term Returns
While one-year returns are important, many endowment managers use 10-year average annual returns as a target for long-range planning purposes. For FY2017, trailing 10-year returns declined to an average of 4.6 percent from FY2016’s 5.0 percent. The highest average 10-year return came from institutions in the largest and smallest size categories, at 5.0 percent each. That represented no year-over-year change for the smallest endowments, but an annualized 70-basis-point decline—from 5.7 percent—for the largest.
Trailing five-year returns showed a markedly different pattern, as they rose to an average of 7.9 percent this year versus 5.4 percent a year ago. Average returns for the period were helped when FY2012’s -0.3 percent return dropped out of the calculation. Trailing five-year returns increased across all six size cohorts.
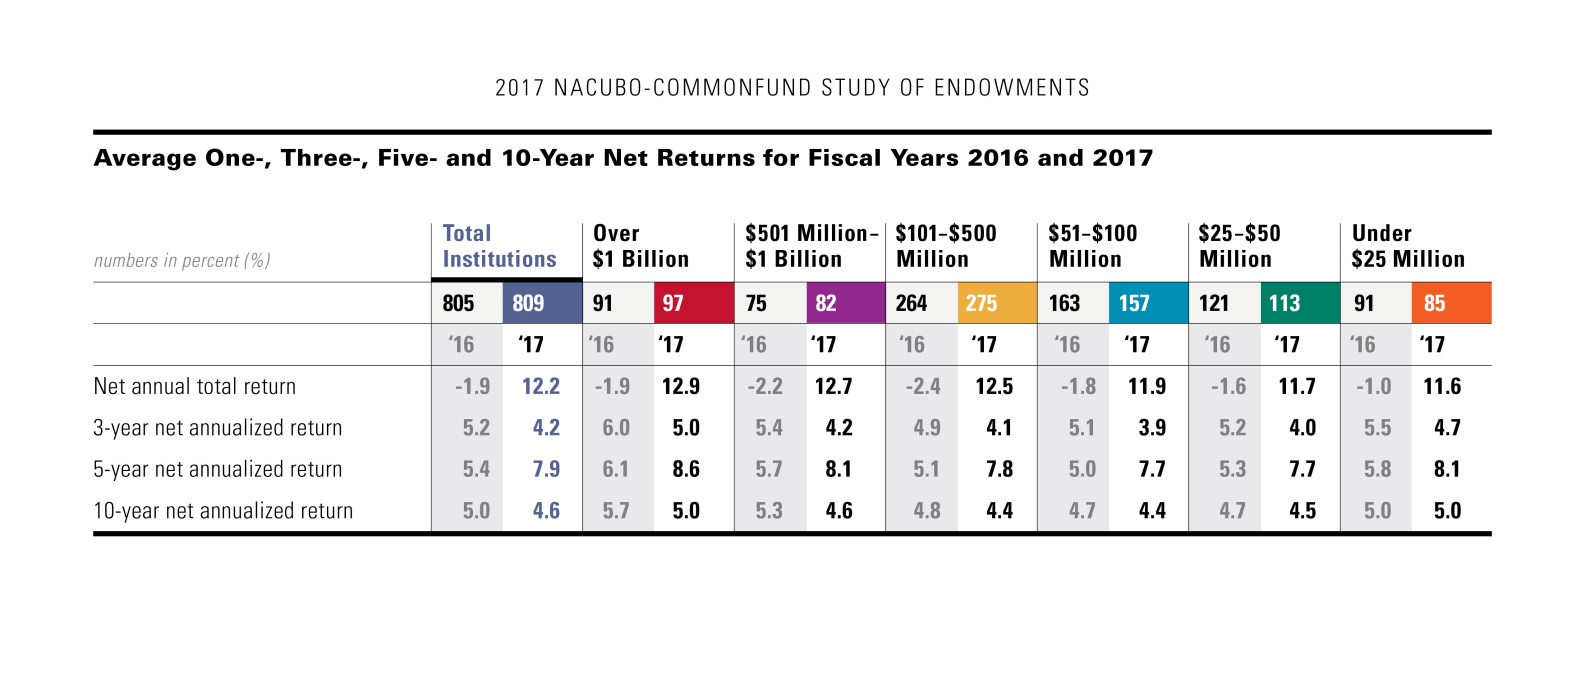
Weighed down by a return of 2.4 percent in FY2015 and -1.9 percent in FY2016, trailing three-year returns fell to an average of 4.2 percent this year from last year’s average of 5.2 percent. Returns for the period were lower across all six size categories.
Asset Allocation
Asset allocation among participating endowments changed very little over the course of the fiscal year. Participating endowments reported the following asset allocation in FY2017:
Dollar-Weighted Asset Allocations for Fiscal Years 2016 and 2017 |
||
|---|---|---|
|
Asset Class |
Fiscal Year |
|
|
2017 |
2016 |
|
|
U.S. equities |
16% |
16% |
|
Fixed income |
8% |
8% |
|
Non-U.S. equities |
20% |
19% |
|
Alternative strategies |
52% |
53% |
|
Short-term securities/cash/other |
4% |
4% |
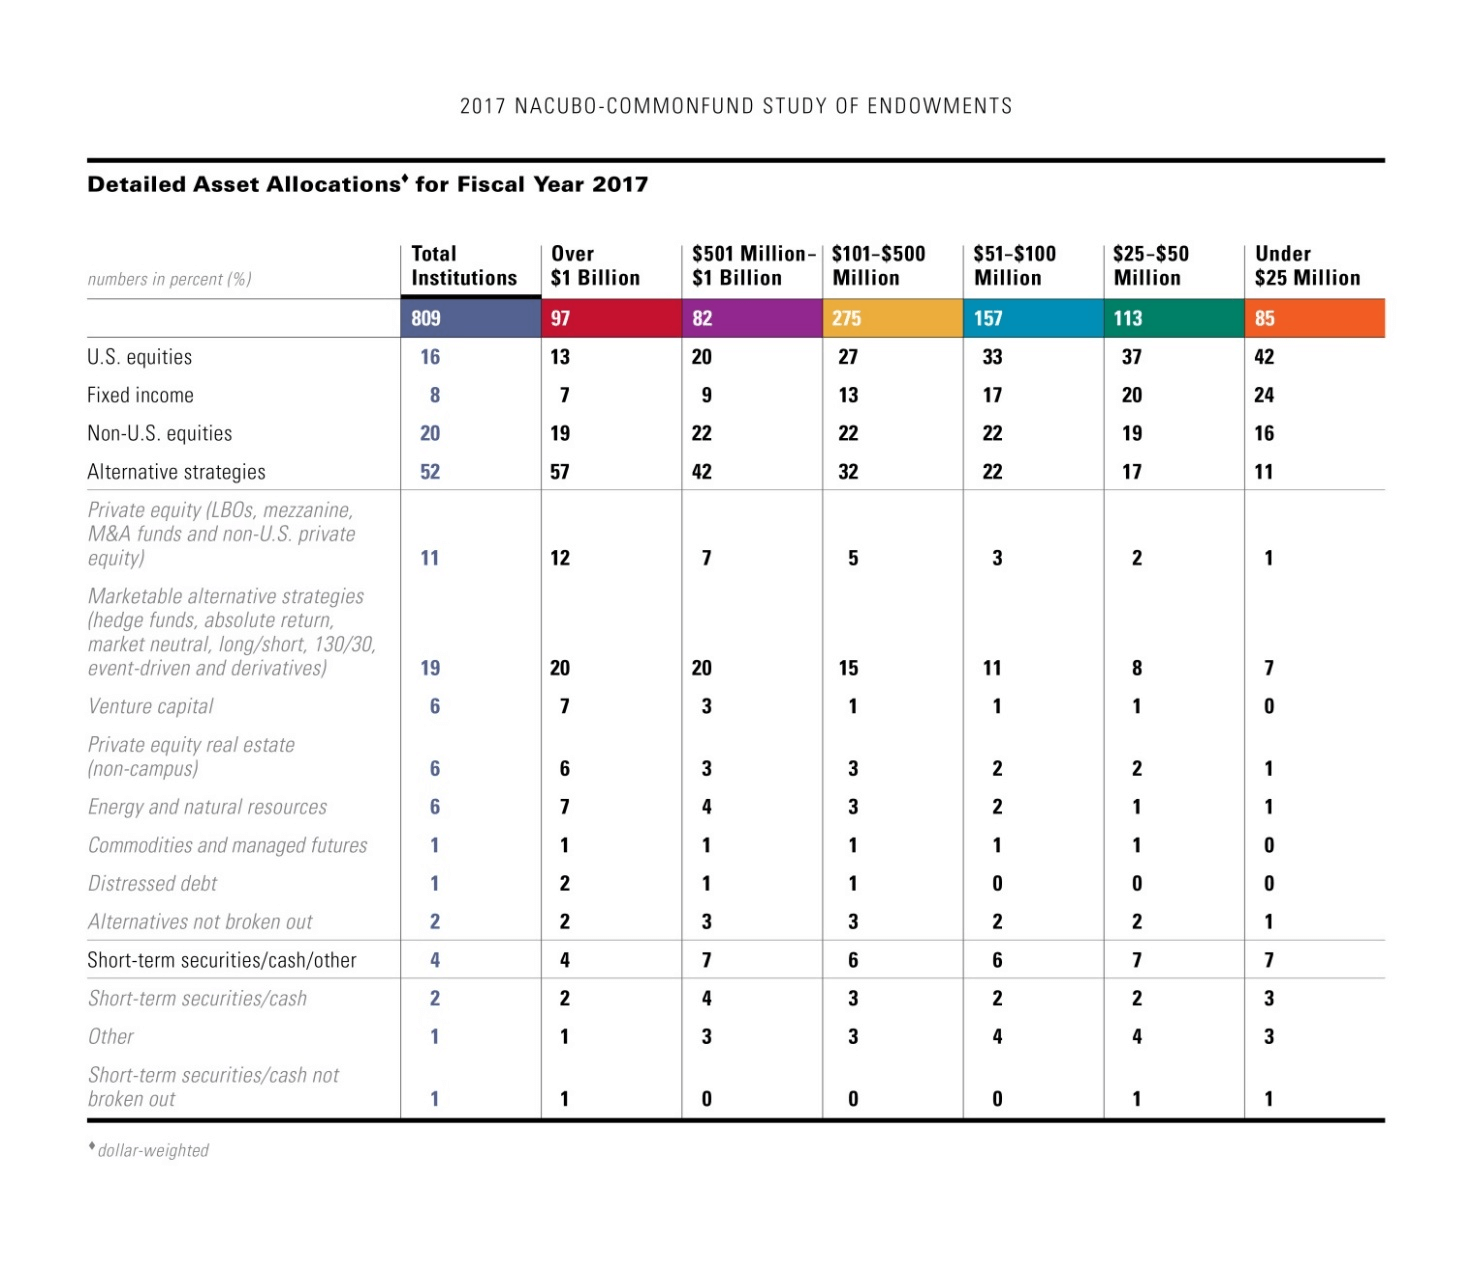
When asset allocation is viewed by size of institutions, larger endowments continue to significantly overweight alternative strategies, while smaller endowments have larger allocations to traditional asset classes, such as U.S. equities and fixed income. Among alternative strategies allocations, the largest single allocation was to marketable alternatives, thus continuing a long-running finding of the Study.
Spending Rates
The FY2017 effective spending rate for the 809 participating institutions averaged 4.4 percent, up slightly from 4.3 percent last year and 4.2 percent the year before that. As was true last year, the highest effective spending rate, at 4.8 percent, was reported by institutions with assets over $1 billion. This represented an increase from last year’s 4.4 percent.
Sixty-five percent of participants reported increasing their endowment spending in dollar terms, the median increase being 6.5 percent. Seventy-one percent or more of institutions in the three largest size categories reported increasing endowment spending in dollars; 54 to 57 percent of endowments in the three smaller size classifications reported spending more in dollars.
Debt
Of the 809 Study participants, 584 said they held long-term debt. Among these 584 institutions, the average total debt stood at $208.1 million as of June 30, 2017, compared with $230.2 million a year earlier. The decline was driven by a sharp reduction in debt level at institutions with assets over $1 billion.
NCSE Leaders
NCSE Leaders comprise the top decile and top quartile of the Study universe measured by investment return for FY2017. Compared with the Study universe return of 12.2 percent, the top decile reported an average return (net of fees) of 15.8 percent and the top quartile reported an average net return of 14.8 percent.
One major departure this year from Studies over many previous years was a shift in asset allocation among top decile performers. Specifically, top decile performers (largely reflecting higher allocations to the best performing asset classes, non-U.S. equities and U.S. equities) reported an allocation to alternative strategies averaging just 39 percent compared to 52 percent for the Study universe. Last year, the allocation to alternatives among the top decile was 62 percent.
