Baring Their Teeth – FAANGs Take a Bite Out of the Equity Market

March 2, 2018 |
2 minute read
|

Narrow market leadership in the U.S. and Emerging Markets proves challenging for active managers

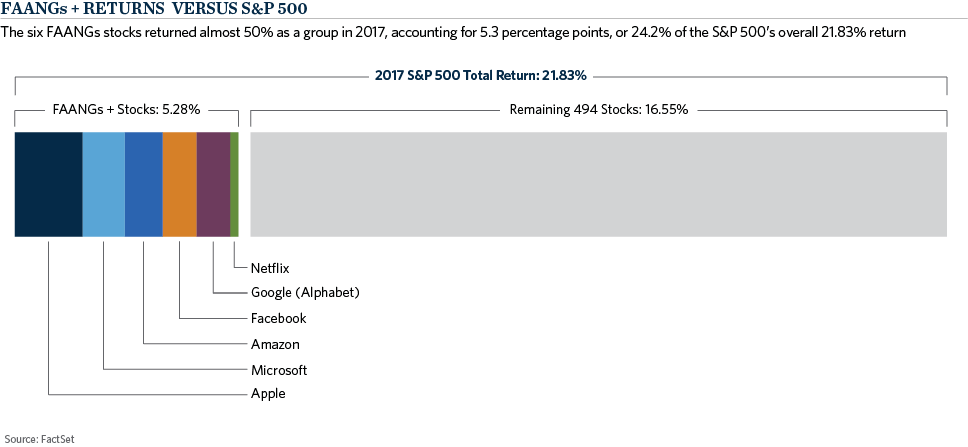
Narrow markets are not uncommon to equity investors. They tend to manifest themselves during the best of times, as bull markets lengthen, and thematic elements of investing gain popularity. Prior narrow market environments existed in the late 1990’s (we all remember the tech bubble!) and also in 2007, prior to the Great Financial Crisis. The most recent narrow market has been dominated by the headlines of FAANG’s – Facebook, Amazon, Apple, Netflix and Google. These five business models are disrupting all sorts of industries, and with it, their stock prices have soared. Collectively, as a group, the average return for the Fab Five was nearly 50 percent for 2017, compared to the S&P 500 Index return of 21.8 percent. The FAANG’s now account for over 10 percent of the S&P 500 Index and accounted for 4.3 percentage points of the 21 percent return in 2017. When Microsoft, another large technology holding in the S&P, is added in (FAANG’s +), the return contribution goes up to 5.3 percentage points, or a full 24 percent of the return contribution for the full year.

CH1-FAANGSvsSP500

Betting against the FAANG’s + in the S&P was costly in 2017, but given the valuation profiles of these companies, understandable. Valuations for these FAANG + stocks are more than just “stretched” in comparison to the broader market. P/E ratios of 165 times (Amazon), 97 times (Netflix) or high 20’s for Facebook or Google are not easy to swallow. On the other hand, earnings and revenue growth have largely delivered. Amazon and Netflix have both increased sales around 30 percent, while Facebook’s sales growth is even higher, at 45 percent.  Comparisons to the late 90’s tech bubble are probably not relevant, as these companies have sizable earnings and/or cash on the balance sheet to provide more potential upside, but one needs to be comfortable with lofty valuations to buy in at these levels.

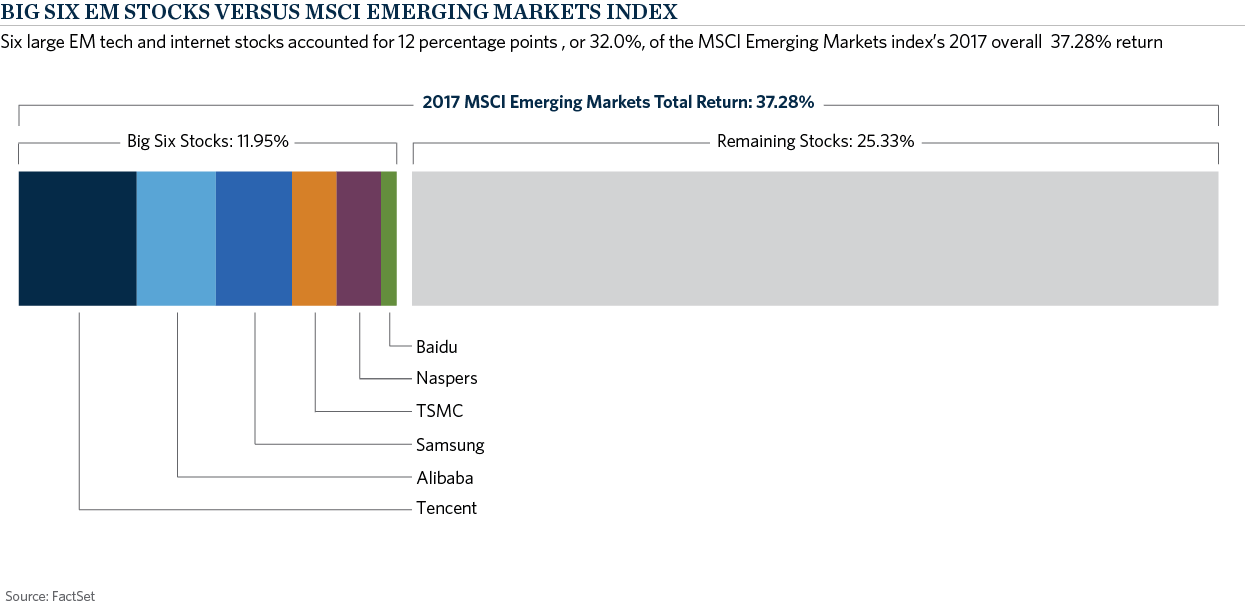
This hasn’t been a U.S. market phenomenon only, however. If we turn our attention to the emerging markets, a similar picture emerges as well. Technology represented over 27 percent of the MSCI Emerging Markets Index at year end, and contributed a full 12 percentage points of the 37 percent total return of the index in 2017. Large internet/technology holdings such as: Tencent (+113 percent); Alibaba (+96 percent); Naspers (+90 percent); Samsung (+61 percent); Baidu (+42 percent) and Taiwan Semiconductor (+40 percent) were the drivers of these outsized returns last year, contributing a third of the total index return.  In combination, these six names now accounted for a full 20 percent of the index at year end (double the 10 percent that FAANGs+ account for in the S&P 500). For context, just five years ago, the entire tech sector represented just 14 percent of the emerging markets index. Similar to some of the FAANG stocks, these internet names have experienced explosive growth in a relatively short period of time.

CH2-EMstocksvsMSCI

Narrow markets are difficult for most active managers, as they are typically characterized by thematic drivers leading over broad-based approaches. Prior narrow markets were accompanied by the “average” active manager underperforming benchmarks. This was the case in 1998/1999, 2007 and in 2017. These periods are typically followed by better active management environments, but despite this, the temptation among some investors is to just throw in the towel and move to passive investing. 

Alternatively, we believe that investors can weather narrow markets by focusing on three guiding principles: risk-aware portfolio construction, inclusion of diversifying sources of active return (risk-premia), and an alignment of interest with managers through performance-based fees.  Risk-aware portfolio construction, focused on weighting decisions driven by underlying manager’s active risk levels, places emphasis on portfolios that will not ignore one segment of the market in order to favor another.  In addition to traditional stock pickers, including strategies that generate excess returns through targeted factor exposures and quantitative approaches that are less susceptible to narrow markets challenges can be beneficial.  Any decrease in flat fees, in favor of performance-based fees above the benchmark, has a direct positive impact on net returns, which is important in a market where every basis point counts. 

Mark J.P. Anson

Author

Mark J.P. Anson

Chief Executive Officer and Chief Investment Officer, Commonfund

Disclaimer

Certain information contained herein has been obtained from or is based on third-party sources and, although believed to be reliable, has not been independently verified. Such information is as of the date indicated, if indicated, may not be complete, is subject to change and has not necessarily been updated. No representation or warranty, express or implied, is or will be given by The Common Fund for Nonprofit Organizations, any of its affiliates or any of its or their affiliates, trustees, directors, officers, employees or advisers (collectively referred to herein as “Commonfund”) or any other person as to the accuracy or completeness of the information in any third-party materials. Accordingly, Commonfund shall not be liable for any direct, indirect or consequential loss or damage suffered by any person as a result of relying on any statement in, or omission from, such third-party materials, and any such liability is expressly disclaimed.

All rights to the trademarks, copyrights, logos and other intellectual property listed herein belong to their respective owners and the use of such logos hereof does not imply an affiliation with, or endorsement by, the owners of such trademarks, copyrights, logos and other intellectual property.

To the extent views presented forecast market activity, they may be based on many factors in addition to those explicitly stated herein. Forecasts of experts inevitably differ. Views attributed to third-parties are presented to demonstrate the existence of points of view, not as a basis for recommendations or as investment advice. Market and investment views of third-parties presented herein do not necessarily reflect the views of Commonfund, any manager retained by Commonfund to manage any investments for Commonfund (each, a “Manager”) or any fund managed by any Commonfund entity (each, a “Fund”). Accordingly, the views presented herein may not be relied upon as an indication of trading intent on behalf of Commonfund, any Manager or any Fund.

Statements concerning Commonfund’s views of possible future outcomes in any investment asset class or market, or of possible future economic developments, are not intended, and should not be construed, as forecasts or predictions of the future investment performance of any Fund. Such statements are also not intended as recommendations by any Commonfund entity or any Commonfund employee to the recipient of the presentation. It is Commonfund’s policy that investment recommendations to its clients must be based on the investment objectives and risk tolerances of each individual client. All market outlook and similar statements are based upon information reasonably available as of the date of this presentation (unless an earlier date is stated with regard to particular information), and reasonably believed to be accurate by Commonfund. Commonfund disclaims any responsibility to provide the recipient of this presentation with updated or corrected information or statements. Past performance is not indicative of future results. For more information please refer to Important Disclosures.

Stay connected with the Insights Blog

Popular Blog Posts


Market Commentary | Insights Blog

Chart of the Month | U.S. Budget Deficit Hits Record Highs

In his first 100 days as President of the United States, Joe Biden has introduced three domestic funding proposals, totaling close to $6.0 Trillion, reflecting a desire to enhance the role of the...
Perspectives | Insights Blog

The Case for Using the Higher Education Price Index® (HEPI) to Define Inflation for Colleges

When calculating return targets for an endowment portfolio, a conventional piece of the equation is often the Consumer Price Index (CPI). CPI plus 5% is the common short-hand formula for institutions...
Market Commentary | Insights Blog

Chart of the Month | The Surprising Relationship Between Money Supply and Inflation

The potential for rising inflation is becoming a top concern for many investors and consumers. Many believe that inflation is already here as evidenced by price increases in commodities, homes,...

Disclaimer

Certain information contained herein has been obtained from or is based on third-party sources and, although believed to be reliable, has not been independently verified. Such information is as of the date indicated, if indicated, may not be complete, is subject to change and has not necessarily been updated. No representation or warranty, express or implied, is or will be given by The Common Fund for Nonprofit Organizations, any of its affiliates or any of its or their affiliates, trustees, directors, officers, employees or advisers (collectively referred to herein as “Commonfund”) or any other person as to the accuracy or completeness of the information in any third-party materials. Accordingly, Commonfund shall not be liable for any direct, indirect or consequential loss or damage suffered by any person as a result of relying on any statement in, or omission from, such third-party materials, and any such liability is expressly disclaimed.

All rights to the trademarks, copyrights, logos and other intellectual property listed herein belong to their respective owners and the use of such logos hereof does not imply an affiliation with, or endorsement by, the owners of such trademarks, copyrights, logos and other intellectual property.

To the extent views presented forecast market activity, they may be based on many factors in addition to those explicitly stated herein. Forecasts of experts inevitably differ. Views attributed to third-parties are presented to demonstrate the existence of points of view, not as a basis for recommendations or as investment advice. Market and investment views of third-parties presented herein do not necessarily reflect the views of Commonfund, any manager retained by Commonfund to manage any investments for Commonfund (each, a “Manager”) or any fund managed by any Commonfund entity (each, a “Fund”). Accordingly, the views presented herein may not be relied upon as an indication of trading intent on behalf of Commonfund, any Manager or any Fund.

Statements concerning Commonfund’s views of possible future outcomes in any investment asset class or market, or of possible future economic developments, are not intended, and should not be construed, as forecasts or predictions of the future investment performance of any Fund. Such statements are also not intended as recommendations by any Commonfund entity or any Commonfund employee to the recipient of the presentation. It is Commonfund’s policy that investment recommendations to its clients must be based on the investment objectives and risk tolerances of each individual client. All market outlook and similar statements are based upon information reasonably available as of the date of this presentation (unless an earlier date is stated with regard to particular information), and reasonably believed to be accurate by Commonfund. Commonfund disclaims any responsibility to provide the recipient of this presentation with updated or corrected information or statements. Past performance is not indicative of future results. For more information please refer to Important Disclosures.