If one ever questioned whether LP-led secondaries were core to the secondaries market, one would only need to consider two factors: (1) the number of funds raised in a given year and (2) investors need for liquidity to manage their portfolios. Over the last few years, GP-led secondary transactions have seen significant growth, sometimes outpacing LP-led deals, as General Partners have increasingly looked to provide their investors with liquidity options and the opportunity to hold on to attractive assets for longer.1
While the GP-led market is a great complement to the LP-led secondaries market, it’s not a replacement for it. Investors have unique portfolios and needs across the large number of funds invested. There were over 30,500 funds raised between 2009-20192, of which only a portion can be liquidated through GP-led transactions. This is especially true today since the secondary market is both under-resourced and under-capitalized.
Market Volume
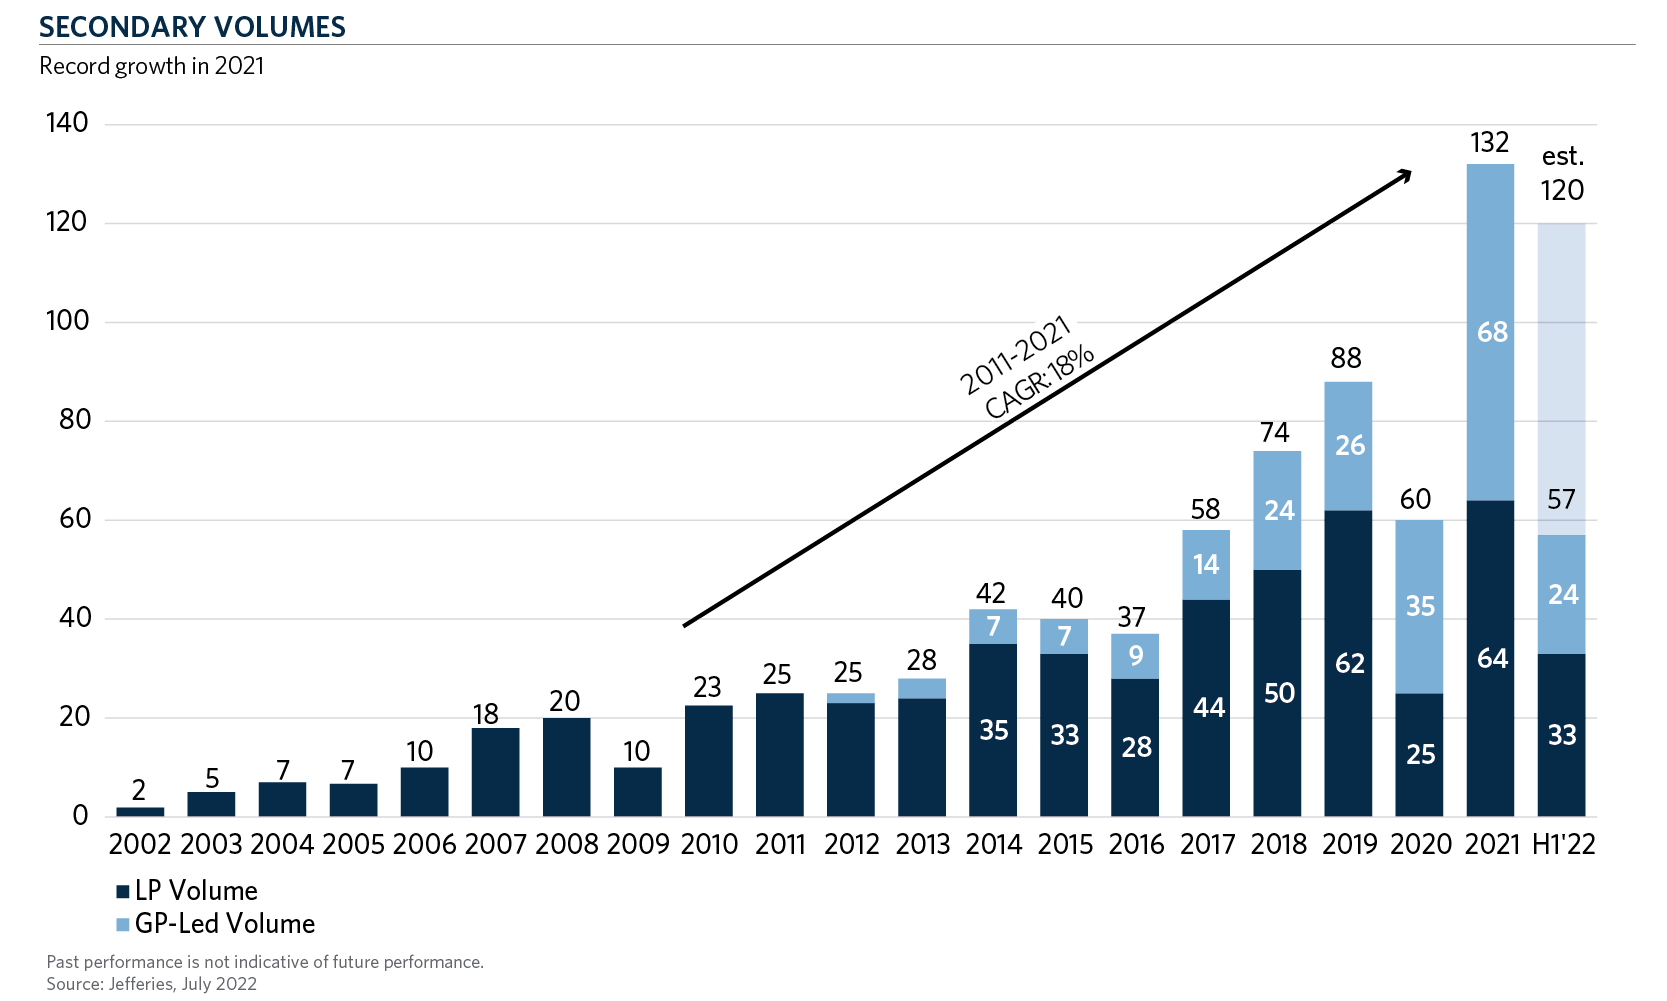
Different market environments may be more suitable for LP-led transactions. While 2021 was a record year of $132 billion of total secondary transaction volume—with GP-led secondaries slightly outpacing LP-led secondaries $68 billion to $64 billion—the reverse is true in the first half of 2022.3,4 Secondary transaction volume in the first half of 2022 increased to $57 billion, compared to the first half of 2021 volume of $48 billion.4 Fifty-eight percent of that 2022 volume ($33 billion) was from the LP market.4 Year-end estimates are on track for $120 billion+ with an increase in the amount of limited partnership portfolios trading in the second half of the year.
Secondary Market Characteristics and Seller Profiles
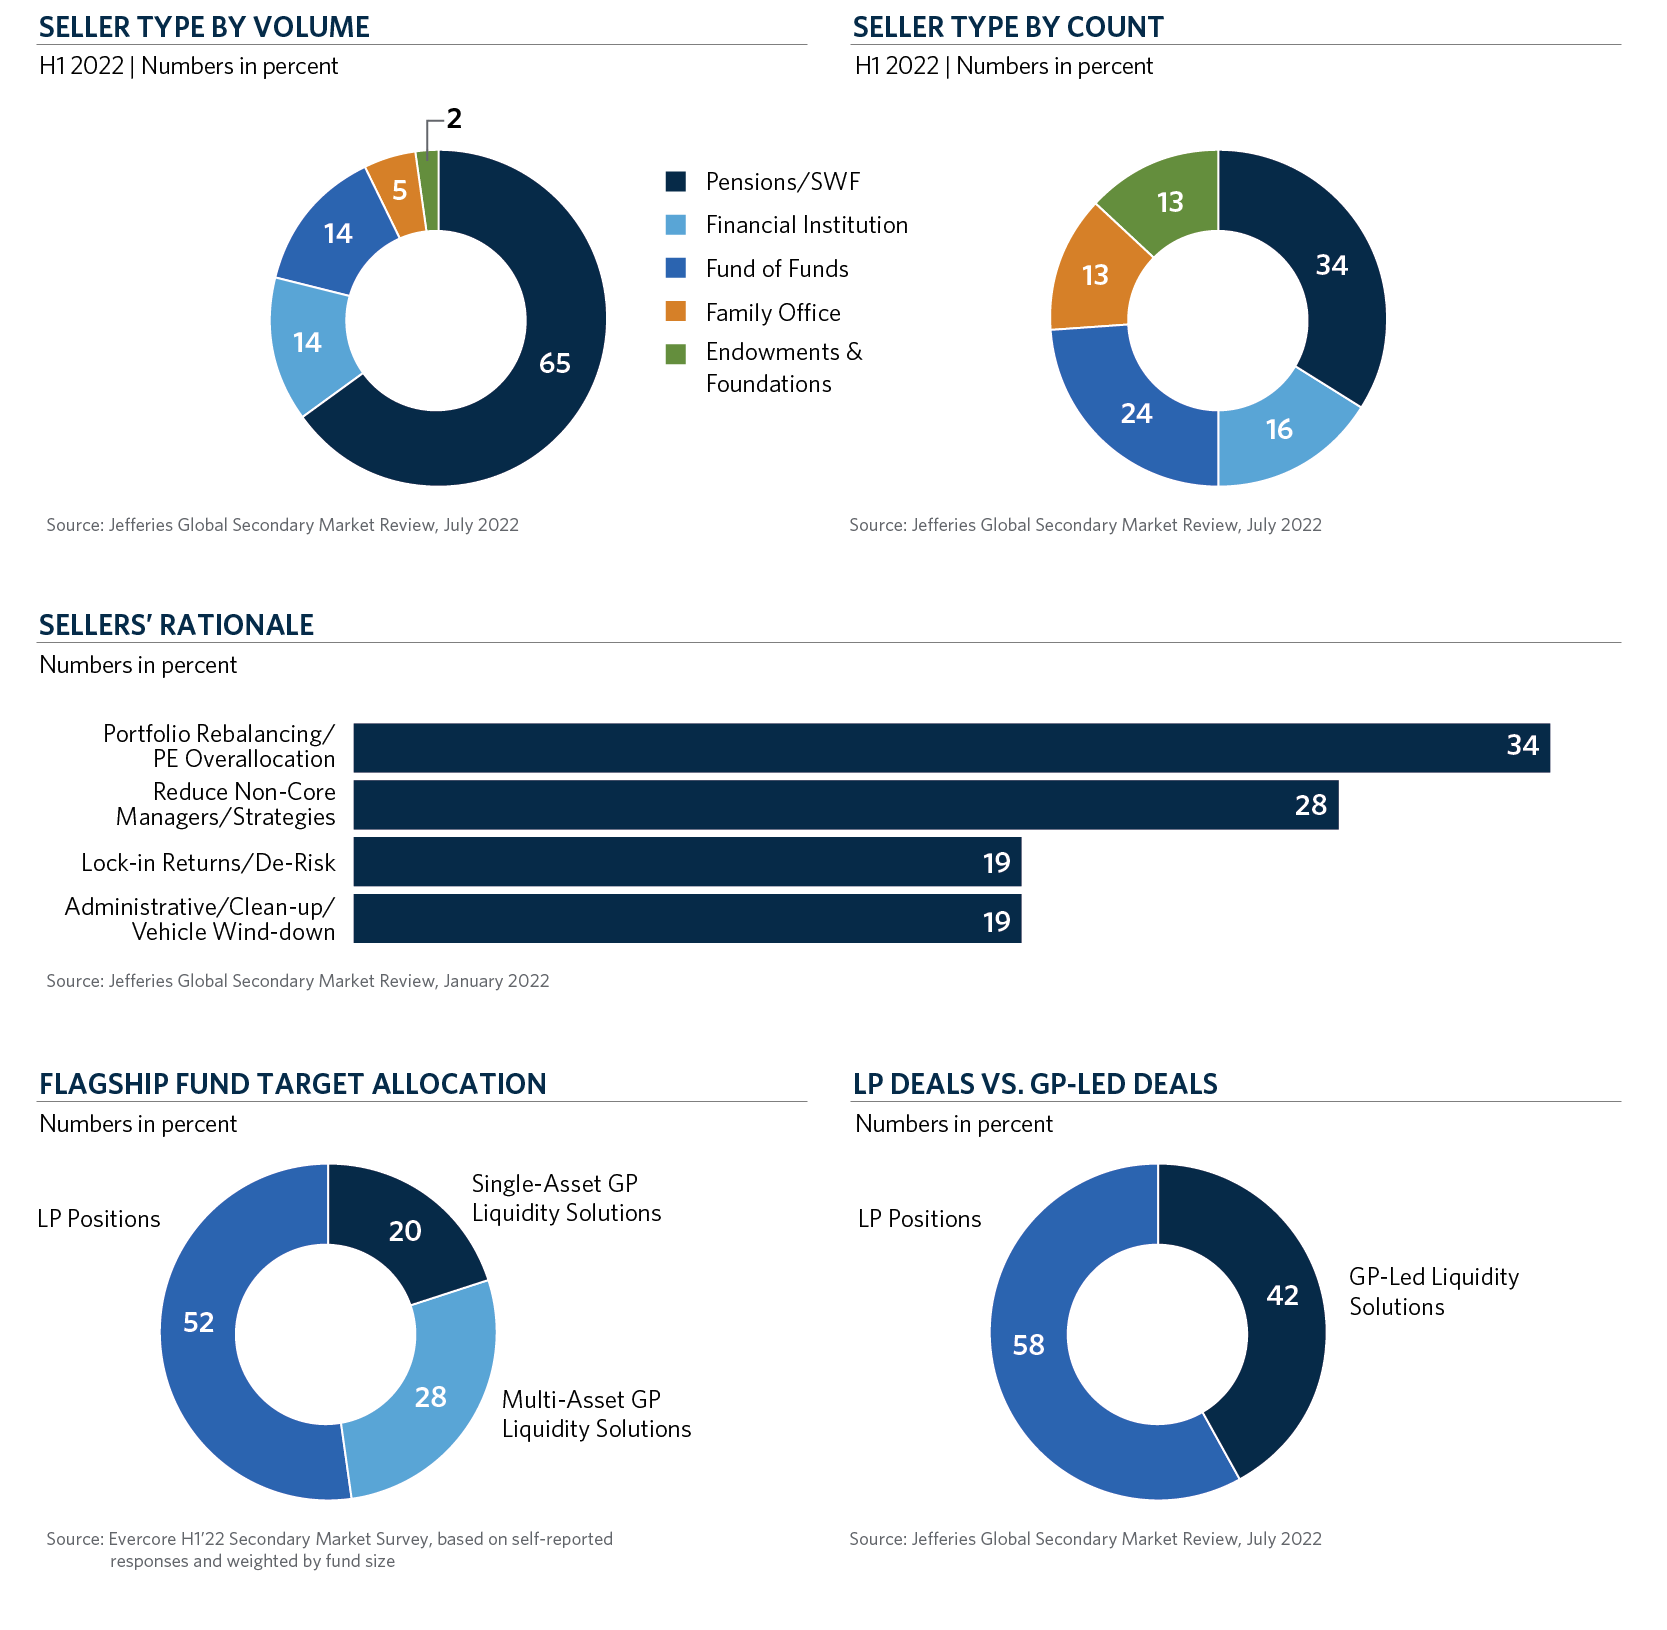
Across all sellers transacting in the first half of 2022, 48 percent were selling for the first time4, with portfolio management and private equity overallocation as the leading reasons driving LPs to sell. With the volatility and decline in public stock prices, many investors are impacted by the “denominator effect”. This market-induced overallocation to private equity has necessitated the need for investors to reposition their portfolios, resulting in strong selling volume in the first half of 2022, that is expected to carry over into the second half of 2022. Institutions have looked to the secondary market as they seek to condense their active manager set and reduce their exposures to non-core relationships and strategies. To this end, investors have also come to realize that they need to invest across vintage years.
Limited Partnership and Portfolio Interests
The sale of limited partnership interests remains core to the secondary market. Limited partnership interests and portfolios drive the key outcomes that secondary investors look to achieve—strong risk adjusted returns, shorter hold periods, mitigation of the j-curve, diversification, and consistent cash flows. While the flow of limited partnership interests wane in periods of dislocation when the bid-ask spreads become too wide, these types of sales rebound quickly.
The second half of 2021 and first half of 2022 have seen a large number of portfolios in the market, including the largest ever record LP portfolio sale of $6 billion completed earlier this year.5 Secondary funds and fund-of-funds have continued to sell to wind down their vehicles and to alleviate administrative burdens. Institutions have looked to limit the number of managers they are engaged with and have adjusted their portfolios accordingly by selling non-core investments or tail-end assets where fatigue has set in. Investors have sold younger assets with the hopes of reallocating capital into newer managers. With the strong appreciation in venture and private equity assets, some have sold to lock in strong performance, all while managing their overall allocation to private capital.
Record fundraising and the continued aging of investments will continue to drive limited partnership sales in the future. Six trillion has been raised for private capital in the last five years across over 17,500 funds.2 Nearly five trillion was raised from 2009-2016.2 There is over $500 billion of assets in tail-end funds6, creating an abundant supply of LP secondary volume. We expect this volume to continue to grow as the total private capital market is expected to reach $12 trillion of volume by 2026, leading to at least $225 billion of projected secondary deal flow by 2026.2
$8.6 Trillion of Capital Raised from 2009-20192,7
↓
~$500 Billion Potential Tail-End Funds6
Conclusion
For a secondary investor, the evolution of GP-led transactions has enabled secondary funds not only to benefit from the potential of early distributions, high IRRs and capital efficiency, but also high ROIs. The growth of the GP-led portion of the market has added to the already tremendous overall growth of the market. Yet, despite all the momentum in the secondary market, it is still a small and inefficient market relative to the overall private capital market. There are currently over $7.5 trillion in assets under management in the private capital market. One hundred and fifty billion, a record year of secondary volume, would still account for only 2.0 percent of the overall market.
The secondary market has proven resilient over various market cycles. Today, the opportunities in the secondary market have never been greater. Halfway through 2022, we believe the opportunity set, especially on the LP side of the market, is vast and that those invested in secondaries funds or with dedicated teams able to sift through the large amounts of LP transactions to find the best opportunities and angles into the market will likely see attractive risk adjusted returns.
- GP-led secondary transactions are led by the general partner of a fund and look to offer a liquidity option for all limited partners (LPs) often through a newly created special purpose vehicle. LP-led transactions are one-off transactions led by one limited partner in a fund looking to sell one or more limited partnership interests at some point during the life of the fund.
- Pitchbook 2021 Private Fund Strategy Report
- Jefferies Global Secondary Market Review, January 2022
- Jefferies Global Secondary Market Review, July 2022
- Lim, Massa, Robertson, “Calpers unloads Record $6bn of private equity stakes at discount”, July 2022
- Tail-end funds defined as funds 10 years or older
- Selected time period includes non tail-end funds older than three years. Funds older than three years are typically more funded and we believe are more likely to trade on the secondary market.