As the cost of debt on private equity ("PE") has risen and its availability has fallen, deal-making within PE has slowed. PE firms that have historically been overly reliant on leverage in financing transactions and creating value are feeling the pressure as their portfolio companies struggle to accommodate higher interest costs. Middle-market PE firms, which typically depend less on debt and more on growth, have a compelling advantage in the current environment in their ability to drive outsized returns.
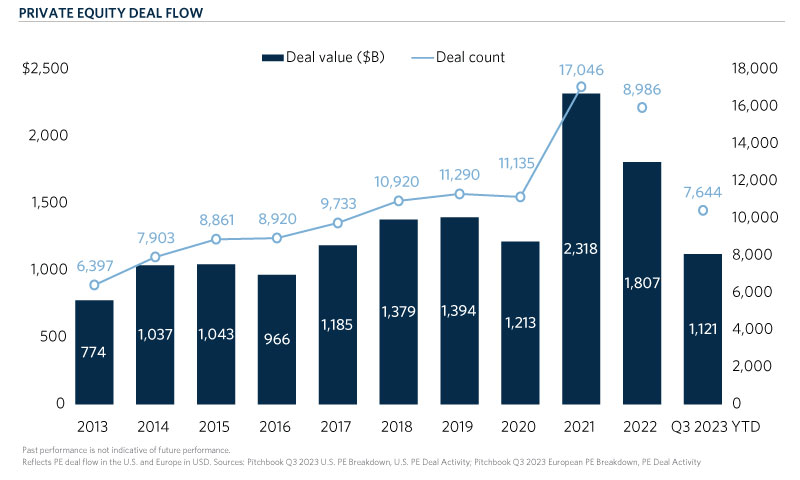
In Q4 2021, PE transaction volumes in the U.S. and Europe reached a peak of $634.9 billion in Enterprise Value across 4,866 deals1,2. Despite a pandemic and rising inflation3, private equity appeared invincible.
The U.S. Federal Open Market Committee, daunted by the high inflation rates, first raised the federal funds rate from near zero by 25 basis points in March 20224. This marked the first of eleven interest rate increases, culminating in the current rate of 5.25-5.5 percent4. SOFR has followed this trend, rising from near zero at the start of 2022 to over 5.3 percent today5. PE subsequently took a tumble, with deal-making volumes in the U.S. and Europe down ~49 percent by count and ~46 percent by value from Q4 2021 to Q3 20231,2. On an annualized basis, 2023 deal value volumes are ~36 percent below 2021 levels1,2.

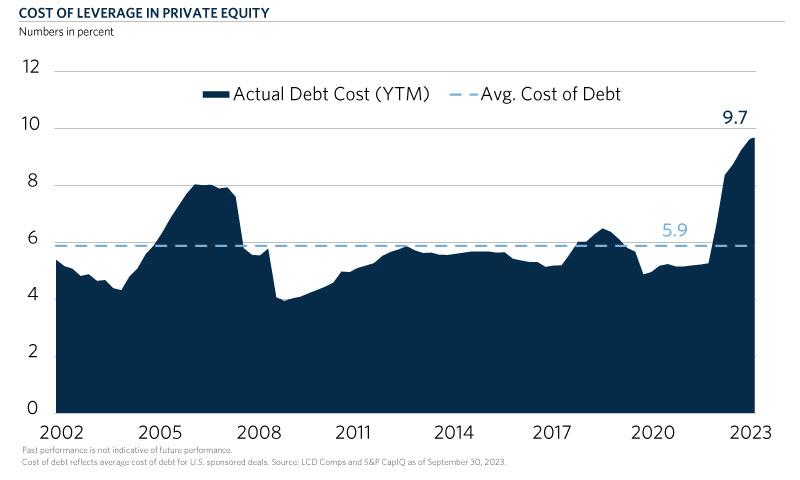
Traditionally, PE fund managers have utilized leverage in portfolio companies as one of the levers of value creation. This routinely yielded positive outcomes when debt was virtually free, but now buyers are faced with a substantially increased cost of debt, currently ~380 basis points above the 20-year average in the U.S.6 This is also apparent in Europe with the cost of debt on private equity deals doubling from ~4 percent in January 2022 to ~8 percent today7.

In addition to an increased cost of debt, PE firms have struggled to find financing as debt availability wavered in 2022 and early 2023, with the syndicated bank loan market effectively seizing. The sponsored loan volume in the U.S. and Europe declined ~67 percent from its peak in 2021 at $573.5 billion to only $191.4 billion in 20228. On an annualized basis, 2023 is expected to be approximately flat to 2022 at $199.9 billion of sponsored loan volume8. Private credit has helped fill some of the gap as banks have retreated, with the proportion of buyout transactions funded with private debt increasing from ~41 percent in 2021 to ~67 percent in 1H 20239.
THE TURN TO EQUITY
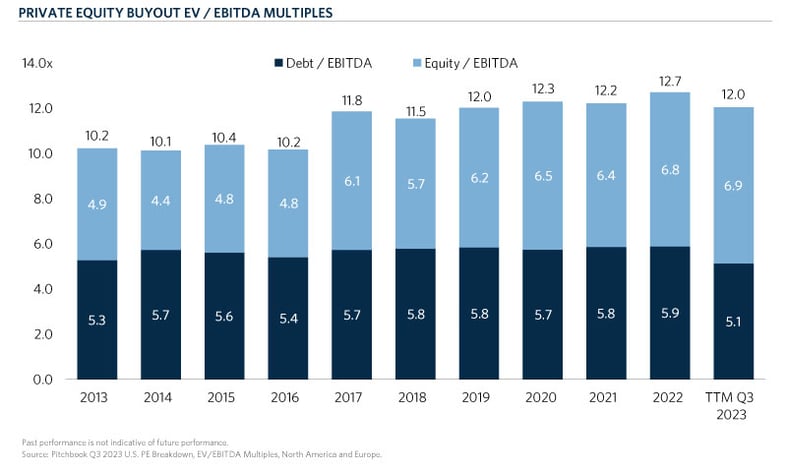
The coupling of a higher cost of debt and lower debt availability has led many PE firms to increase equity contribution and focus more on executing add-ons for their existing companies. In North America and Europe, equity as a percentage of deal value increased to ~56 percent in YTD Q3 2023 from a 10-year average of ~46 percent1. Platforms investments, which often rely the most on leverage, represented only ~22 percent of U.S. and European PE deals in YTD Q3 2023, down from a 10-year average of ~30 percent1,2.
However, while buyers remain discouraged, sellers’ price expectations haven’t changed much, creating a stand-off in the dealmaking environment. The deals that have transacted have often been the highest quality, resilient assets, commanding elevated purchase price multiples in line with historical levels: the median PE buyout EV / EBITDA multiple in North America and Europe for the LTM Q3 2023 period was 12.0x1.

Buyout firms with higher leverage ratios, often found in larger deals that command higher purchase price multiples to begin with, are now feeling the pressure as their portfolio is faced with meaningfully higher interest rate costs consuming cash and cutting into the bottom line. The LBO strategy of driving returns through financial engineering may have worked when debt was cheap, but PE fund managers today must rely on other avenues of value creation. At CF Private Equity, we look to partner with PE firms that have a demonstrated history of driving operational improvements at companies, helping companies grow while increasing profitability.
THE MIDDLE MARKET OPPORTUNITY
Mega-cap PE firms invest in large companies and are often forced to use a significant amount of debt. Middle-market PE firms, on the other hand, have historically had access to less debt and instead been compelled to drive returns through company growth and multiple arbitrage after transforming a business from an often poorly run, founder-dependent business into a professionally managed asset of strategic value.
PE firms in the lower-end of the market are still sometimes experiencing higher than historic average purchase price multiples and high bid-ask spreads, but this is to a lesser degree than large-cap PE. Middle-market fund managers are often buying founder- or family-owned companies with no prior institutional backing and that are generally sourced proprietarily or through limited auctions. These factors compound into EV / EBITDA entry multiples that are turns below the market average. As middle-market PE firms build companies into scaled and diversified enterprises and sell them upmarket to strategics or larger financial sponsors, they may be able to exit these companies at higher multiples.
However, PE exit value in 2023 was down ~73 percent in the U.S. and ~32 percent in Europe on an annualized basis from its peak in 20211,2, making this strategy less actionable in the current market. PE firms, unable to drive value through leverage or multiple arbitrage, are turning to growth as the most viable path to value creation.
Middle-market companies, with their smaller size and often earlier position in the business life cycle, have more room to grow than larger companies and can more feasibly double or triple in size. To drive this growth, PE managers have traditionally used a combination of organic and operational initiatives coupled with M&A. Realization of these initiatives require a more hands-on and active approach on behalf of the fund manager. Middle-market PE firms’ ability and willingness to get their hands dirty and drive growth for portfolio companies is a quality that is becoming increasingly valuable in the current environment.
CONCLUSION
In a world where debt is expensive and difficult to secure, PE firms that operate in the middle-market with prior expertise growing and building companies have a leg up on competitors. Investors should consider how exposed their portfolio is to highly levered PE-backed companies—and how more operationally-oriented middle-market PE exposure may benefit them.
- Pitchbook Q3 2023 U.S. PE Breakdown
- Pitchbook Q3 2023 European PE Breakdown
- FRED Consumer Price Index: All Items: Total for U.S.
- https://www.forbes.com/advisor/investing/fed-funds-rate-history/
- Federal Reserve Bank of New York, SOFR Reference Rates -https://www.newyorkfed.org/markets/reference-rates/sofr
- LCD Comps and S&P CapIQ as of September 30, 2023. Cost of debt reflects average cost of debt for U.S. sponsored deals
- EUR Single B debt from Bloomberg and Factset as of August 30, 2023
- LCD Sponsored Loan Volume, U.S. and Europe (USD)
- Bain & Company Private Equity Midyear Report 2023


