In order to underwrite new commitments in an uncertain market environment, it is critical to normalize valuation methodologies and deeply analyze underlying portfolio companies.
Following more than a decade of positive performance, the venture capital valuation ecosystem is undergoing a valuation reset based on a broader economic slowdown, higher interest rates, and public market volatility.
Unlike daily-valued public equities, private market valuations are typically adjusted quarterly. For private venture capital, the primary drivers for valuation changes are new financing rounds (at fresh valuations) and/or exit events. As a result, venture managers usually set the valuation (or “mark”) of their companies based on the price of the last privately negotiated financing round.
In an environment where companies are raising new rounds often, these financing events provide a “real-time” fair market value. However, as investment activity has slowed and the valuation environment shifted, the valuation process looks much different today than in the highly active 2021 period. As such, the time between fundraising rounds has been extended and thus managers are relying on other venture capital valuation frameworks to value companies. After last round price, in general, the two most employed valuation methodologies are:
- Publicly Traded Comparables where comparable public company multiples are applied to the operating metrics of the company, and/or
- Option Pricing Model which uses statistical factors including the risk-free rate, volatility, and equity risk premium among other inputs to derive an equity value for securities in a complex capital structure.
These varying valuation methodologies (and inputs) can lead to significantly different holding values across managers – even when valuing the same start-up or company. As a simple example, we have a later-stage company in our portfolio marked by one manager at a 26 percent discount to the last round price while another is marking it at a 40 percent discount, resulting in a delta in enterprise value of billions of dollars.
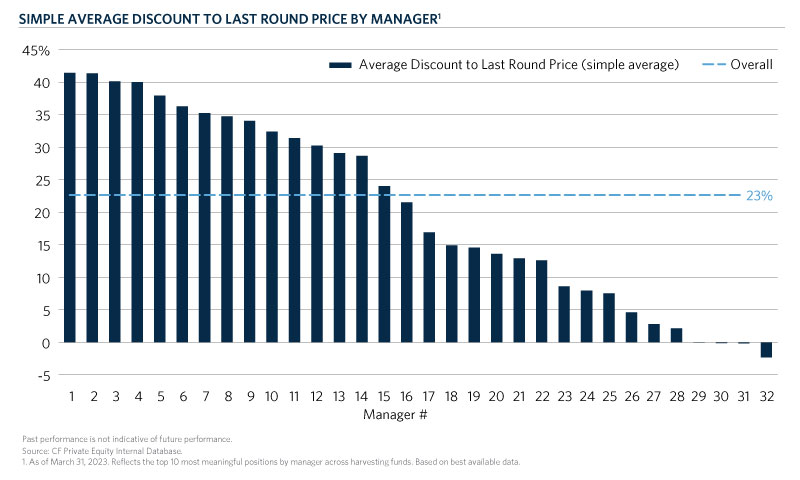
We were curious to understand the average discount that our venture managers are applying to their portfolio companies and how much variance exists across managers. To answer this, we collected data from over 30 venture capital firms to evaluate the “fair market value” holding valuations of the 10 most meaningful private portfolio companies (by net asset value). In many instances, we had exposure to the same company across multiple managers. In turn, we were able to observe how managers’ marks differed for identical companies and quantify the embedded discounts applied to the valuation of those companies’ last financing rounds. The key takeaways from our analysis are as follows:
- On average, venture managers hold portfolio companies at a 23 percent discount to their last round price,
- There is significant variability in valuation methodologies across managers. Moreover, the more established (or longer tenured) the firm, the more significant the embedded discounts,
- Among different geographic regions, manager valuation methodologies generally did not vary significantly.
Regarding the first takeaway, managers are holding companies at a valuation that equates to a 23 percent discount to the last round price on average. This is equivalent to a company that raised its last round of financing at a $500M valuation being held at a $385M valuation. Or put in the context of fund performance with the discount applied across the entire portfolio, a hypothetical fund with a 3.0x gross multiple would improve to a 3.9x gross multiple if its companies were marked to last round. For the start-ups that are fated to raise new financing rounds at valuations below their last round (increasingly common in this valuation environment), this 23 percent average embedded discount implies there is an inherent valuation buffer to last round, effectively cushioning further negative impact to fund returns.
Second, there was significant variability across managers. Managers with the most conservative marks average a 41 percent discount to the last round price across their portfolio, while on the other end of the spectrum, a few select managers marked to the last round. Interestingly, newer firms (e.g., Funds I-III) were more likely to value companies at or close to the last round relative to more established managers.
Lastly, in general, we see consistent results across geographic regions with one exception. There is little variance in data collected from managers based in the United States, Europe, Israel, and India. However, China-based managers, in aggregate, applied a lesser discount (~17 percent) to the last round than their global peers.
What conclusions can we draw from our data?
Valuation policies and methodologies are important when comparing, evaluating, and underwriting venture managers. In practice, valuation policies are employed differently across managers. As a result, managers can hold the same start-up at materially different enterprise values, particularly in the growth and later stage. In today’s volatile market, you must ensure you are comparing apples to apples across managers, taking into account the approach of each to valuations. By normalizing valuation methodology, capital allocators can gain more clarity for portfolio management and new investment decisions. In turn, you will also have a better sense of ‘what is in your wallet’ or rather, what makes up your portfolio.