2023 WRAP-UP
2023 marked a second straight year of lower deal volumes for private equity following the record-breaking activity of 2021. U.S. private equity aggregate deal value declined to $645.3 billion in 2023, down 29.5 percent from 2022 and 45.5 percent from 2021, as deal makers navigated dislocation in M&A markets catalyzed by higher interest rates and tighter debt markets1. Amidst the dislocation, deal multiples have begun to moderate, declining 12.9 percent YoY to 10.9x EV / EBITDA in 2023 (vs. 12.5x EV / EBITDA in 2022)1.
Private equity exits were even more impacted in 2023. Private equity aggregate exit value of $234.1 billion in 2023 was down 23.5 percent from $306.0 billion in 2022, and down 72.0 percent from $836.1 billion in 20211. Private equity firms, not satisfied with the exit opportunities in the current landscape, opted to hold their portfolio companies for longer, further depressing private equity deal volume.
2024 OUTLOOK
Heading into 2024, the private equity industry is faced with continuing uncertainty. Inflation, which steadily declined through most of 2023, ticked up in December 2023, adding hesitation to previously expected federal funds rate cuts. Moreover, the world is grappling with simmering geopolitical tensions as well as several active conflicts which cloud the overall economic outlook for 2024. Most recently, Houthi rebels have attacked several vessels navigating the Red Sea, threatening the security / viability of the vital shipping passageway. Private equity firms may be forced to manage through continued escalation of these conflicts over the near- to medium-term. While conditions remain uncertain, there are several signs suggesting private equity could be positioned for a rebound.
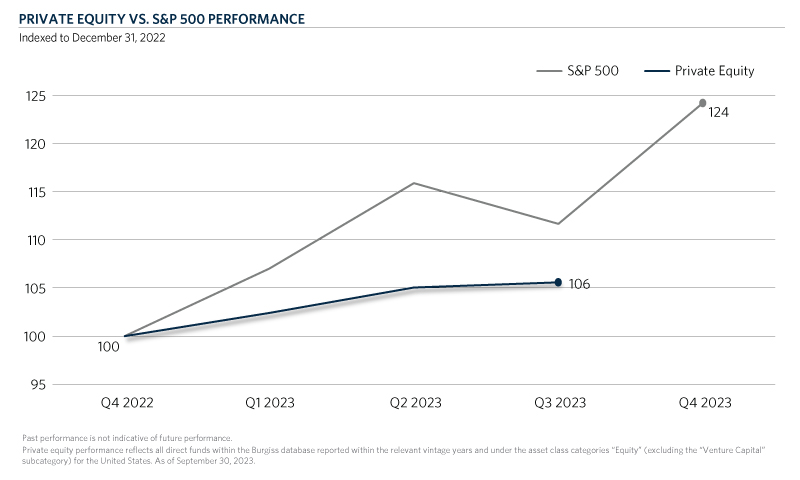
The public markets rallied last year, with the S&P 500 gaining 24.2 percent over 2023. Meanwhile, private equity’s performance was more muted, with U.S. private equity gaining 5.6 percent in YTD Q3 2023 (Q4 2023 data not available as of February 14, 2024)2. Looking to 2024, public market performance should influence private equity marks, which could encourage private equity firms to re-enter the M&A markets given a more advantageous valuation environment.
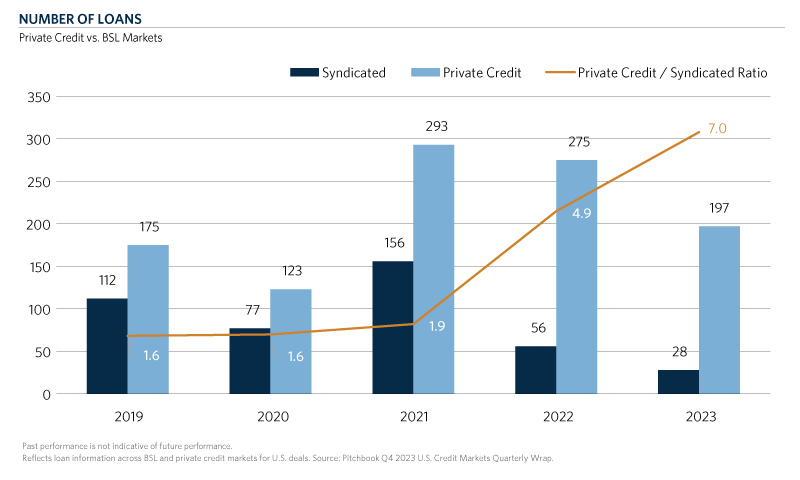
The debt markets, which tightened following the Federal Reserve’s initiation of interest rate hikes beginning in March 2022, have showed signs of opening. Following the first rate hikes, large banks virtually disappeared from financing private equity deals as they digested debt priced in the “free money” era. In recent months, banks have slowly re-entered the debt markets for private equity deals given the clearer monetary outlook. Filling the void during the banks’ absence were direct lenders, which executed on almost 200 deals in 2023 relative to less than 30 broadly syndicated loans3. Direct lenders are expected to play an increasingly important role in private equity over the coming years, buoyed by the expected growth of the private equity industry and strong investor appetite. Nonetheless, in a higher rate regime, private equity firms are using less debt to finance transactions in favor of additional equity (see our recent blog, The Rising Cost of Debt: Impact on Private Equity, for more context on the current private equity debt financing environment).
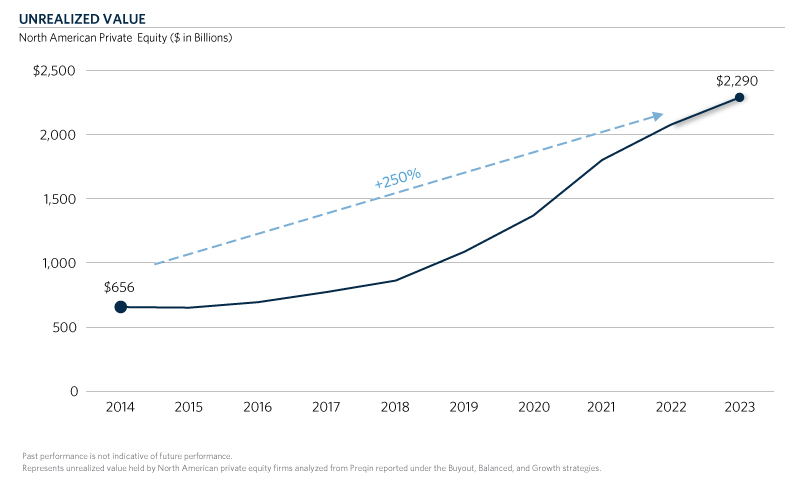
Perhaps the most compelling case for a private equity rebound in 2024 lies in the asymmetrical (and arguably unsustainable) dynamics of the current market. Notably, Pitchbook calculates the median hold time for U.S. private equity investments exited in 2023 at over 6.4 years, an all-time high1. As a result of outsized investment periods, North American private equity firms now hold assets representing $2.3 trillion in aggregate unrealized value, up 27.0 percent from $1.8 trillion in 20214. Unsurprisingly, limited partners have increasingly communicated their need for liquidity from existing private equity investments prior to new commitments.
On the other side of the equation, private equity fundraising persisted even as deal flow has slowed; in 2023, dry powder for U.S. private equity funds ticked up to $955.7 billion, a new all-time high for the industry1. These dollars are largely tied to closed-end vehicles with defined investment periods; at some point, managers will be forced to deploy capital, even in the absence of ideal deal making conditions.
Thus, while we can’t predict the future, we believe the conditions noted above could precipitate a rebound for private equity dealmaking and exits in 2024 relative to 2022 – 2023. Moreover, we believe small- / middle-market managers are particularly poised to capitalize on the current opportunity in private equity. Of the $955.7 billion in dry powder held by private equity managers, $773.6 billion (~81 percent of total dry powder) was held by funds greater than $1 billion in fund size1; this pool of capital should continue to support smaller private equity managers selling their portfolio companies up-market. Additionally, as debt has become more expensive, we think smaller managers relying less on leverage and more on operational value creation to generate returns will be advantaged in the go-forward environment.
- Source: Pitchbook 2023 U.S. PE Breakdown
- Private equity performance reflects all direct funds within the Burgiss database reported within the relevant vintage years and under the asset class categories “Equity” (excluding the “Venture Capital” subcategory) for the United States. As of September 30, 2023.
- Reflects loan information across BSL and private credit markets for U.S. deals. Source: Pitchbook Q4 2023 U.S. Credit Markets Quarterly Wrap.
- Represents unrealized value held by North American private equity firms analyzed from Preqin database reported under the Buyout, Balanced, and Growth strategies.
Source materials available upon request.