The continued growth of private equity may lead to a bright future for secondaries as:
-
~$12.7 trillion of capital has been raised in the last 15 years in private equity, and
-
Over 43,500 funds have been raised in the last 15 years.1
As limited partners (“LPs”) seek to proactively manage their private equity portfolios, the secondary market, a derivative of the primary market, is poised to potentially double in size or more.
Even in 2022, a year of dislocation, the secondary market recorded its second largest year ever by transaction volume. 2023 could potentially see a new record year in secondaries, surpassing 2021 when the market reached $132 billion.2
Macro-environment Overview
2022 was a challenging year filled with uncertainty amidst rising geo-political tensions, most notably the Russo-Ukrainian war, as well as continuous COVID outbreaks, inflation, rising interest rates, supply-chain disruptions, and general economic uncertainty. All these headwinds have contributed to public market volatility and declines.
Concurrently, 2022 brought forth a slowdown in IPO activity and a significant decline in M&A activity, leading to less realizations in private portfolios. Furthermore, private valuations are typically less volatile, as compared to valuations in the public markets. As a result of these factors, the value of private investments in investors’ portfolios have remained relatively steady.
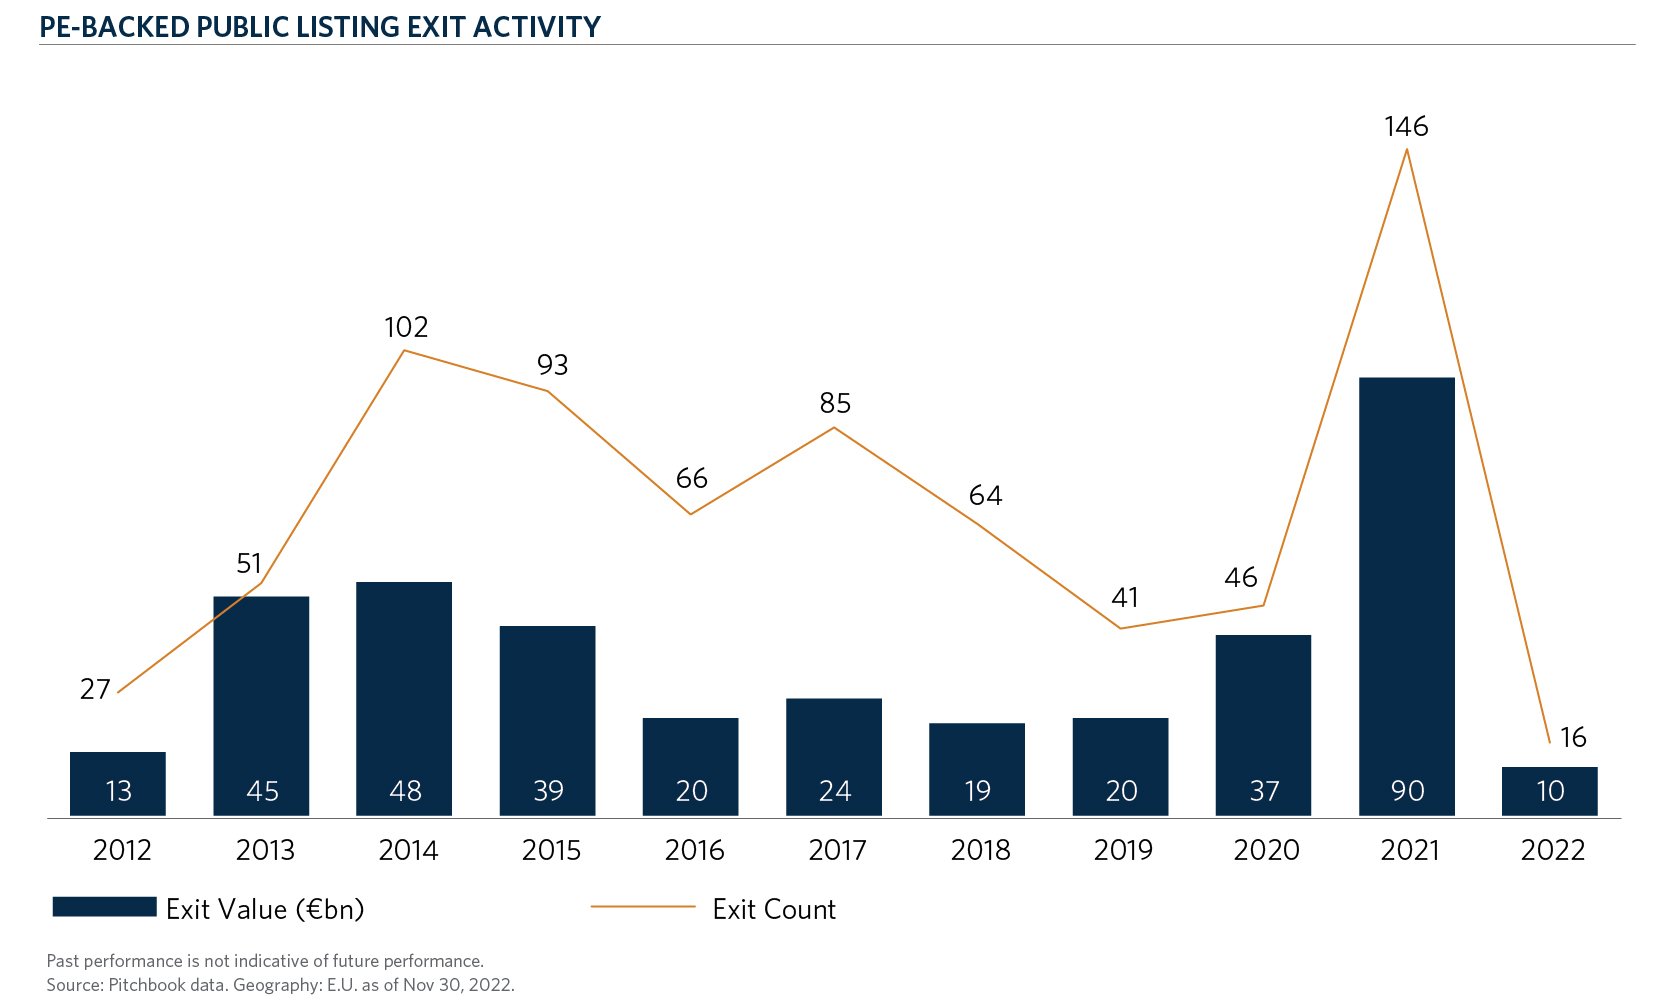
The charts below highlight the contraction in both private equity (PE) exit activity3 and PE-backed public listing exit activity.4
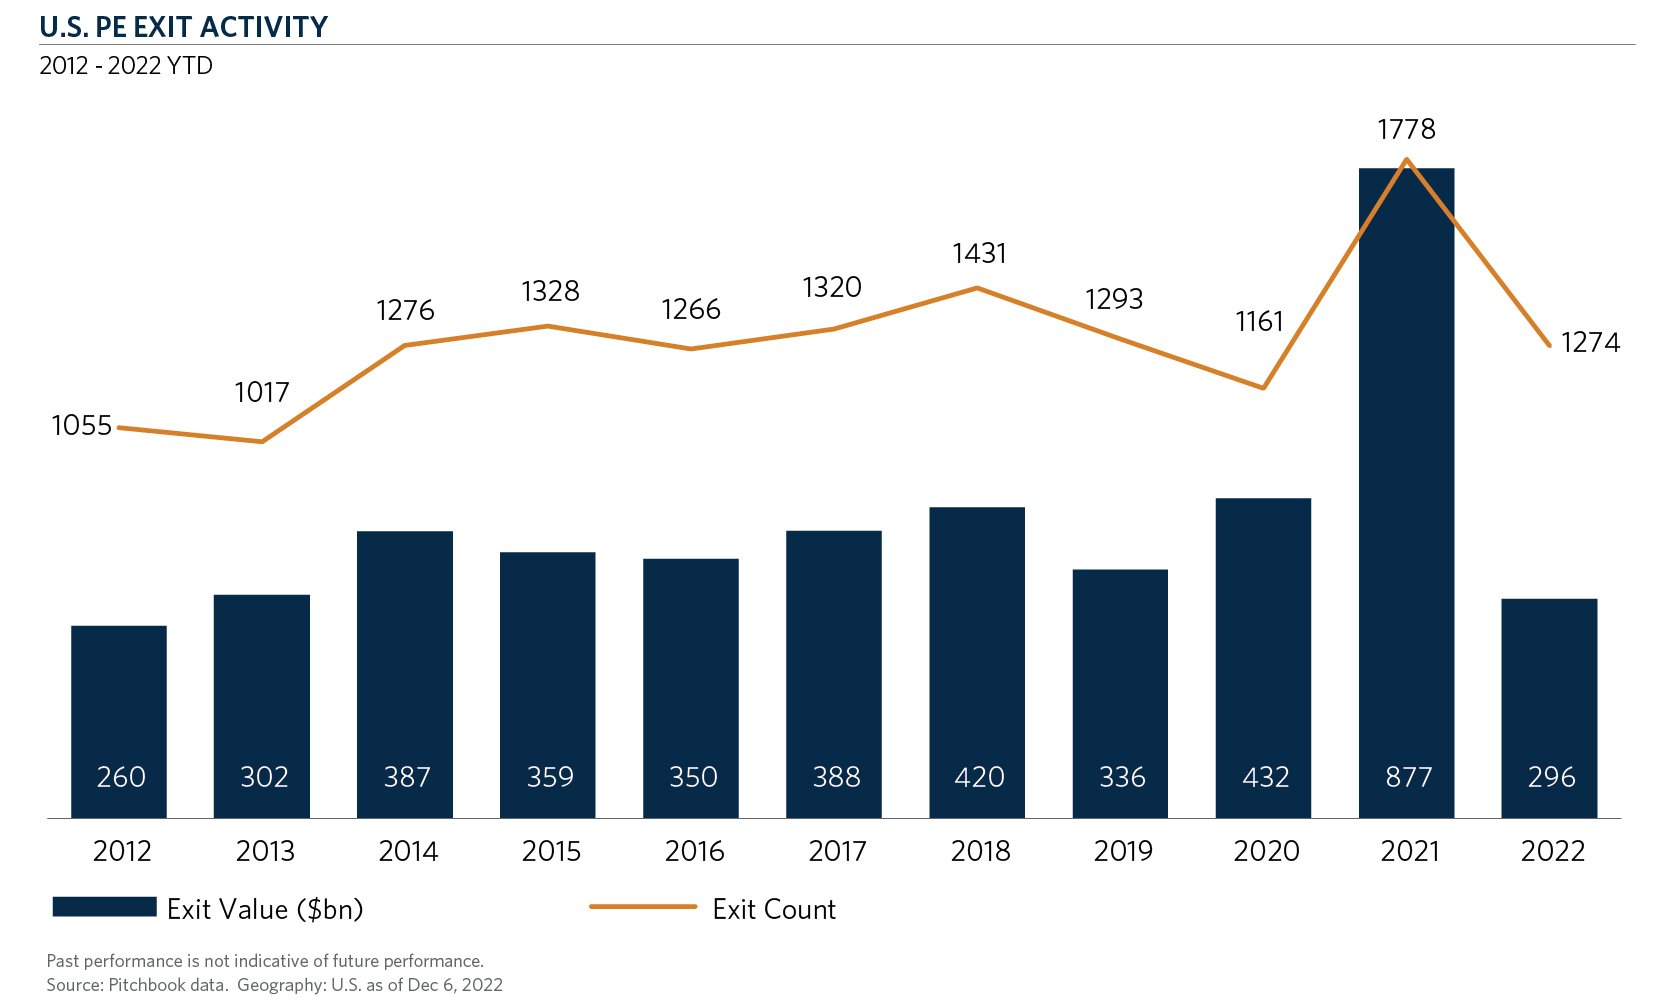
The volatility and declines in the public markets, in conjunction with the relative stability in the private markets, have led to investors feeling the impacts of the denominator effect as institutions may now be over allocated to private equity due to the relative declines in their public equity portfolio.5
Market Performance and Investor Impact
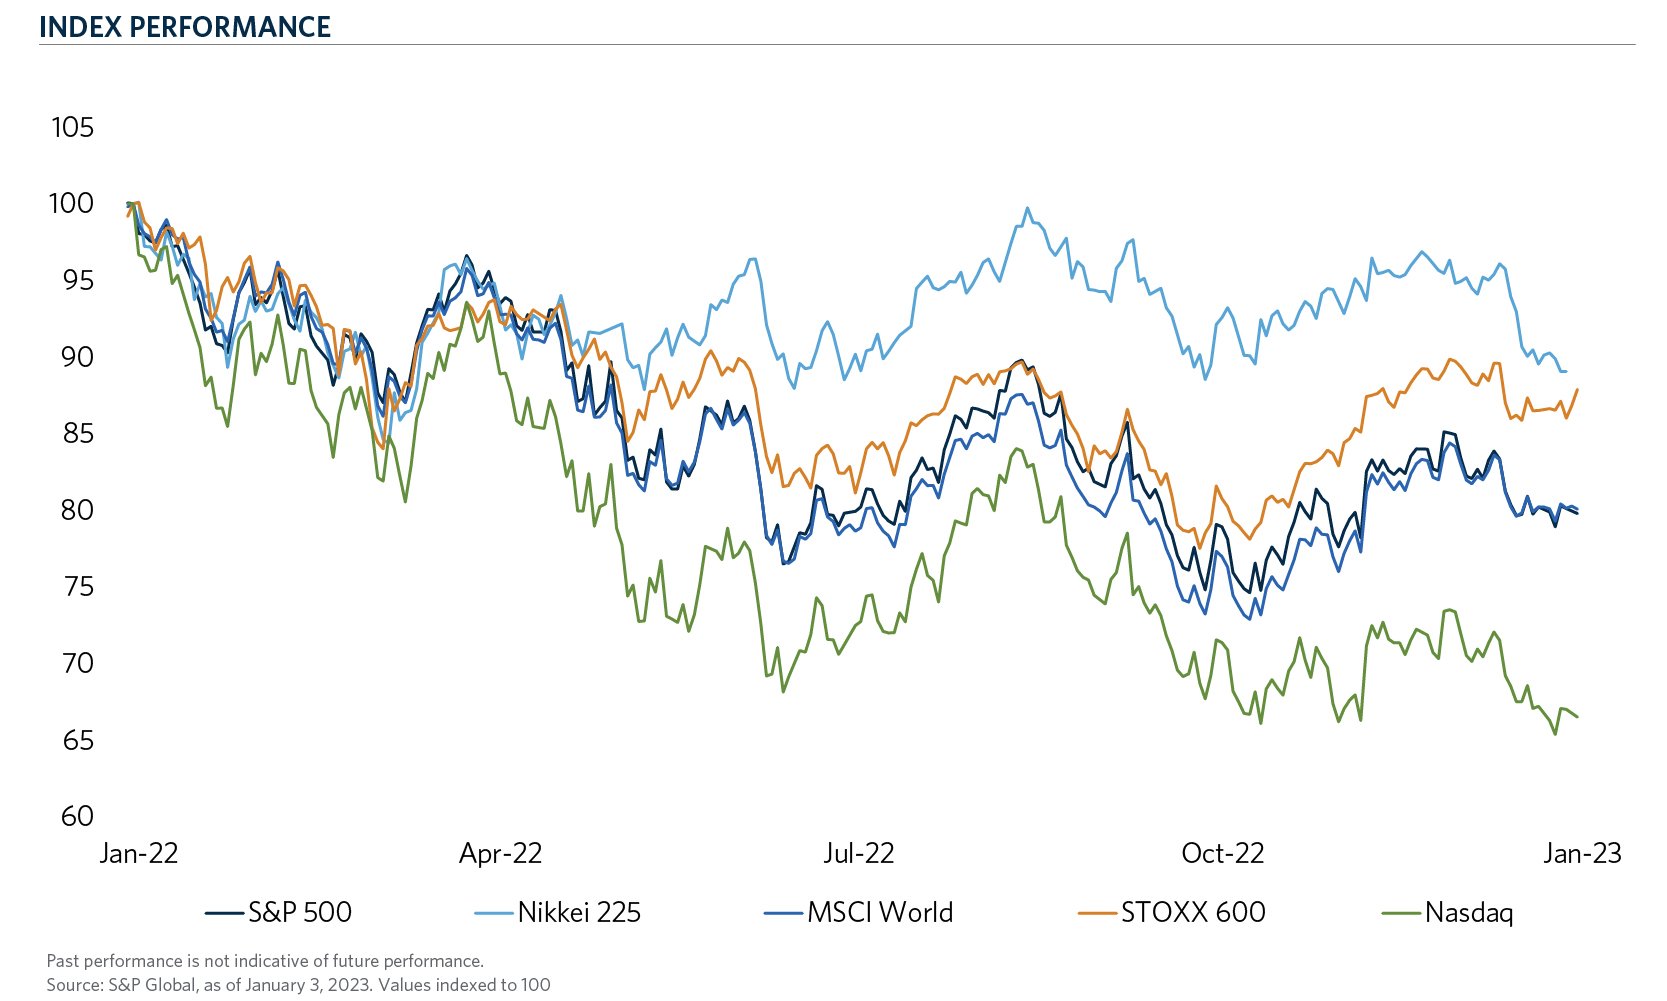
The poor public equity market performance seen in 2022 reflects the tumultuous conditions of the macro-economy. In 2022, the S&P 500 declined by nearly 19 percent6, representing its worst annual return in over a decade and the largest decline since the 2008 global financial crisis. Additionally, global public market exchanges such as the MSCI World, Nikkei 225 and STOXX 600 declined nearly 18 percent7, 10 percent8 and 13 percent9, respectively, in 2022. As public markets experienced declines across the globe, technology and growth sectors saw particularly outsized losses, with the NASDAQ falling over 33 percent in 2022.10
The chart below highlights the 2022 performance of several major global public market indices.11
The lag in private equity marks and pessimistic short-term outlook contributed to a widening bid-ask spread in the secondary market during 2Q-3Q 2022. However, by year end, many investors had become desensitized to accepting sizable discounts in order to effectively manage their PE portfolios.
Market Volume and Pricing
Despite the broader market headwinds, the secondaries market remained resilient, recording its 2nd largest year with $108 billion transacting in 2022.12 This strong activity against the backdrop of a challenging macro-environment serves as a testament to the need to manage private equity portfolios and the desire for increased liquidity among private equity investors. Evaluating 2022 secondary volume, the transaction type split was 52 percent LP transactions and 48 percent general partner-led (“GP-led”) transactions and marked the first time, since 2019, that LP volume outweighed GP volume.12 On the LP side of the market, where transactions were more proactive, pricing ranged from ~15 percent discounts for higher quality LP-interests to 30 percent+ discounts for lower quality assets.13 Similarly, the bar for successful GP-led transactions has been elevated as a rising supply of transactions in the market and a buyer universe keying in on top quality assets and sponsors has led to softening in pricing, compared to previous years. Consequently, over 90 percent of continuation vehicles (“CVs”) priced at some level of discount in 2022.13
Secondary Market Characteristics and Seller Profiles
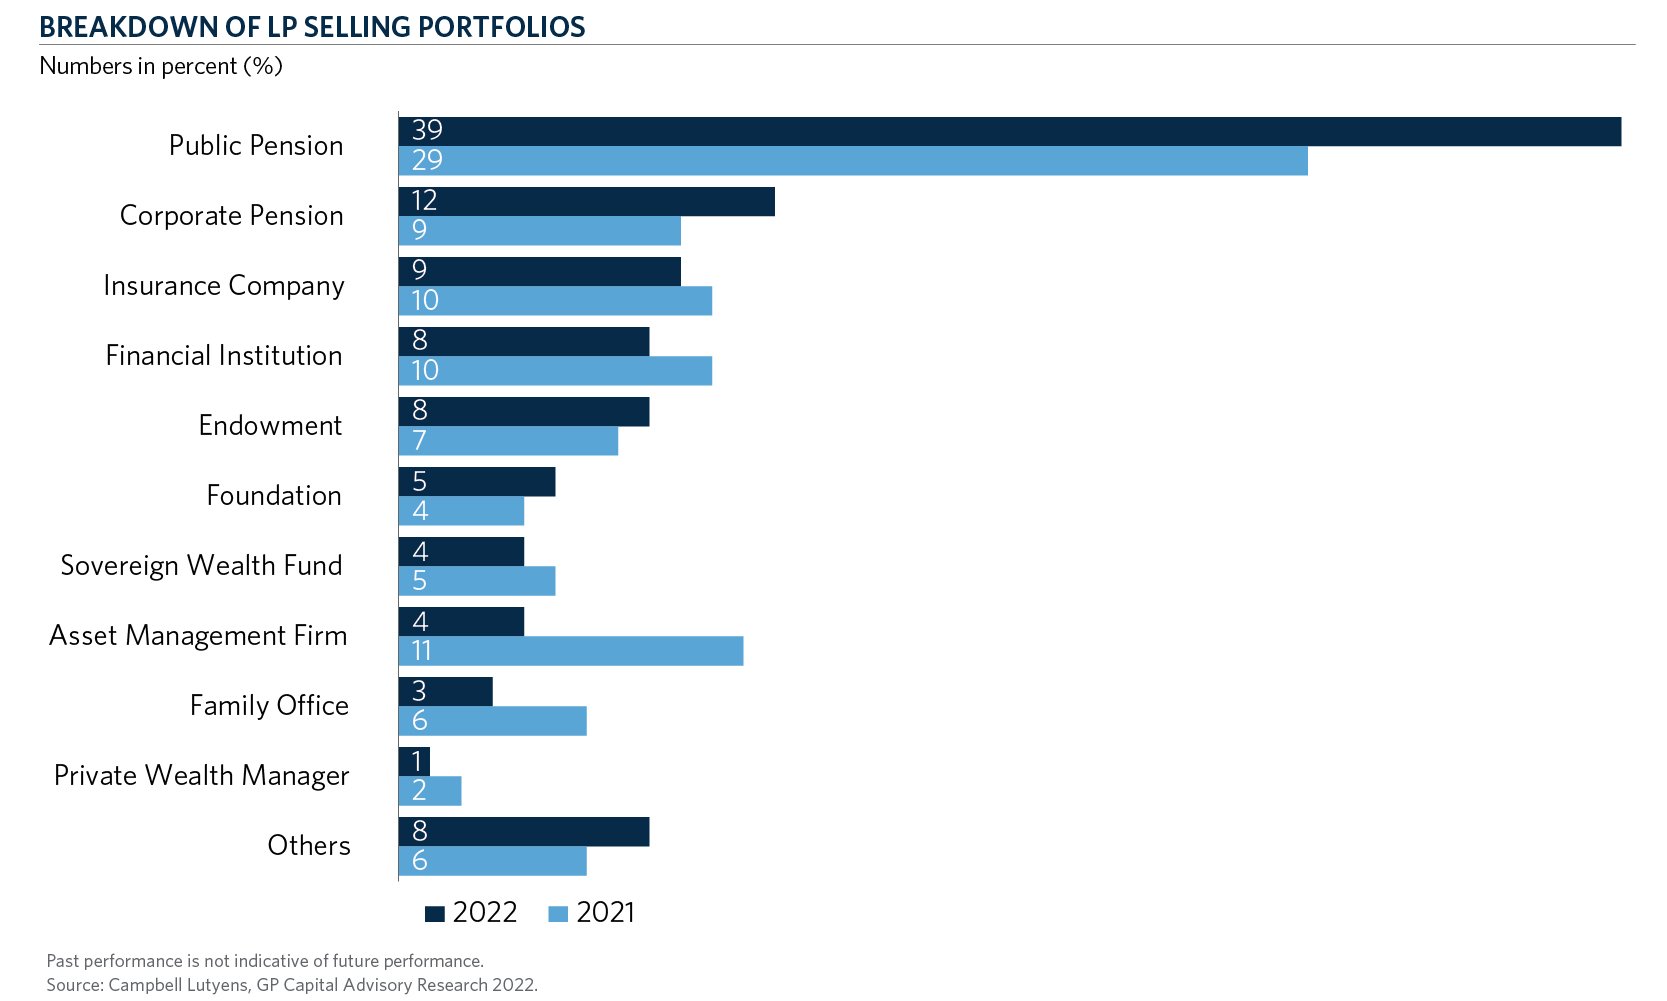
Taking a deeper look at 2022 secondary volume, it is apparent that North America and Europe remain a core focus for secondary buyers. Looking at secondary volume by geography, North America accounted for 61 percent of total volume, followed by Europe at 28 percent and Asia and the Rest of the World (“ROW”) accounting for 5 percent and 6 percent, respectively.14 From a seller’s perspective, the resurgence of limited partner interest sales paired with the forced pressure to sell as a result of the denominator effect has led to an increase in LP portfolios being sold by both public and corporate pensions, as compared to the prior year.15
Conclusion
Even in a tough macro-environment, the secondary market recorded its 2nd largest year on record with $108 billion transacting.12 LPs are becoming increasingly proactive with managing their portfolios, as the denominator effect is forcing LPs who have outsized allocations to private equity to actively manage their commitments through various market cycles and opportunities. With liquidity now being accessible from both LP-led and GP-led transactions, combined with record primary fundraising over the last 15 years, we believe the future of secondaries shows the potential for tremendous growth and should be able to double in size by 2026.
- Pitchbook, Global Private Fund Strategies Report Q1’2022.
- Jefferies, Global Secondary Market Review January 2022.
- Pitchbook data. Geography: U.S. as of Dec 6, 2022.
- Pitchbook data. Geography: E.U. as of Nov 30, 2022.
- IMF, World Economic Outlook Report Oct 2022.
- S&P Global, S&P 500 Factsheet as of February 28, 2023.
- MSCI World Index, Index Fact Sheet.
- The Japan Times, Nikkei index drops 9% in 2022 for first yearly fall in four years.
- Bloomberg, European Stocks Post Worst Year Since 2018 as Growth Fears Rise.
- Nasdaq, US STOCKS-Wall St ends 2022 with biggest annual drop since 2008.
- S&P Global, as of January 3, 2023. Values indexed to 100.
- Jefferies, Global Secondary Market Review January 2023.
- Raymond James, 2023 Secondaries Outlook Survey.
- Evercore, PCA Secondary Market Survey 2022.
- Campbell Lutyens, GP Capital Advisory Research 2022.