For a variety of reasons, some investors believe that private equity may have lost its edge as a key allocation for their portfolios. This perception may overlook reality. A closer examination reveals that the fundamentals are intact and there are attractive opportunities for skilled private equity managers.
As always, investors should be discerning in their choice of managers, and continue to place access ahead of allocation. Here, a look at some widely held perceptions and the reality that may be overlooked or misunderstood.
Perception:
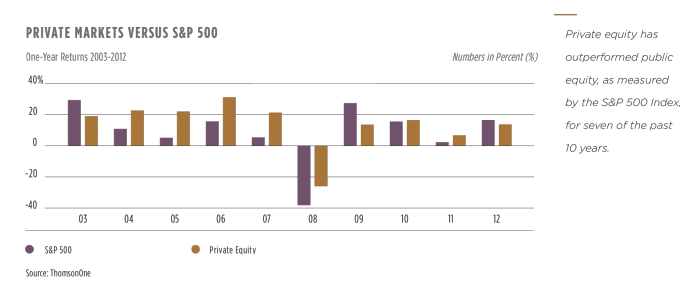
Public equity market returns have been good in recent years. Why tie up money in private equity?
Reality:
No one believes that public equity returns will deliver consistently high returns. In fact, in seven of the 10 years from 2003–2012, one-year public equity returns trailed those of private equity, according to data from ThomsonOne. The key is to look at performance over the long term.
Private equity has been the subject of serious academic research and it all points in the same direction: There is a return premium associated with a thoughtfully constructed private equity portfolio. One major study—“Private Equity Performance: What Do We Know?”—has been published by Professor Steve Kaplan of the University of Chicago. His findings, based on several years of research, show that investors have realized incremental returns from private equity relative to the S&P 500. Focusing on leveraged buyouts and growth equity, Prof. Kaplan looked at the approximately 600 funds formed between 1984 and 2008 in the Burgiss private equity database. He found an average public market equivalent (PME) of about 1.2, indicating that these funds have outperformed the S&P 500 on average by 20 percent over the life of a fund. (The PME, developed by Prof. Kaplan with Antoinette Schoar of MIT, calculates a market-adjusted multiple that allows comparison of private investments to a public market index.)
Prof. Kaplan also found that for leveraged buyouts and growth equity, the median fund beat the S&P 500 by 10 percent over its life, or by roughly 3 percent per year. Funds in each of the top three quartiles actually outperformed the S&P 500 on average. Only bottom quartile funds failed to beat the public markets.
Additional studies undertaken by academicians and industry sources have found a long-term return premium averaging about 300 basis points annually over the S&P 500. One study, by Rüdiger Stucke and Chris Higson of Oxford University and London Business School, respectively, utilized the most comprehensive private equity data set ever assembled. The authors concluded that private equity outperformed public markets by 500 basis points a year over the period from 1980 through 2008.
Another point: The vast majority of companies are private, not public; ignoring private companies eliminates an enormous share of the economy from one’s portfolio. There are over 175,000 private companies in the U.S. alone with annual revenues of $10 million to $100 million, comprising a deep and rich universe of attractive targets for private equity investors. Private equity is one of the few strategies that employs active ownership, in which managers provide deep operational experience, sit on boards, add value in a hands-on manner, build management teams and invest strategically with a long-term horizon.
There is also the matter of track record. Recently, the robust public equity markets have generally outperformed private equity. For the 12 months ended September 30, 2013, the S&P 500 Index returned 19.0 percent. Private equity, based on Burgiss Private Equity data, trailed at 17.4 percent—still, a very sound return. But, for the trailing 10 years—the period that matters most to institutional investors—data from the Burgiss Private Equity index show an average annual return of 9.6 percent, 161 basis points per year ahead of the 8.0 percent average annual return of the S&P 500 Index.
Perception:
Valuations are high, likely depressing future returns.
Reality:
Investing in private equity is not a binary decision, i.e., all-in or all-out. Depending on many factors—including their view of the private equity environment—investors may increase or decrease the size of new commitments, but they should not opt out and stay entirely on the sidelines. It is hard to be tactical in private equity, and attempts to time this strategy—even more so than the public equity market—almost never meet with success.
It should also be noted that private equity funds raised in 2000, when the public markets were at their peak, turned out to be strong performers. Conversely, funds raised in 2005–2007, when equity markets were buoyant, have thus far produced more modest results (although they have not yet fully matured). The fact of the matter is that there are good managers even in poor vintage years (and vice versa), as might be expected in an asset class where the differential between upper and lower quartile performance is generally at least 1,000 basis points (or 10 percent).
Perception:
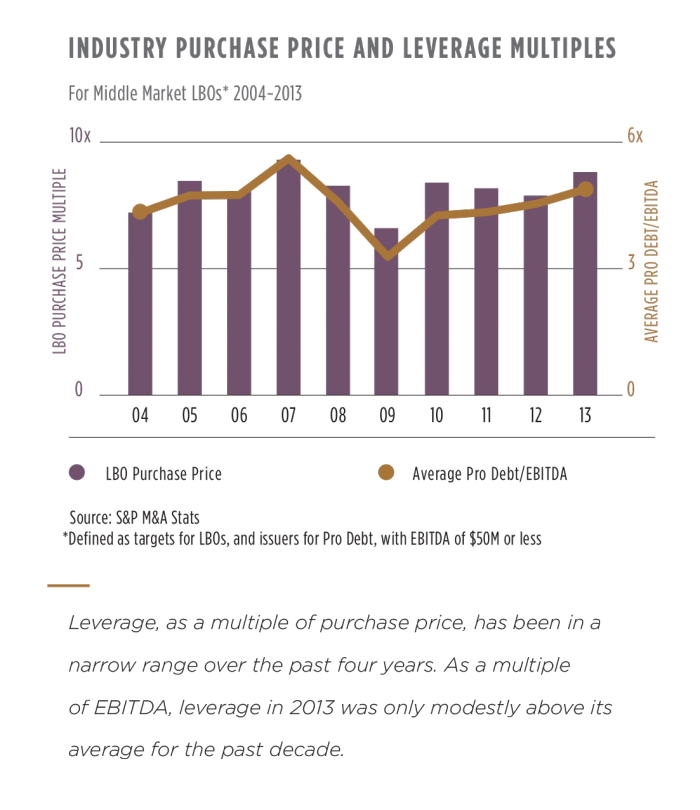
Use of leverage is rising, increasing risk and elevating valuations.
Reality:
As the chart above shows, the use of leverage, as a multiple of purchase price, has been relatively steady in a range of 4.25x to 4.88x over the past four years. This is below the peak in 2007. In addition, as a multiple of EBITDA, purchase prices remain reasonable, averaging 8.82x over 2013 versus an average of 8.12x over the decade.
Perception:
Too much money has been raised in recent years, making it difficult to invest in a disciplined manner.
Reality:
In our experience, top-tier managers generally have a keener sense of appropriate valuation levels, particularly as they pertain to future growth prospects and opportunities.
This skill allows them to be discerning, even in more robust pricing environments. Yes, valuations cycle up and down. Yet, through various market cycles, we have consistently found better growth-adjusted valuations by focusing on growth equity and small/middle market buyouts. We note that some private equity managers are choosing to specialize in technology, telecom, healthcare and consumer/retail, calling on their deep knowledge of certain industries to add value.
There are additional ways for investors to add value beyond traditional investment in private equity managers’ funds. One is secondary investments—opportunistically buying an existing limited partnership interest in a fund, usually at a discount to net asset value—and another is co-investment, which involves making a direct investment in selected portfolio companies alongside a private equity manager.
Perception:
Concerns about liquidity should make investors reluctant to commit funds for 10 years.
Reality:
Perpetual pools can afford illiquidity when most spend in the range of 5 percent annually; and an allocation to private equity is only a small fractional part of an overall portfolio, leaving ample liquidity to meet operating and liability matching needs.
Investors may want to bear in mind, as well, that committing to a private equity fund in year number one will not likely see their capital calls peak for another three or four years.
Finally, ample evidence points to a return premium attached to illiquidity. Based on 10-year annualized return data from the NACUBO-Commonfund Study of Endowments® (NCSE), there is a strong correlation between illiquidity and return. The time-weighted return as calculated for private equity was 8.4 percent per year over the 10 years ended June 30, 2012, versus 5.3 percent for the S&P 500 over the same period. This is consistent with the 3 percent-plus per year illiquidity premium outlined in the Kaplan study. The larger universities participating in the Study (those with assets over $1 billion) have a much higher allocation to private equity than the smaller institutions and, presumably, more mature programs. These institutions actually did much better than the average (11.1 percent versus the 8.4 percent). This higher performance level is consistent with the experience of our Commonfund Capital private equity net return over the same 10-year period, which was 11.3 percent on a dollar-weighted basis. Takeaway: Illiquidity can pay off for investors with patience, dedication and a long-term strategy for success in private equity.
Perception:
Our institution is ready for direct investment in private equity.
Reality:
Direct investment not only requires in-depth resources, but also several years to get to know a sufficient number of managers well, in addition to the track record, strategy, process and personnel of such managers. Manager access is another key point. As mentioned, access before allocation is critical, meaning that if an institution can only invest with an available median or lower quartile manager, an allocation to private equity may not make sense.
The allocation battle for top managers can be fierce. Even if an institution is able to access top quartile managers, keep in mind that these firms spread their allocations among a select group of investors, which generally does not grow significantly especially after a manager has achieved success. Your organization may be at the end of the queue and not gain a meaningful allocation—or none at all and have to settle for a lesser quality available manager.
Continental drift: the private/public reality gap in Europe.
Perception: Europe continues to be restrained by a sluggish economy, high unemployment and debt levels, and concerns about banks’ balance sheets. The recovery that took hold in the second half of 2013 remains fragile, and recent geopolitical tensions overlay another unknown.
While concerns such as these may give pause to public market investors, reality in the European private equity market is vastly different. Investors may want to consider the private equity perspective on Europe:
- The region is far less homogenous than the U.S. Countries are separated by language, culture, history and traditions, and business practices. Thus, generalizations about prospects for investing in Europe are inherently flawed. There are actually many Europes and each must be assessed independently.
- To that point, opportunities have varied widely. For example, the Nordic region has been the source of attractive private equity transactions—the southern tier countries of Spain, Portugal and Italy much less so recently, except for distressed opportunities. Attractive opportunities also exist among the “export champions,” which include the Nordic countries, Germany and the U.K.
- That said, growth is returning to many of the most severely impacted economies, including Spain, Portugal and Ireland. Structural reforms have been put in place to heighten competitiveness and grow private sector employment. At the same time, many European businesses are taking steps to improve their balance sheets and focus on strategic opportunities.
- In the European business landscape or hierarchy, there are many large, publicly owned companies at the top; actually, more than 30 percent of the Fortune Global 500 are headquartered in Europe. At the base are a great many small and mid-sized private companies—many more than are found in the U.S.—and they tend to be fractured by geography. Often, German companies and entrepreneurs want to deal with German owners or potential owners, French with French and so forth. The only way to navigate through these preferences is to have local, indigenous managers who understand local customs on the ground across Europe.
- Private companies are growing much faster than the economies of which they are a part. Further, small companies generally are more attractively priced than larger ones, making it easier to be a value buyer.
- Many European businesses realize that to grow and prosper, they need to export beyond the Euro zone, and many are aware that they need the expertise of a private equity investor to capitalize on their full potential. Private equity is attractive as well because entrepreneurs and family-owned businesses often don’t want to sell to a competitor.
- Commonfund Capital focuses on the middle market, defined as transactions with an enterprise value of e150 million to e600 million. We believe this is the least efficient segment of the European private equity market and also exhibits the most consistent deal flow. In terms of overall size, middle market companies account for one-third of GDP in Germany, France, Italy and the U.K.
A look at companies that are currently in the portfolios of European private equity managers demonstrates the breadth and variety of opportunities in a wide variety of situations:
Outsourcing: A U.K. company manages street lights for municipalities, replacing traditional luminaires with energy-efficient, advanced light-emitting diode (LED) lighting systems. The company’s tech-enabled business model employs software for further efficiencies.
Turnaround: A leading French skiing equipment manufacturer with a global brand saw a massive decline in value under a financial buyer who neglected the brand. It is now being turned around by the same private equity manager that revived Helly Hansen, the Norwegian outdoor apparel maker, and produced a high single-digit cash-on-cash return for investors.
Distressed: A widely recognized Swedish investment bank is being refocused and broadened by a private equity manager, which, in the middle of the downturn, selectively bought the most attractive parts of the bank. The business has returned to growth as the European economy recovers.
Southern tier: Even in Italy and Spain (among the so-called “southern tier” economies) there are opportunities on a selective basis. In Spain, a mortgage service provider helped banks manage and value their properties. Now a portfolio company for a private equity manager, the company is thriving as the economic cycle turns.
Family-owned business: A German manufacturer of quality couches and upholstered furniture sells its product under different brand names throughout Europe. The company’s elderly owners did not have successors and decided to sell to a private equity manager for an attractive value-oriented purchase price multiple. Among the manager’s early moves is product line enhancement and expanded distribution.
- Burgiss is a portfolio management software company that keeps records on about $1 trillion in limited partner (LP) investments in leveraged buyout, growth equity, venture capital and other alternative strategies. Because the data come directly from LPs, the database is accurate, timely and relatively free of selection bias.