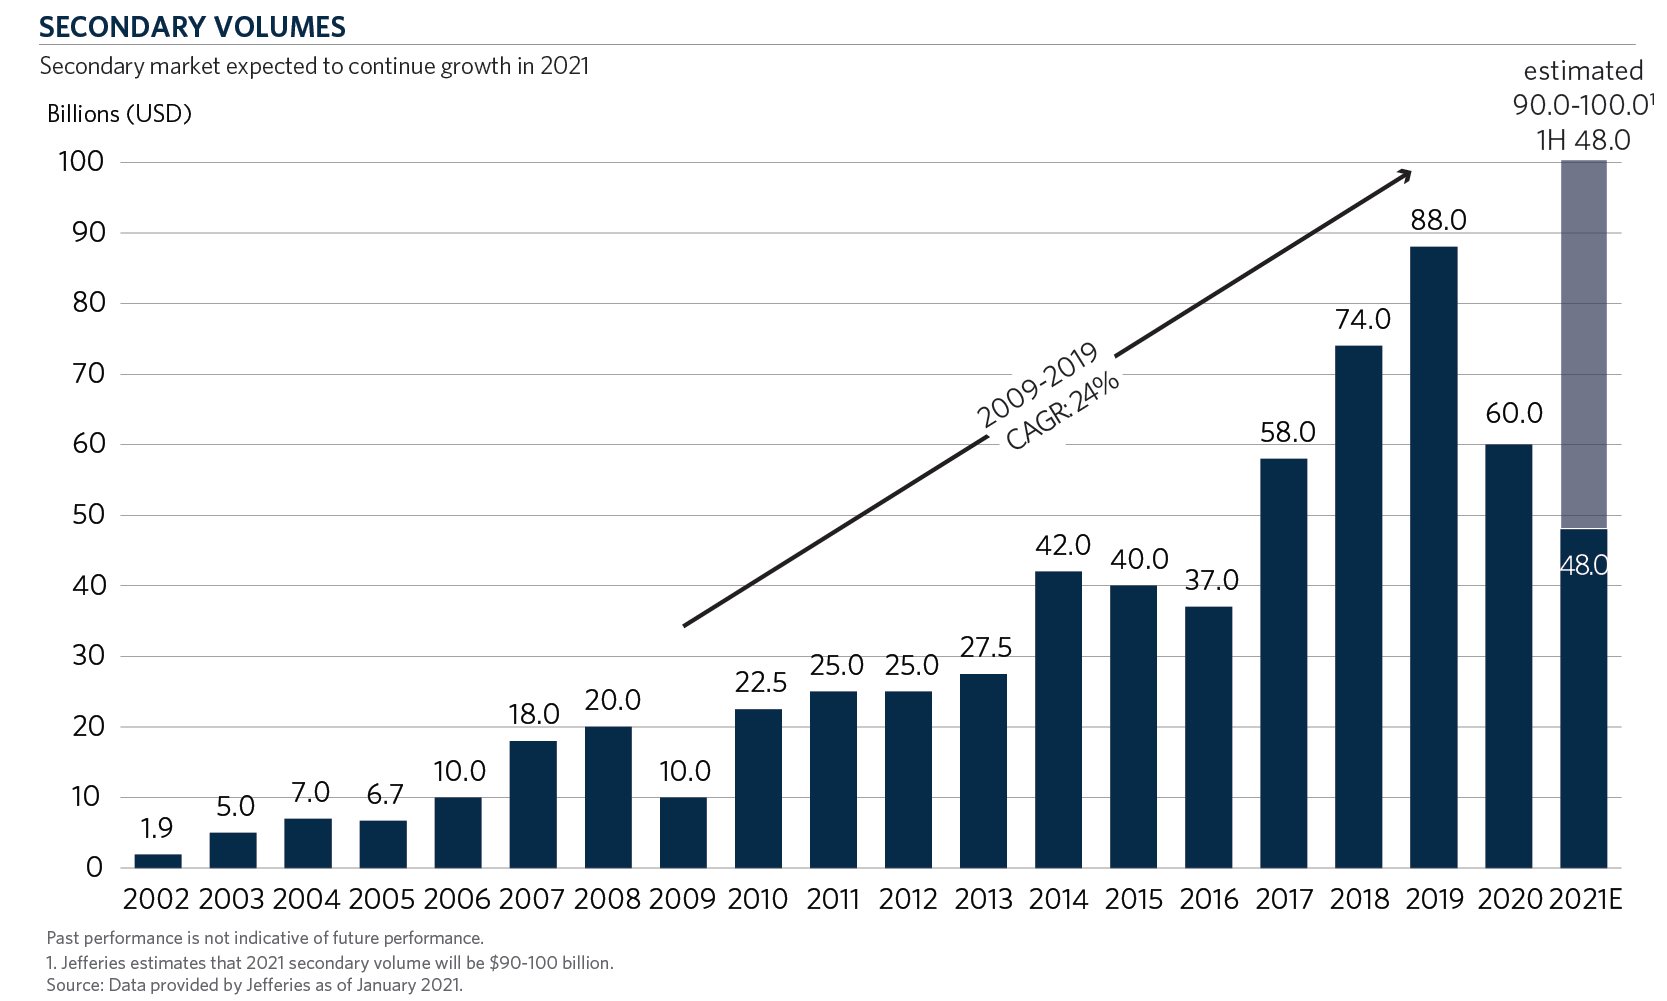
What was once a nascent market, Secondaries has become both an innovative tool for general partners to hold onto their best assets, “Crown Jewels”, and a provider of liquidity to a formerly illiquid asset class. In the last twenty years, the market has grown from less than $2 billion to a potential record year in 2021 of over $100 billion. The secondary market’s future is bright, and many predict the market to reach $250 billion and beyond in the next five years.
Secondary supply outpaces the capital and resources available to complete all the secondary transactions in the market. Some have declared 2021 “a buyers’ market” where only the highest quality transactions are completed. Innovation and acceptance are driving today’s record volumes.
Market Volume
Secondary transaction volume in the first half of 2021 increased to $48 billion compared to the first half of 2020 volume of $18 billion. Fifty-seven percent of that 2021 volume was from the General Partner (GP)-led market1. Year-end estimates are on track for $100 billion+ with an increase in the amount of limited partnership portfolios trading in the second half of the year. An estimated $80-85 billion of transaction volume has closed through the nine months ended September 30, 20212.
Single Asset and Multi-Asset GP-Led Transactions
GP-led transactions are initiated and structured by the General Partners of funds. Typically, a GP-led transaction involves a continuation vehicle for one or more assets from a prior fund managed by the general partner. Existing Limited Partners or the Fund are able to sell into this new vehicle with a new group of limited partners that often involve a lead buyer(s), the general partner rolling carry and commitment, new limited partners, and rolling existing limited partners. There are new terms (management fee, carry, duration) in the continuation vehicle and the potential for additional unfunded capital.
In 2020, there were over 100 GP-led transactions1. Buyers’ enthusiasm for these types of transactions will lead 2021 to surpass 2020. Through the nine months ended September 30, 2021, at least 80 GP-led deals have closed for over $50 billion2. According to PJT Park Hill, there are over 80 other live transactions in the market with an estimated transaction value of at least $70 billion (not all of which will close by year-end), and the number of new deals will continue to increase through the rest of the year2.
The single asset GP-led transaction has the potential to replace the sponsor-to-sponsor transaction. After all, why would a General Partner want to sell its best assets to a competitor instead of keeping those assets within its limited partner base? In 2020, 614 financial sponsor-to- financial sponsor transactions closed for $183.9 billion3. The potential supply to the secondary market from these single asset transactions is substantial.
General Partners, who once were less enthusiastic about secondary transactions in their funds, can now utilize the secondary market to hold onto their best assets and to alleviate the constraint of fixed fund lives. General Partners are also able to provide interim liquidity options to their limited partners. All of which increase the appeal of these transactions and the overall private capital market.
Investors benefit from these investments because General Partners no longer have the due diligence risk of a first-time investment. The General Partners know the management teams and the assets well and have a concrete plan on how to execute to get to their targeted returns, often in a shorter time frame. General Partners have also been rolling their carry and investing alongside these deals, providing strong alignment. Concentration issues are often resolved by having a large syndication of these transactions, allowing secondary buyers to maintain their preferred concentration limits of 1-4 percent in any given asset. However, some of the largest transactions are still difficult to complete because of concentration constraints.
With so much supply, the market can be seen to favor buyers. As was noted by Secondaries Investor in an article on October 29, 2021, “In the GP-led market, capital constraints remain. On a daily basis, buyers and advisers bemoan the fact that all the concentrated deals that could get done will not.” The potential deal flow from single-asset transactions is enormous.
Limited Partnership and Portfolio Interests
The sale of limited partnership interests remains core to the secondary market. Limited partnership interests and portfolios drive the key outcomes that secondary investors look to achieve—strong risk-adjusted returns, shorter hold periods, mitigation of the j-curve, diversification, and consistent cash flows. While the flow of limited partnership interests wanes in periods of dislocation when the bid-ask spreads become too wide, these types of sales rebound quickly.
The second half of 2021 has seen a large number of portfolios in the market. Secondary funds and fund-of-funds have continued to sell to wind down their vehicles and to alleviate administrative burdens. Institutions have managed their portfolios by selling non-core investments or tail-end assets where fatigue has set in. Investors have sold younger assets with the hopes of reallocating capital in newer managers. With the appreciation in venture and private equity assets, some have sold to manage their overall allocation to private capital.
Record fundraising and the continued aging of investments will drive limited partnership sales in the future. $2.8 trillion has been raised for private capital in the last five years4. $4.4 trillion was raised from 2009-20165. There is over $500 billion of assets in funds that are 10 years old or older5.
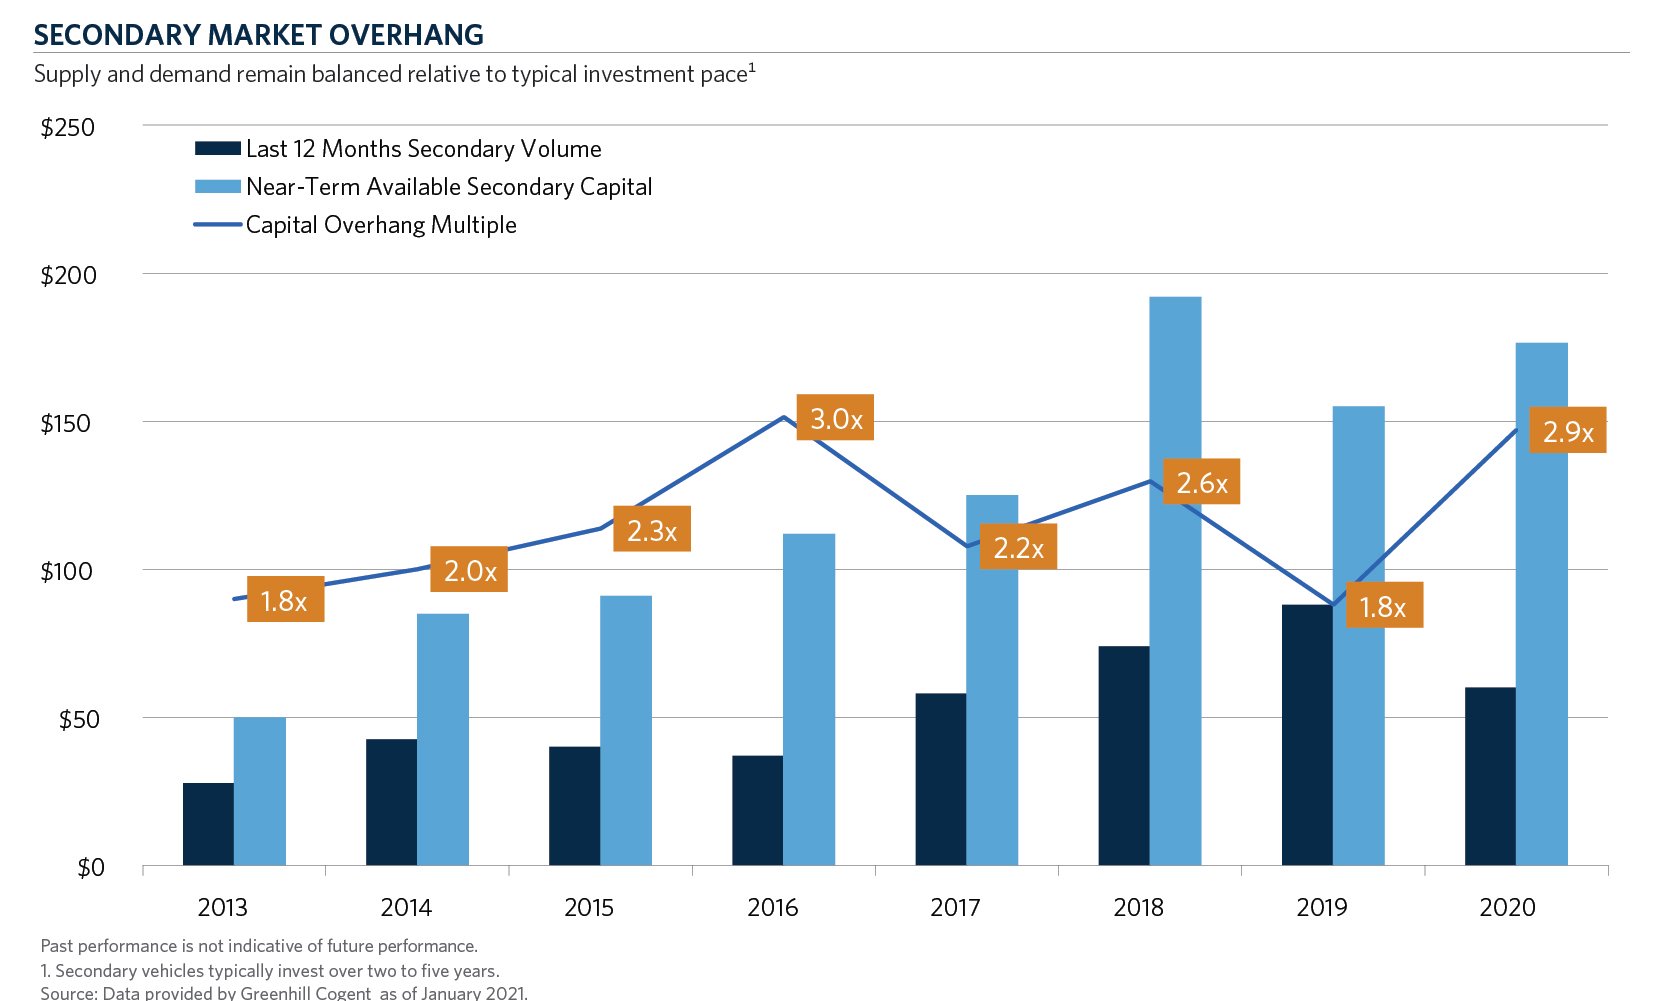
Overhang
While headlines note the increasing size of secondaries funds, there are still relatively few dedicated investors in the market. If one looks at the secondary overhang ratios compared to the broader private capital market, they are quite favorable to secondary investors.
The capital overhang in the secondary market was 2.3x for the first half of 2021. In 2019, the capital overhang ratio was 1.8x. All the capital that has been raised in the secondary market could be invested in just over two years.
Conclusion
For a secondary investor, the evolution of GP-led transactions has enabled secondary funds not only to benefit from the potential of early distributions, high IRRs, and capital efficiency but also high ROIs. The growth of the GP-led portion of the market has added to the already tremendous overall growth of the market. Yet, despite all the momentum in the secondary market, it is still a small and inefficient market relative to the overall private capital market. There are over $7.5 trillion in assets under management in the private capital market. $100 billion, a record year of secondary volume, would still account for less than 1.5 percent of the overall market.
Secondaries have proven resilient over market cycles. Today, the opportunity in the secondary market have never been greater. Pricing is often difficult to evaluate since sellers utilize varying report dates that often lag current valuations and market conditions. We are seeing a wide range of pricing, from premiums to large discounts. With the significant supply in the market, we would normally expect pricing to be driven down. At the end of 2021, one may look back and note that the secondaries market was a buyers’ market. We believe those invested in secondaries funds or with dedicated teams able to sift through the large amounts of transactions to find the best opportunities and angles into the market will likely see attractive risk-adjusted returns.
- Greenhill Global Secondary Market Review, September 2021
- PJT Park Hill Database
- Pitchbook US PE Q3’21 Report
- Private Equity International Q32021 Fundraising Report
- Jefferies as of February 2021