Key Governance Factors for Higher Education Prove to Be Quantifiable

August 10, 2022 |
3 minute read
|

A board self-assessment is one of the most commonly used tools to evaluate how effectively a board performs. The purpose of a board self-assessment is to help board members analyze their present and future responsibilities and capabilities to bring awareness to their strengths and weaknesses.

However, a board self-assessment tool is not simply for awareness or to stay on track; it can serve as a gateway to dialogue on how improved governance practice better serves the institution and its mission. With this in mind, in 2021 Commonfund and Fund Governance Analytics (FGA), an ESG and analytics research firm, launched a study to quantify the governance practices of higher education institutions - and effectively measure varying metrics to assess board effectiveness.

The 2021 Commonfund-FGA Study of Governance in Higher Education (CFSG) analyzed governance practices among 34 participating higher education institutions with endowments ranging in size from $8.5 million to $3.5 billion. The Study probed 27 governance topics that, when analyzed, enhance the understanding of governance and serve as a guide to best practices that can be benchmarked by how Study participants perform.

The CFSG was based on earlier research conducted on public pension funds over a five-year period (2008 to 2012) by Dr. Christopher K. Merker and FGA, which found that governance can, in fact, be quantified. The original pensions Study utilized a proprietary methodology, the Fiduciary Effectiveness Quotient (FEQ), that showed a robust statistical correlation between pension funds and their governance practices. It provided a way for institutions to score and measure their governance practices and identify key areas for consideration and improvement, with the added opportunity for peer benchmark comparisons—something that had never been done before.

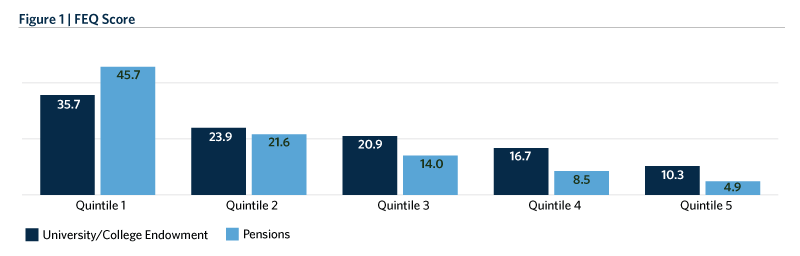
Figure 1 shows Study data from the higher education study segmented into quintiles ranked by total FEQ score (the first quintile being the highest scores) and compares the findings to the pension universe, which is comprised of the original study’s public pensions plan participants. This composite rating system is a measure of overall board effectiveness. A higher FEQ score is indicative of stronger governance structures within the organization, as well as greater overall fiduciary effectiveness. Generally, a good score would be 20 or more; a very good score would be 25 or more. The median score for all 34 participants in this year’s Study was 21.32. The high score in study was 44.42 and the low was 3.05.

img-chart-Key-Governance-Factors-Prove

Governance is of ongoing interest to colleges and universities, as well as other nonprofit organizations, but studies of the subject have largely relied on survey responses on topics deemed important by the researcher, a method without an empirical basis. The CFSG is a data-driven Study that shows that the structure, process and engagement of boards are critical factors that can more than likely help an institution achieve better governance, which ultimately trickles down to other areas of the institution. There are potential benefits associated with a system or index that measures governance effectiveness, including stakeholder, donor, media, and public confidence that an institution is well-governed.

Among the wide range of data points gathered by the Study are the following (which also typify the types of questions asked):

  • More than half of Study participants conduct board self-assessments annually.
  • All top quintile institutions have an investment policy statement (IPS).
  • Most participants—nearly 70 percent—said that between 25 and 50 percent of their boards are women; more than 50 percent said that minorities represent 10 to 25 percent of their boards.
  • About one-third of institutions in the top quintile reported that more than half of their boards have backgrounds in accounting and/or investments.

In terms of FEQ results, top quintile performers tend to have boards that meet more frequently than average during the year and usually have more substantive discussions of investment issues as documented in meeting minutes. Top performers also tend to have smaller than average boards as compared to other higher education institutions, a finding that is consistent across corporate governance literature. Top-performing boards often have a higher percentage of staff as members, even if they are in a non-voting role.

In the original pension study, there was a strong statistical correlation between FEQ scores and investment performance. A relatively weaker correlation between FEQ scores and returns was evidenced in the higher education study. We will continue to collect more data to determine if there is a similar correlation between higher education FEQ scores and relative investment performance.

The Study was sponsored by Commonfund Institute. Dr. Merker, who led the Study, is an adjunct professor at Marquette University and co-author of The Trustee Governance Guide: The Five Imperatives of 21st Century Investing. Dr. Merker and his team conducted the study of public pension systems as well. Commonfund and FGA plan to continue work to uncover additional trends in governance metrics for higher education endowments. A larger sample size will mitigate any self-selection bias present in this initial survey.

New call-to-action

Commonfund Institute

Author

Commonfund Institute

Disclaimer

Certain information contained herein has been obtained from or is based on third-party sources and, although believed to be reliable, has not been independently verified. Such information is as of the date indicated, if indicated, may not be complete, is subject to change and has not necessarily been updated. No representation or warranty, express or implied, is or will be given by The Common Fund for Nonprofit Organizations, any of its affiliates or any of its or their affiliates, trustees, directors, officers, employees or advisers (collectively referred to herein as “Commonfund”) or any other person as to the accuracy or completeness of the information in any third-party materials. Accordingly, Commonfund shall not be liable for any direct, indirect or consequential loss or damage suffered by any person as a result of relying on any statement in, or omission from, such third-party materials, and any such liability is expressly disclaimed.

All rights to the trademarks, copyrights, logos and other intellectual property listed herein belong to their respective owners and the use of such logos hereof does not imply an affiliation with, or endorsement by, the owners of such trademarks, copyrights, logos and other intellectual property.

To the extent views presented forecast market activity, they may be based on many factors in addition to those explicitly stated herein. Forecasts of experts inevitably differ. Views attributed to third-parties are presented to demonstrate the existence of points of view, not as a basis for recommendations or as investment advice. Market and investment views of third-parties presented herein do not necessarily reflect the views of Commonfund, any manager retained by Commonfund to manage any investments for Commonfund (each, a “Manager”) or any fund managed by any Commonfund entity (each, a “Fund”). Accordingly, the views presented herein may not be relied upon as an indication of trading intent on behalf of Commonfund, any Manager or any Fund.

Statements concerning Commonfund’s views of possible future outcomes in any investment asset class or market, or of possible future economic developments, are not intended, and should not be construed, as forecasts or predictions of the future investment performance of any Fund. Such statements are also not intended as recommendations by any Commonfund entity or any Commonfund employee to the recipient of the presentation. It is Commonfund’s policy that investment recommendations to its clients must be based on the investment objectives and risk tolerances of each individual client. All market outlook and similar statements are based upon information reasonably available as of the date of this presentation (unless an earlier date is stated with regard to particular information), and reasonably believed to be accurate by Commonfund. Commonfund disclaims any responsibility to provide the recipient of this presentation with updated or corrected information or statements. Past performance is not indicative of future results. For more information please refer to Important Disclosures.

Stay connected with the Insights Blog

Popular Blog Posts


Market Commentary | Insights Blog

Chart of the Month | U.S. Budget Deficit Hits Record Highs

In his first 100 days as President of the United States, Joe Biden has introduced three domestic funding proposals, totaling close to $6.0 Trillion, reflecting a desire to enhance the role of the...
Perspectives | Insights Blog

The Case for Using the Higher Education Price Index® (HEPI) to Define Inflation for Colleges

When calculating return targets for an endowment portfolio, a conventional piece of the equation is often the Consumer Price Index (CPI). CPI plus 5% is the common short-hand formula for institutions...
Market Commentary | Insights Blog

Chart of the Month | The Surprising Relationship Between Money Supply and Inflation

The potential for rising inflation is becoming a top concern for many investors and consumers. Many believe that inflation is already here as evidenced by price increases in commodities, homes,...

Disclaimer

Certain information contained herein has been obtained from or is based on third-party sources and, although believed to be reliable, has not been independently verified. Such information is as of the date indicated, if indicated, may not be complete, is subject to change and has not necessarily been updated. No representation or warranty, express or implied, is or will be given by The Common Fund for Nonprofit Organizations, any of its affiliates or any of its or their affiliates, trustees, directors, officers, employees or advisers (collectively referred to herein as “Commonfund”) or any other person as to the accuracy or completeness of the information in any third-party materials. Accordingly, Commonfund shall not be liable for any direct, indirect or consequential loss or damage suffered by any person as a result of relying on any statement in, or omission from, such third-party materials, and any such liability is expressly disclaimed.

All rights to the trademarks, copyrights, logos and other intellectual property listed herein belong to their respective owners and the use of such logos hereof does not imply an affiliation with, or endorsement by, the owners of such trademarks, copyrights, logos and other intellectual property.

To the extent views presented forecast market activity, they may be based on many factors in addition to those explicitly stated herein. Forecasts of experts inevitably differ. Views attributed to third-parties are presented to demonstrate the existence of points of view, not as a basis for recommendations or as investment advice. Market and investment views of third-parties presented herein do not necessarily reflect the views of Commonfund, any manager retained by Commonfund to manage any investments for Commonfund (each, a “Manager”) or any fund managed by any Commonfund entity (each, a “Fund”). Accordingly, the views presented herein may not be relied upon as an indication of trading intent on behalf of Commonfund, any Manager or any Fund.

Statements concerning Commonfund’s views of possible future outcomes in any investment asset class or market, or of possible future economic developments, are not intended, and should not be construed, as forecasts or predictions of the future investment performance of any Fund. Such statements are also not intended as recommendations by any Commonfund entity or any Commonfund employee to the recipient of the presentation. It is Commonfund’s policy that investment recommendations to its clients must be based on the investment objectives and risk tolerances of each individual client. All market outlook and similar statements are based upon information reasonably available as of the date of this presentation (unless an earlier date is stated with regard to particular information), and reasonably believed to be accurate by Commonfund. Commonfund disclaims any responsibility to provide the recipient of this presentation with updated or corrected information or statements. Past performance is not indicative of future results. For more information please refer to Important Disclosures.