Viewpoint | Analyzing Community Foundation Data by Region

November 7, 2023 |
2 minute read
|

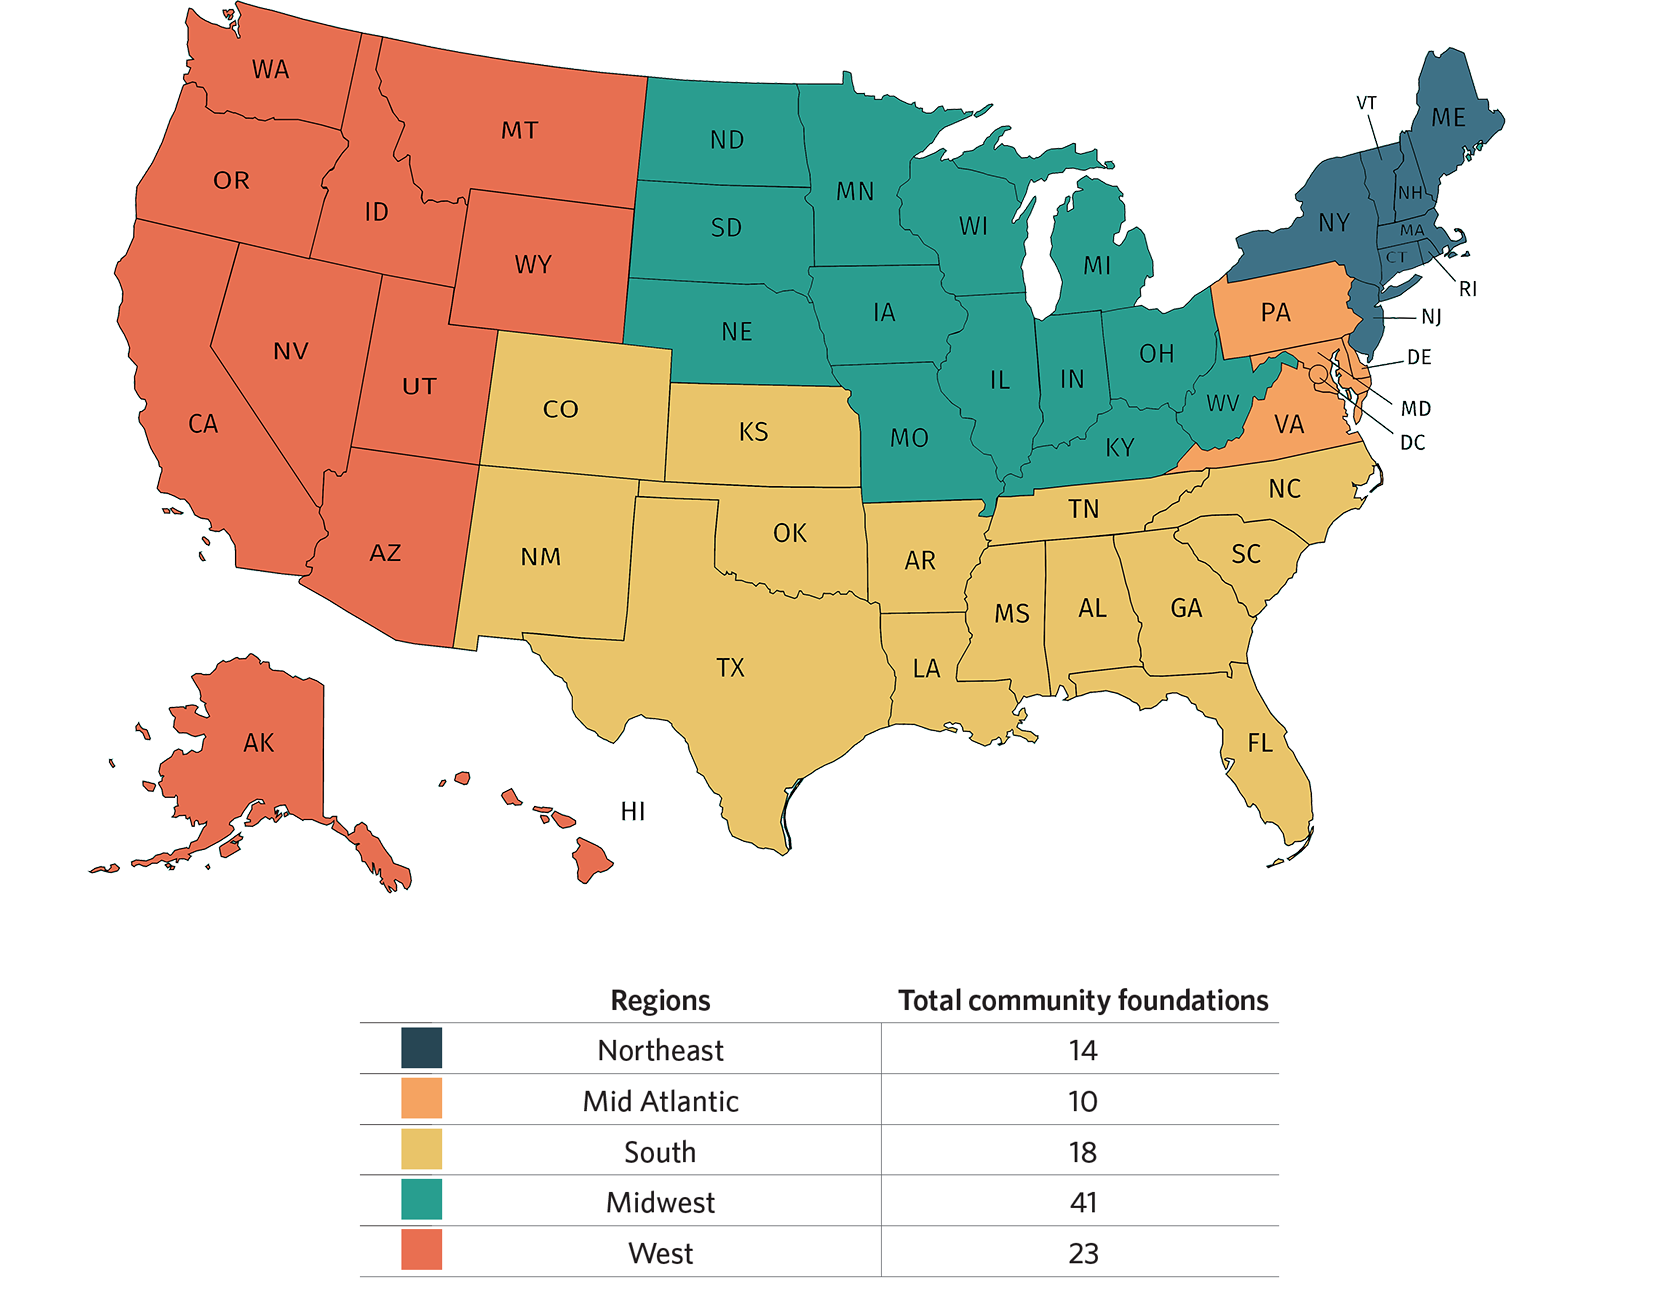
For the 2022 Council on Foundations - Commonfund Study of Foundations, we provided an analysis of community foundation data by five geographic regions. Community foundations lend themselves to this type of analysis, as they are more regionally focused than private foundations. They seek to act as agents of positive change by making grants within local, state or regional boundaries and typically have community representatives on their boards.

 CCSF Regional Map

Regional Net Returns Reflect Larger Study

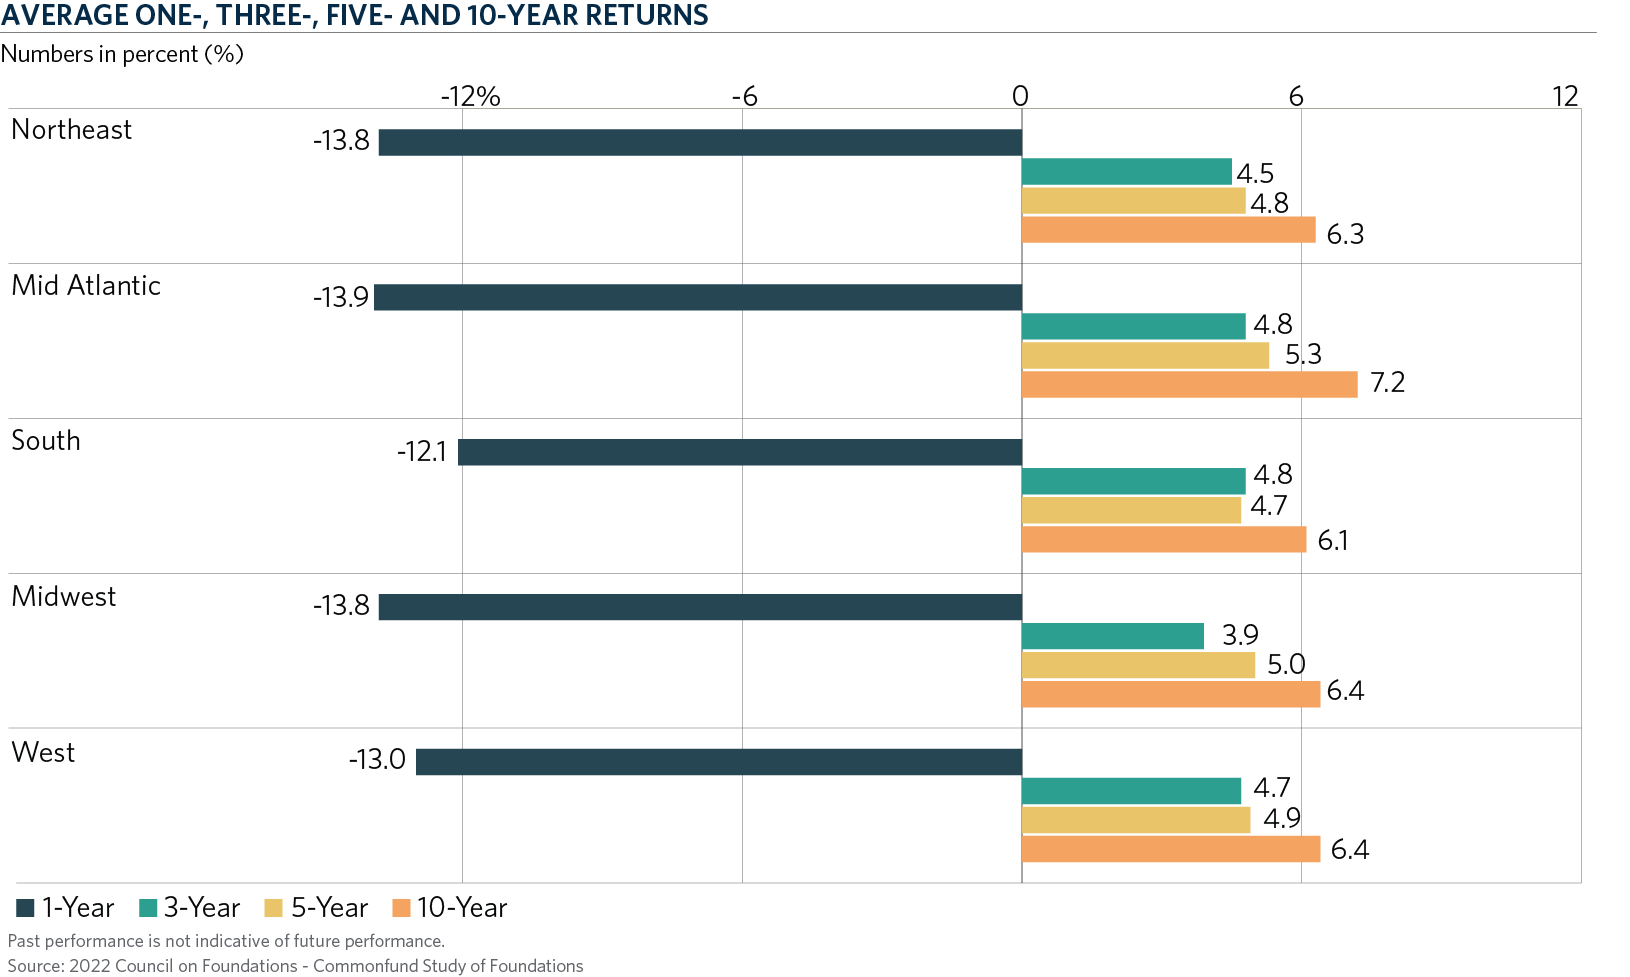
Like participating community foundations overall, 2022 community foundation returns were negative across regions. The best relative return was -12.1 percent for community foundations in the South. This region lagged in terms of 10-year returns, as Mid Atlantic community foundations led the way with a return of 7.2 percent. Community foundations in these two regions reported the highest three-year return, 4.8 percent, while Mid Atlantic foundations’ 5.3 percent return was the highest for the five-year period.

CH1-Performance_2020 Web Chart

Asset Allocations Show Variability

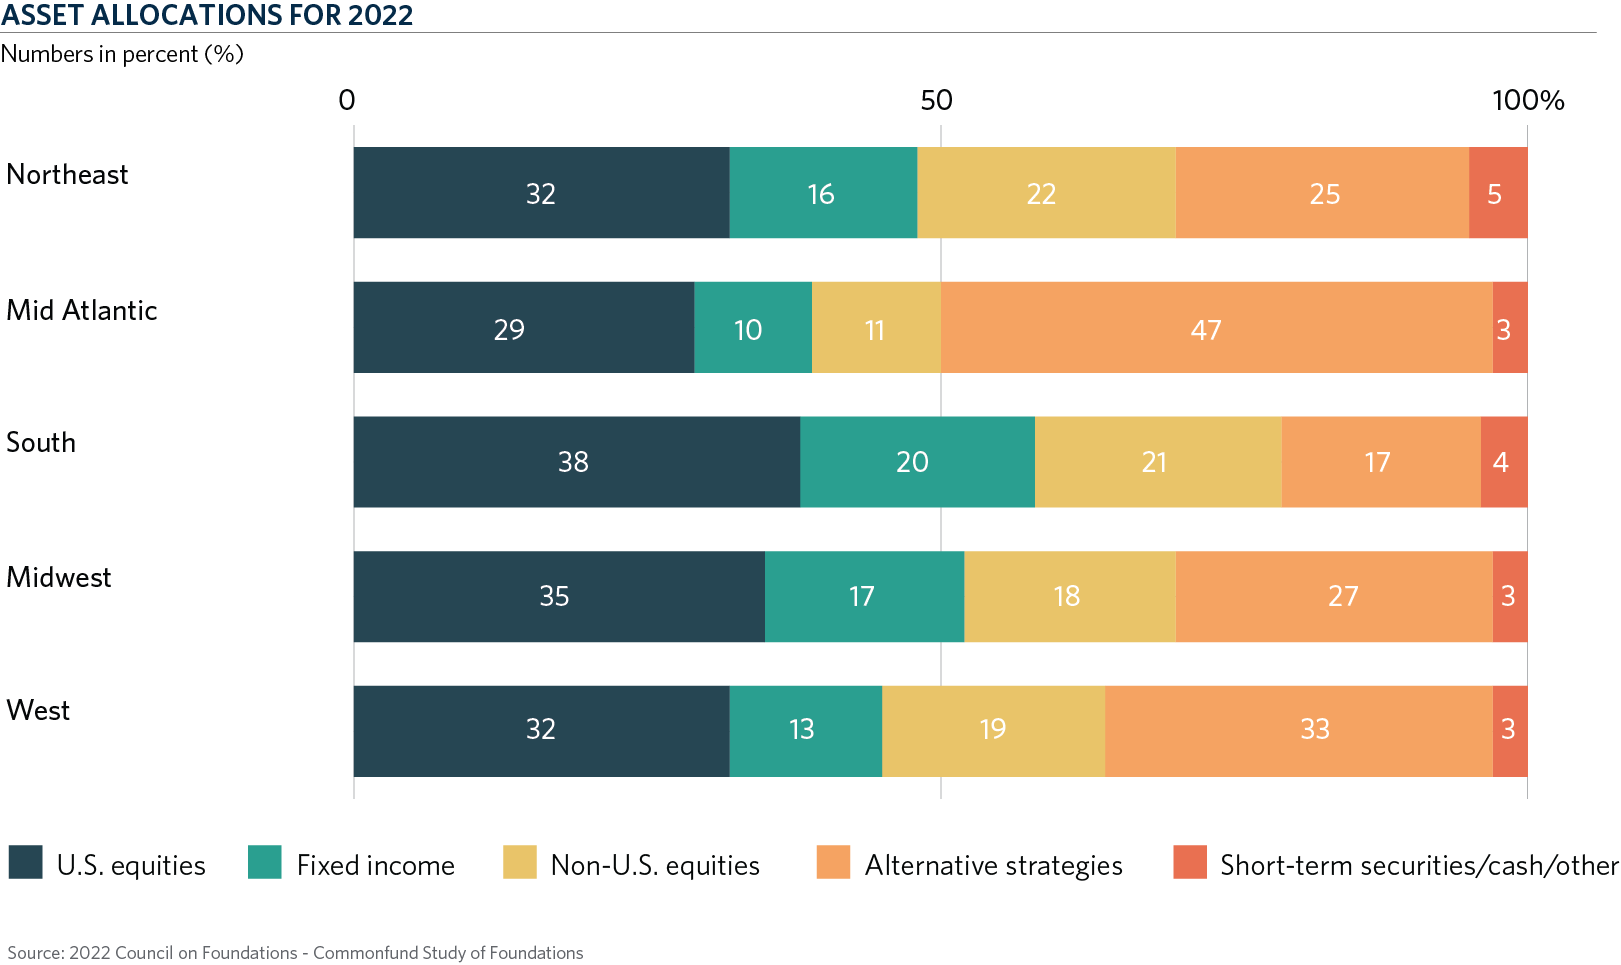
Across regions, community foundation data showed significant variation. Alternative strategy allocations, for example, varied from 17 percent (South) to 47 percent (Mid Atlantic). Northeast foundations reported a 22 percent allocation to non-U.S. equities, twice that of Mid Atlantic foundations. Even in fixed income, a traditional asset class, the highest allocation was 20 percent (South) and the lowest was 10 percent (Mid Atlantic). Allocations to U.S. equities were more level, ranging from the South’s 38 percent to 29 percent among Mid Atlantic foundations. Community foundations in the West and Northeast allocated 32 percent each to U.S. equities, while in the Midwest the allocation averaged 35 percent. 

CH2-AssetAllocation

Average Stated Spending Policies in 4% Range

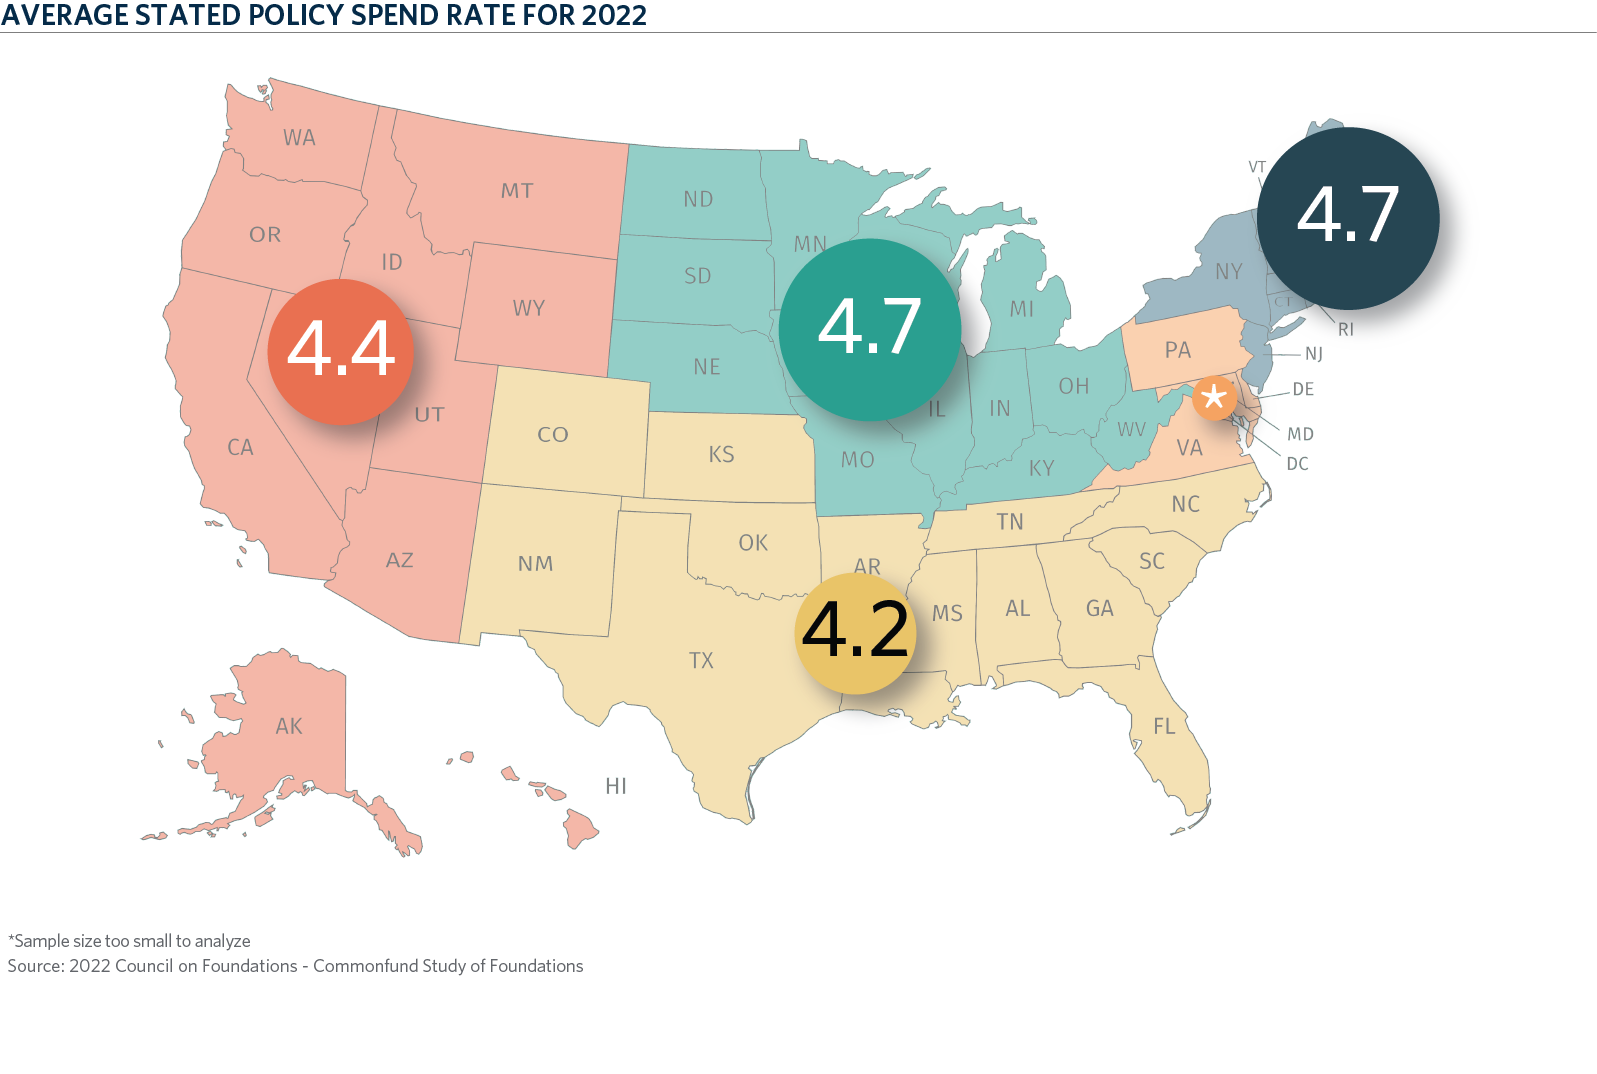
Community foundations in the Midwest and Northeast reported the highest stated spending policy rate at 4.7 percent. The average stated spending policy rate in the West was 4.4 percent, while in the South it was 4.2 percent. (The Mid Atlantic sample was too small to analyze.) Ninety percent to 100 percent of all community foundations reported having a spending policy.

CH1-StatedPolicySpend

Moving Average Most Frequently Used Methodology

Across regions, community foundations overwhelmingly use the percentage of a moving average value as their spending methodology. Foundations in three regions reported using this method in the 80 percent range while two were in the mid-60 percent range. The average spending rate went from 4.2 percent in the South to 4.8 percent in the Mid Atlantic. Only community foundations in the Midwest said their policy was to meet the IRS minimum spending rate of 5 percent. Foundations in the Mid Atlantic most frequently employed the approach of spending a pre-specified percentage of market value, at 20 percent. The Yale/Stanford rule (hybrid method) was used only by foundations in the West and Northeast.


Interested in learning more about the findings of the latest Study of Foundations? Request your copy today.

New call-to-action

Commonfund partners with the Council on Foundations to create the Council on Foundations—Commonfund Study of Investment of Endowments for Private and Community Foundations® (CCSF). The CCSF annual report studies, on average, over 200 private and community foundations that represent over $100 billion in assets.

Commonfund Institute

Author

Commonfund Institute

Disclaimer

Certain information contained herein has been obtained from or is based on third-party sources and, although believed to be reliable, has not been independently verified. Such information is as of the date indicated, if indicated, may not be complete, is subject to change and has not necessarily been updated. No representation or warranty, express or implied, is or will be given by The Common Fund for Nonprofit Organizations, any of its affiliates or any of its or their affiliates, trustees, directors, officers, employees or advisers (collectively referred to herein as “Commonfund”) or any other person as to the accuracy or completeness of the information in any third-party materials. Accordingly, Commonfund shall not be liable for any direct, indirect or consequential loss or damage suffered by any person as a result of relying on any statement in, or omission from, such third-party materials, and any such liability is expressly disclaimed.

All rights to the trademarks, copyrights, logos and other intellectual property listed herein belong to their respective owners and the use of such logos hereof does not imply an affiliation with, or endorsement by, the owners of such trademarks, copyrights, logos and other intellectual property.

To the extent views presented forecast market activity, they may be based on many factors in addition to those explicitly stated herein. Forecasts of experts inevitably differ. Views attributed to third-parties are presented to demonstrate the existence of points of view, not as a basis for recommendations or as investment advice. Market and investment views of third-parties presented herein do not necessarily reflect the views of Commonfund, any manager retained by Commonfund to manage any investments for Commonfund (each, a “Manager”) or any fund managed by any Commonfund entity (each, a “Fund”). Accordingly, the views presented herein may not be relied upon as an indication of trading intent on behalf of Commonfund, any Manager or any Fund.

Statements concerning Commonfund’s views of possible future outcomes in any investment asset class or market, or of possible future economic developments, are not intended, and should not be construed, as forecasts or predictions of the future investment performance of any Fund. Such statements are also not intended as recommendations by any Commonfund entity or any Commonfund employee to the recipient of the presentation. It is Commonfund’s policy that investment recommendations to its clients must be based on the investment objectives and risk tolerances of each individual client. All market outlook and similar statements are based upon information reasonably available as of the date of this presentation (unless an earlier date is stated with regard to particular information), and reasonably believed to be accurate by Commonfund. Commonfund disclaims any responsibility to provide the recipient of this presentation with updated or corrected information or statements. Past performance is not indicative of future results. For more information please refer to Important Disclosures.

Stay connected with the Insights Blog

Popular Blog Posts


Market Commentary | Insights Blog

Chart of the Month | U.S. Budget Deficit Hits Record Highs

In his first 100 days as President of the United States, Joe Biden has introduced three domestic funding proposals, totaling close to $6.0 Trillion, reflecting a desire to enhance the role of the...
Perspectives | Insights Blog

The Case for Using the Higher Education Price Index® (HEPI) to Define Inflation for Colleges

When calculating return targets for an endowment portfolio, a conventional piece of the equation is often the Consumer Price Index (CPI). CPI plus 5% is the common short-hand formula for institutions...
Investment Strategy | Insights Blog

Key Factors in Asset Allocation Decisions for Endowments

There are several broad subjects that an effective investment policy statement (IPS) should include in its contents and address clearly and specifically as they relate to an endowed institution. This...

Disclaimer

Certain information contained herein has been obtained from or is based on third-party sources and, although believed to be reliable, has not been independently verified. Such information is as of the date indicated, if indicated, may not be complete, is subject to change and has not necessarily been updated. No representation or warranty, express or implied, is or will be given by The Common Fund for Nonprofit Organizations, any of its affiliates or any of its or their affiliates, trustees, directors, officers, employees or advisers (collectively referred to herein as “Commonfund”) or any other person as to the accuracy or completeness of the information in any third-party materials. Accordingly, Commonfund shall not be liable for any direct, indirect or consequential loss or damage suffered by any person as a result of relying on any statement in, or omission from, such third-party materials, and any such liability is expressly disclaimed.

All rights to the trademarks, copyrights, logos and other intellectual property listed herein belong to their respective owners and the use of such logos hereof does not imply an affiliation with, or endorsement by, the owners of such trademarks, copyrights, logos and other intellectual property.

To the extent views presented forecast market activity, they may be based on many factors in addition to those explicitly stated herein. Forecasts of experts inevitably differ. Views attributed to third-parties are presented to demonstrate the existence of points of view, not as a basis for recommendations or as investment advice. Market and investment views of third-parties presented herein do not necessarily reflect the views of Commonfund, any manager retained by Commonfund to manage any investments for Commonfund (each, a “Manager”) or any fund managed by any Commonfund entity (each, a “Fund”). Accordingly, the views presented herein may not be relied upon as an indication of trading intent on behalf of Commonfund, any Manager or any Fund.

Statements concerning Commonfund’s views of possible future outcomes in any investment asset class or market, or of possible future economic developments, are not intended, and should not be construed, as forecasts or predictions of the future investment performance of any Fund. Such statements are also not intended as recommendations by any Commonfund entity or any Commonfund employee to the recipient of the presentation. It is Commonfund’s policy that investment recommendations to its clients must be based on the investment objectives and risk tolerances of each individual client. All market outlook and similar statements are based upon information reasonably available as of the date of this presentation (unless an earlier date is stated with regard to particular information), and reasonably believed to be accurate by Commonfund. Commonfund disclaims any responsibility to provide the recipient of this presentation with updated or corrected information or statements. Past performance is not indicative of future results. For more information please refer to Important Disclosures.