Fiscal 2009 was an epochal year. In March, the stock market decline wrought by the financial crisis and Great Recession reached its nadir as investors sensed the worst had passed. With the turn in the equity market, the seeds were sown for the bull market that continued to and through fiscal 2018. Thus, 10 years on, it is useful to look back on the period that began in FY2009 to understand the trends that can be discerned from a decade of data based on the Commonfund Study of Independent Schools (CSIS).
For certain, FY2009 was not an auspicious start to the period, as the endowments of independent schools participating in that Study suffered an average return of -18.0 percent. It proved to be a turning point, however. Over the next decade, only one other year, FY2016, would result in a negative return for Study participants, and that was just -0.8 percent (FY 2012 was unchanged at 0.0 percent). The two best years were FY2011 and FY2014, which generated returns of 17.9 percent and 14.2 percent, respectively. Five of the 10 years produced double-digit gains.
Important as annual returns are, for schools that rely on their endowment to sustain operations and fulfill their mission it is long-term returns that are most meaningful. Thus, Figure VP.1 tracks not only annual returns over the decade but trailing 10-year returns as well. (The exception is FY2009, as the Study did not begin collecting 10-year data until FY2010.) The low point for average 10-year returns was that first year—FY2010, when the 10-year return averaged just 4.0 percent. After that, 10-year returns never dipped below an average of 5.1 percent (FY2016) and went as high as 6.8 percent (FY2014).
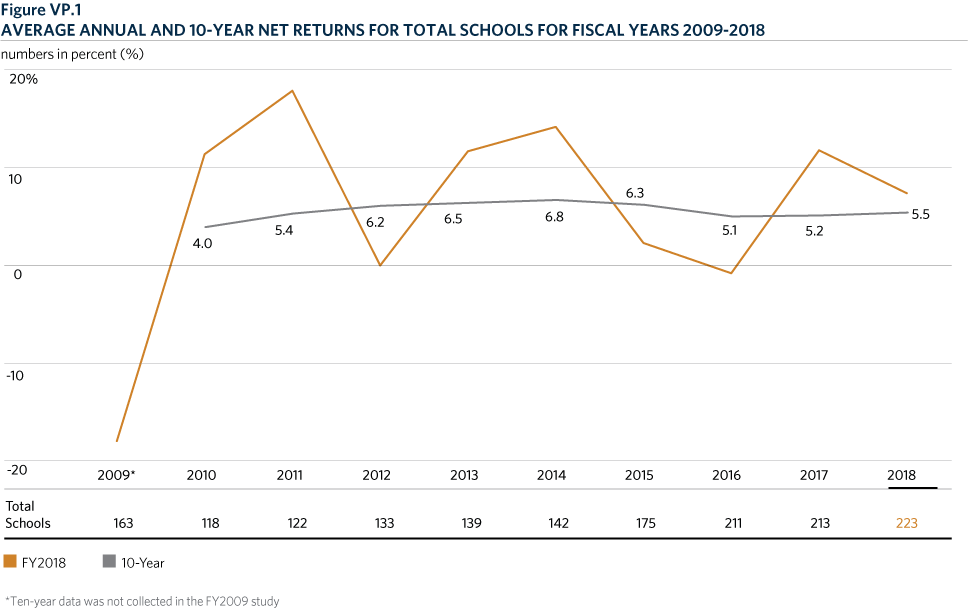
FY2018’s trailing 10-year return of 5.5 percent raises a question: Is it enough to cover spending and inflation? The answer is a qualified yes. Based on Study data, the annual effective spending rate from endowment averaged 4.0 percent from FY2009 to FY2018. Given a Consumer Price Index (CPI) that averaged 1.6 percent per fiscal year over the 10-year period1 the total annual average of spending plus inflation was 5.6 percent.
Thus, all Study participants’ 10-year average return fell short of maintaining the corpus by 0.1 percent annually. But outcomes varied by size. The following summarizes FY2009 – FY2018 return and spending data by size cohort:
10-Year Spending Rates and Net Returns for FY2009 – FY2018
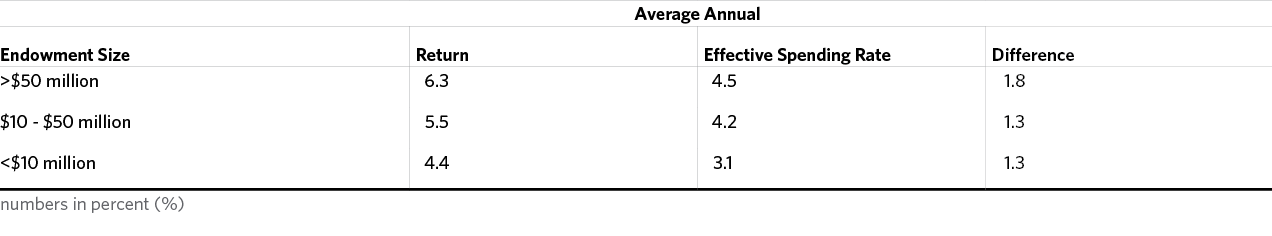
The data show that schools with endowments over $50 million generated an average annual return that was more than enough to compensate for their higher spending rate—an average of 180 basis points of return over spending versus a 130-basis-point differential for the other two size cohorts. The picture is somewhat less positive when inflation is included. (Investment management costs are not included because returns are reported net of fees; that said, total investment management costs go beyond fees paid to providers but are difficult to quantify.) In this scenario, with inflation included, the larger schools’ 1.8 percent excess return nets to a positive 0.2 percent annually and -0.3 percent annually for the other two size cohorts:
-
$50 million: +0.2 percent
-
$10 – $50 million: -0.3 percent
-
<$10 million: -0.3 percent
It can be said that all participating schools are “breaking even,” that is, either slightly ahead or slightly behind no change year to year. In none of these instances, however, are there funds remaining in the endowment to contribute to the long-term growth of the corpus. And the question should be asked: If fund flows are barely positive to slightly negative in a decade of global economic recovery and strength in the financial markets, what may happen during a period when growth slows and capital market returns decline?
Schools participating in the CSIS in recent years may well have asked themselves the same question. We observe that the spending pattern changed markedly over the course of the decade, as shown in Figure VP.2. From FY2009 through FY2013, the average annual effective spending rate for the Total Schools group was 4.3 percent. For the second half of the period, fiscal years 2014 through 2018, the average declined to 3.7 percent. What provoked the change?
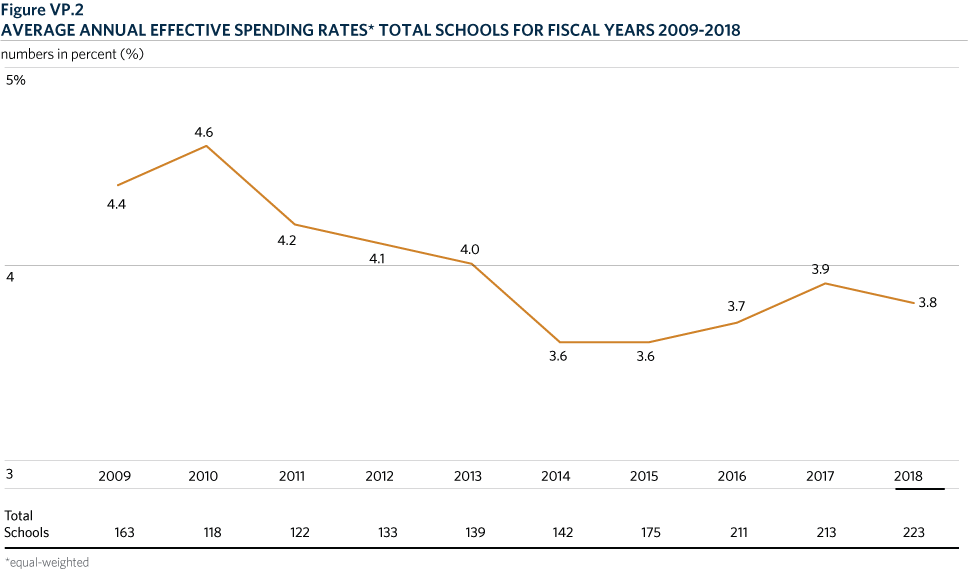
Some of the lower spending rate may have been the result of double-digit returns in four of the six years between FY2009 and FY2014; if the distribution for spending (the numerator) is constant, the effective spending rate will be lower when the endowment value (denominator) rises. But there is the question of whether independent schools consciously decided to bring spending in line with returns and inflation.
An answer may lie in Study data for FY2014. Responding to a question about whether they increased or decreased their spending rate, 40 percent of all respondents said they did, indeed, decrease their spending rate. By size cohort, the data showed: 59 percent of schools with assets over $50 million decreased the rate; 45 percent of those with assets between $10 and $50 million did so; and 15 percent of schools with assets under $10 million decreased their rate. (More schools also decreased their spending rate than increased it the following year, FY2015, but since then the question has not been asked.)
Returning to the present, and using data for the five years from FY2014 through FY2018, the following table shows the impact of a lower effective spending rate on the net returns of schools in the three size cohorts:
Impact of Lower Effective Spending Rates for FY2014 – FY2018
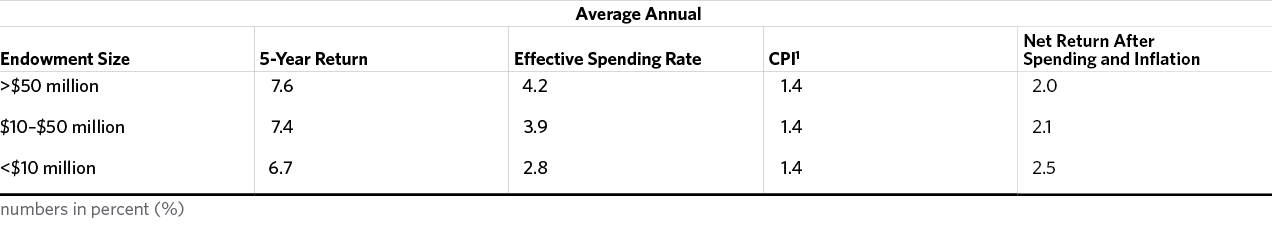
The conditions that existed for the five-year period that are highlighted in the table—that is, the combination of investment returns, effective spending rate and inflation—were such that schools in all three size cohorts experienced an increase in the net return on their endowment portfolio. (Obviously, these parameters cannot be assumed to continue indefinitely, given the vagaries of financial markets and changing rates of inflation.)
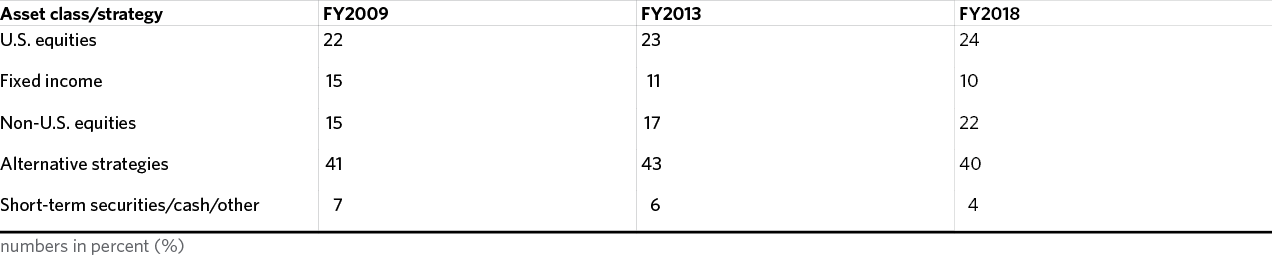
As asset allocation has long been identified as a primary determinant of investment return, that is a subject that warrants a closer look. The following table summarizes asset allocation among all Study participants at the beginning, mid-point and end of the 10-year period.

A few observations may be made:
- The allocation to alternative strategies peaked at mid-decade.
- Traditional equity allocations have grown: Non-U.S. equities increased more than any other allocation followed by the U.S. equity allocation.
- Fixed income and short-term securities/cash/other allocations have trended downward.
Looking at the same data by size cohort highlights noticeable differences.
Institutions with Assets Over $50 million
Institutions with Assets Between $10 and $50 million

Institutions with Assets Under $10 million

The asset allocation differences among the size cohorts leads to observable effects on investment returns:
- Institutions with assets under $10 million clearly benefited from having the largest allocation to U.S. equities. This was the asset class with the highest average annual return over the 10-year period, at 10.2 percent (as measured by both the S&P 500 Index and the Russell 3000 Index).
- Smaller schools also benefited from non-U.S. equity allocations that were the lowest among the three size cohorts. Although this asset class generated the highest return in FY2017, over the 10-year period it lagged (2.6 percent for the MSCI World ex-U.S. Index and 2.3 percent for the MSCI Emerging Markets Free [Net] Index).
- Institutions with assets over $50 million were helped by having the largest allocations to private equity and venture capital, as they produced the second-highest average annual return, at 9.9 percent (as measured by the Burgiss Private IQ – VC and PE Index). We note, however, that the largest schools’ allocation to these two strategies was just a fraction of the smallest schools’ allocation to U.S. equities.
- The largest schools also reported greater total equity allocations—86 percent in FY2018 versus 69 percent for the smallest schools and 75 percent for the mid-sized cohort.
New Gifts to Endowment
Looking at data over a nine-year period (as this data was first collected for FY2010), gifts and donations strengthened in the second half of the timeframe. This is understandable given the lingering effects of the financial crisis and Great Recession in the early part of the period. Giving to all participants reached its high point, an average of $2.1 million, in FY2017. The second- and third-highest years for giving were FY2018 (an average of $1.8 million) and FY2016 (an average of $1.6 million). For fiscal years 2014 and 2015 the average gift was $1.4 million (both higher than any of the preceding four years).
Analyzing the data by size cohort, FY2017 was the best year or tied for the best year for all three size cohorts. There was a divergence in FY2018, however, as the average gift rose by 23 percent for schools with assets over $50 million but fell for schools in the other two size cohorts (a decline of 25 percent for schools with assets between $10 and $50 million and a 50 percent decline for schools with assets under $10 million).
It is too early to say whether the decline reflects the effect on gifts of the Tax Cuts and Jobs Act, which was enacted into law in December 2017. As noted in the main body of this Study, in terms of charitable giving, the act effectively doubled the standard deduction, and in so doing may have eliminated the charitable deduction for millions of taxpayers who will no longer itemize their tax returns.
Conclusions
In most years over the past decade schools participating in the CSIS reported investment returns that were sufficient to cover spending, inflation and investment management costs. Six of the 10 years met that hurdle. In the very first year of the decade, FY2009, participating schools reported an average return of -18.0 percent—but that will drop out of the 10-year return calculation next year and, barring a poor FY2019, that alone will lift long-term returns.
That qualifies as a passive step in a positive direction. An active one appears to be the move, starting in FY2014, in the direction of lower average annual effective spending rates. While we do not advocate lower spending as a policy matter—clearly, a decision each institution has to make for itself—it does help to preserve endowment purchasing power over the long term.
Asset allocation continues to evolve. U.S. equities had a strong decade as did fixed income—but both benefited from an extraordinary era of artificially low interest rates that is not likely to be seen again anytime soon. In this environment, schools may benefit by adhering to the basic tenets of the endowment model:
- Maintain an equity bias;
- Diversify not only by asset class, geography and strategy but also, for example, factor analysis and bottom-up risk construction; and
- Focus long term to capture the liquidity premium offered by alternative strategies.
Ultimately, schools will have to continue to balance the tension between meeting annual spending needs and longer-term institutional sustainability.
- The CPI values reported are from the 2018 Commonfund Institute Higher Education Price Index (HEPI) report, based on fiscal year (July 1 through June 30) 12-month averages rather than the monthly (or point-to-point) CPI values usually reported by the Bureau of Labor Statistics (BLS). The BLS updates CPI statistics monthly. It also provides a six- and 12-month average change; January – June, July – December and January – December.
