How much does investment management cost? Fiduciaries, donors and stakeholders at endowed institutions have a strong interest in finding a good answer to this question, particularly in this era of low returns when costs may occupy a comparatively large proportion of the total return percentage.
But achieving that goal is harder than it seems. In our white paper of 2015, “Understanding the Cost of Investment Management,” we outlined the types of cost that institutions pay—including those that are not specifically invoiced, and of which many fiduciaries may be unaware. This year, we enlisted the aid of institutions participating in the NCSE to dig more deeply into one of the main factors that influence investment cost: the investment vehicles employed in managing the portfolio. By means of this new data, which we analyze here together with information gleaned from Commonfund’s own experience and research into the area of costs, we hope to provide a useful comparative analysis of cost and its components.
Methodology
In a significant elaboration of the annual asset allocation worksheet that all respondents complete, we asked them to specify, from a set of listed vehicles, the proportion of each investment strategy (out of a total of 100 percent) that was allocated to a particular vehicle.
The five vehicles were:
- Passive/index strategies
- Active mutual funds
- Other commingled vehicles
- Separate accounts
- Internally-managed investments
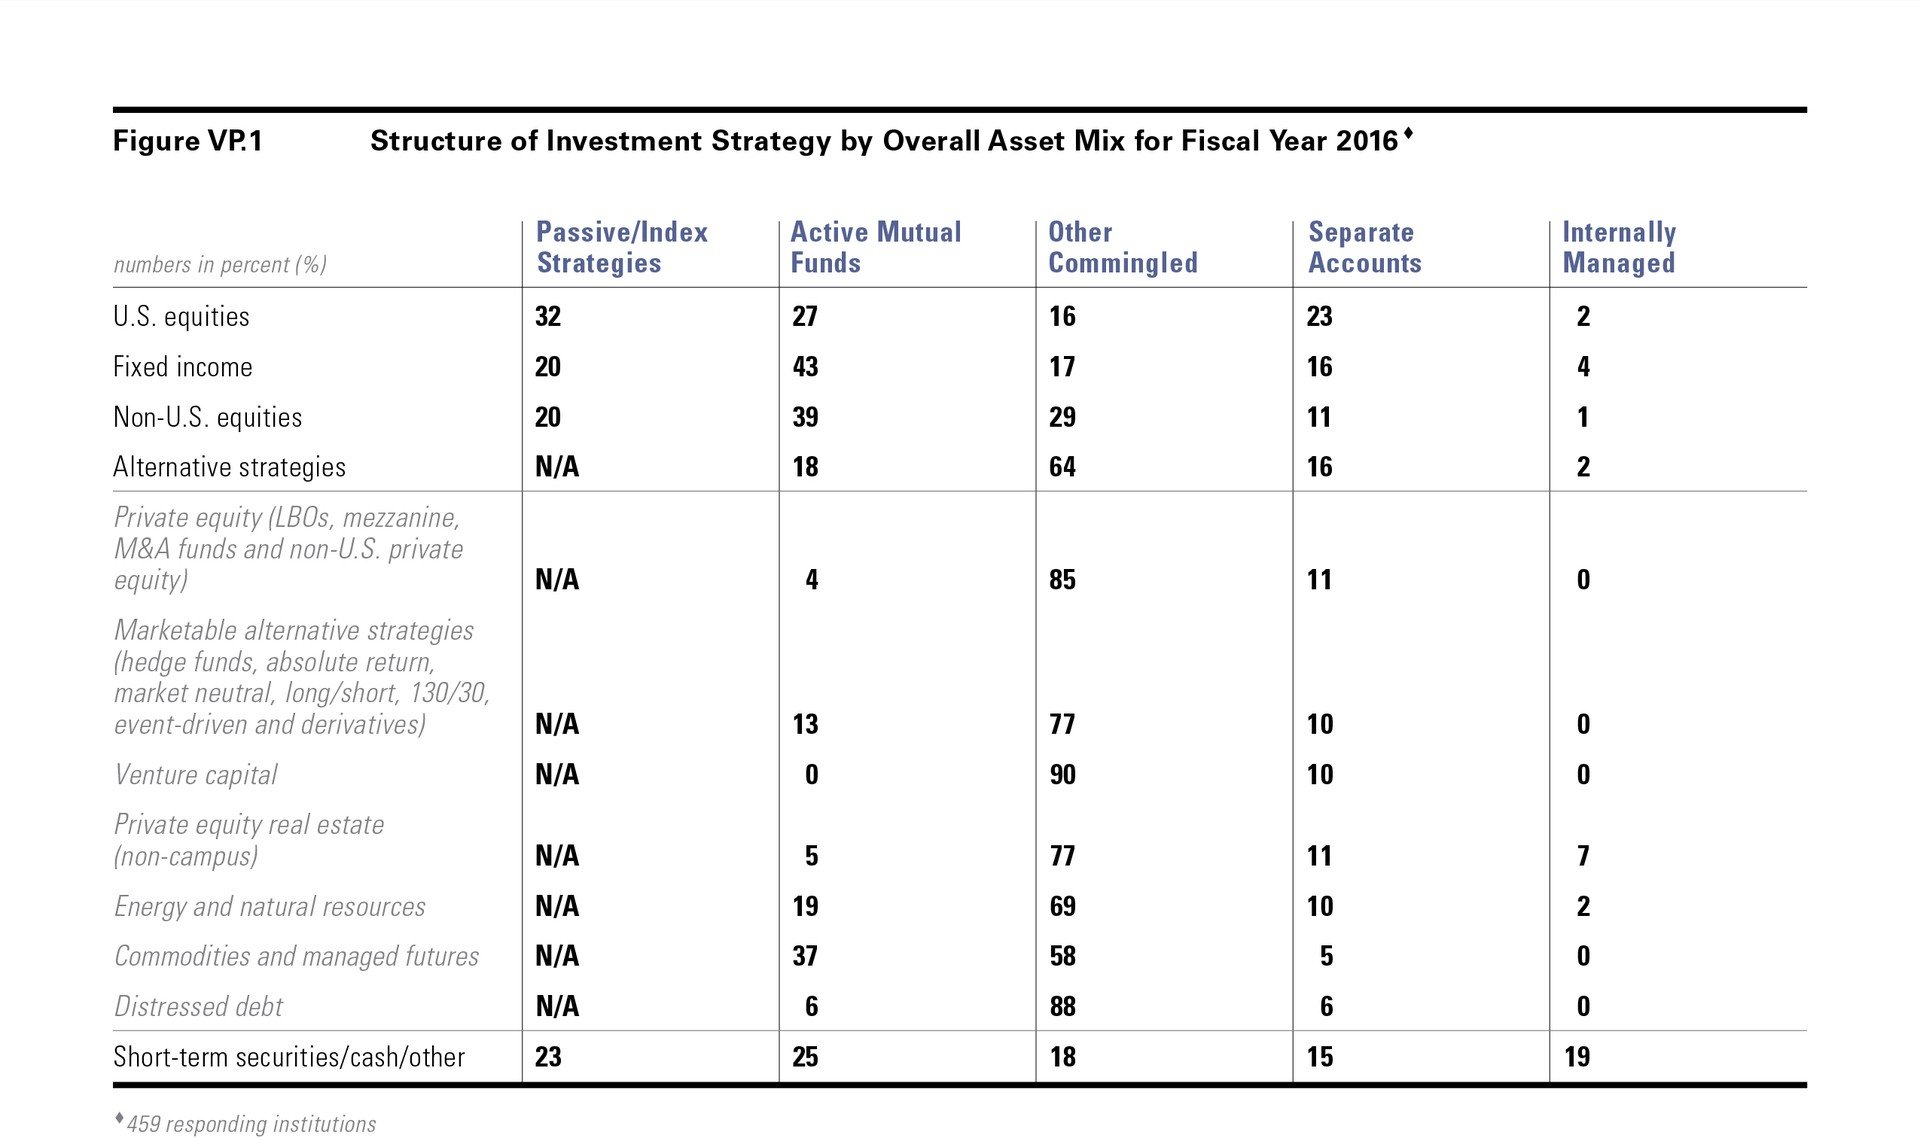
Despite the considerable increase in complexity that was associated with completing the asset allocation worksheet in this way, we are very grateful that a large proportion of participating institutions were able to fill in these tables. The number completing each category varied, naturally, by asset class and investment strategy, depending on what strategies and structures were used. For U.S. equities, the investment group with the most completions, 459 participating institutions— fully 57 percent of the total participant group of 805 — filled in these tables. Non-U.S. equities had the next-highest rate of completions, at 444 institutions. For fixed income, the number of completions was almost the same, at 442. For the broad group of alternative strategies, 357 institutions were able to give us a completed table. (Within alternatives, the numbers of completed tables varied, based on which strategies were used; all bases are shown in the tables associated with each strategy in Appendix III of the 2016 NACUBO-Commonfund Study of Endowments available upon request.) And for short-term securities/cash/other, 317 institutions gave us the category breakdown. The robust data obtained from these data sheets form the basis for the analysis in the table above.

What Structures Are Being Used?
The first point that is apparent from the table above is that passive/index strategies are used only in liquid, traded markets. Thus, while between one-fifth and one-third of U.S. equity, fixed income, non-U.S. equity and short-term/cash/other allocations are indexed, alternative strategies by definition do not lend themselves to indexation. Looking to the next column, in which the use of active mutual funds is set out, it is similarly clear that this category of vehicles is widely used by institutions for the four liquid strategies. What is also apparent, however, is that a small but not insignificant 18 percent of institutions’ alternative strategies allocation is being managed via active mutual funds. Within alternatives, 37 percent of the commodities and managed futures allocation is being managed through mutual funds, as is 19 percent of the energy and natural resources allocation. Thirteen percent of the marketable alternative strategies allocation is managed via active mutual funds. Just 4 percent of the private equity allocation is managed via active mutual funds, while for private equity real estate (i.e., not real estate investment trusts, or REITs) the allocation managed through active mutual funds is just 5 percent. For distressed debt, the allocation to active mutual funds is only slightly higher, at 6 percent. There is no management of venture capital assets via this structure.
The next category, other commingled funds, captures collective investment vehicles, including limited partnerships, that are typically privately placed. A key defining characteristic of these vehicles is that they lack the daily liquidity that is characteristic of mutual funds. Some, such as marketable alternative strategy partnerships, may provide monthly or quarterly liquidity, but others, such as private equity and venture capital partnerships, are more or less completely illiquid and have only a limited secondary market.
Private commingled fund structures are used less frequently than mutual funds for U.S. equities, fixed income, non-U.S. equities and short-term securities/ cash/other, but are employed quite frequently for the various alternative strategies, at a rate of 64 percent of the overall alternatives allocation. Fully 90 percent of venture capital allocations are invested via commingled funds; so are 88 percent of distressed debt allocations and 85 percent of private equity allocations. Over three-quarters of marketable alternative strategies and private equity real estate allocations use this structure, as do 69 percent of energy and natural resources allocations and 58 percent of commodities and managed futures allocations.
Separate accounts, as their name implies, are investment management agreements concluded on an individual basis between the investing institution and the manager. While the investment strategy may be very similar to that undertaken in a commingled fund structure, the investment is not a fund; this structure is intended, among other things, to avoid the risk of an unruly rush for redemptions from a fund structure in the event of market turmoil.
Because most investment managers require a minimum account size to set up a separate account, the use of this structure is, in general, less widespread than the others, previously mentioned. Just under one-quarter of U.S. equities allocations are managed via separate accounts, while 16 percent of fixed income allocations and 11 percent of non-U.S. equity allocations are managed using this structure. For short-term securities/cash/other, the proportion is 15 percent.
With respect to alternative strategies, 16 percent of the overall allocation is managed using separate accounts. Within this allocation, the percentage of individual strategies such as private equity, marketable alternatives, venture capital, private equity real estate and energy and natural resources is closely grouped at 10 to 11 percent, while the percentage for commodities and managed futures and distressed debt is much lower, at 5 percent and 6 percent, respectively.
The last structure is internal management, where investments are managed by investment or financial staff or by a separate management company. Only a small percentage of each investment strategy is managed using this structure; the main exception is short-term securities/cash/other, where 19 percent of the allocation is internally managed. Within the alternative strategies allocation, private equity real estate has the highest proportion of internal management, at 7 percent of allocations.
Who Uses What Structure?
Within the various structures, some patterns of usage by endowment size can be clearly discerned.
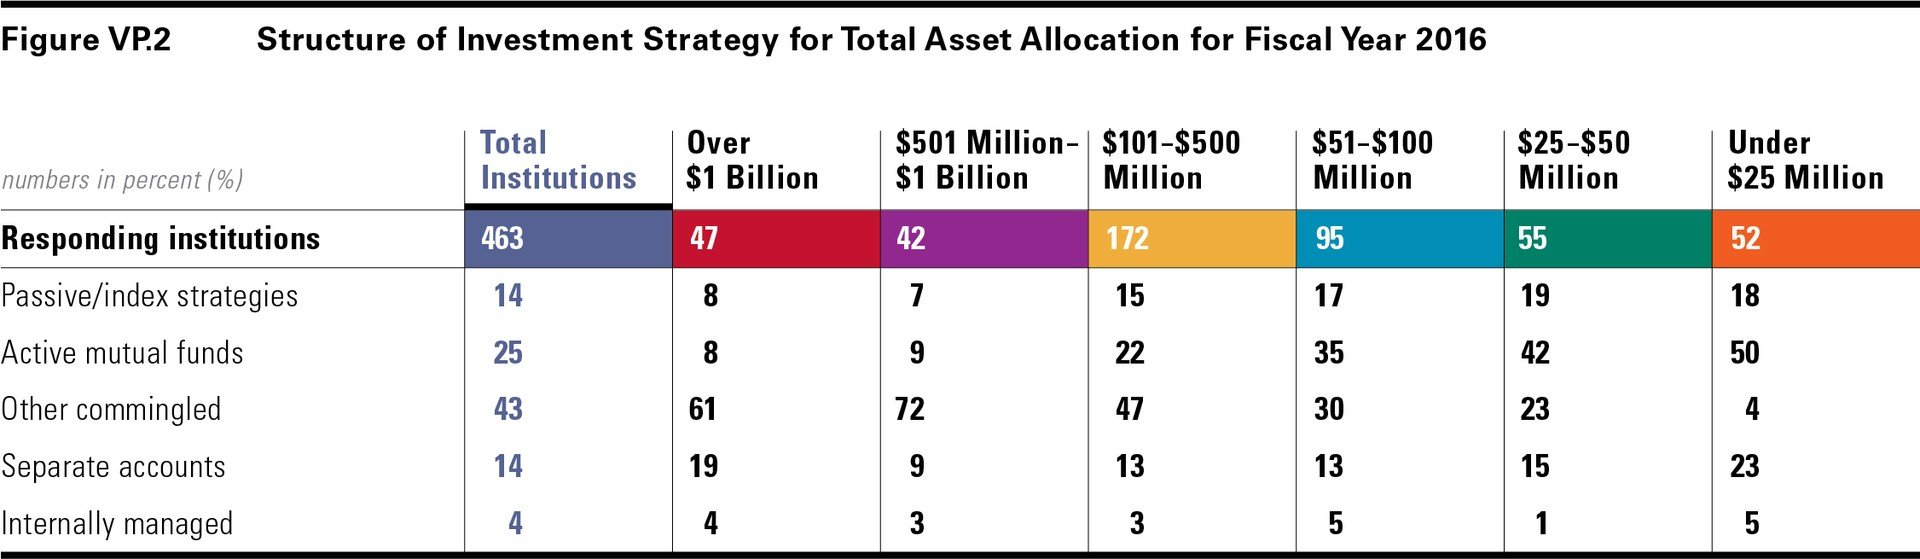
Index strategies, for example, are used primarily by the smaller four size cohorts, generally for between 15 and 19 percent of the portfolio; the two larger cohorts, in contrast, use index strategies sparingly, allocating just 7 to 8 percent of their portfolio via these structures. This low allocation reflects the fact that larger endowments have higher allocations to alternative strategies that are not offered in index form. In addition, while they may choose to obtain market return cheaply from areas such as U.S. equities and fixed income via indexation, larger endowments are also likely to have greater confidence in their ability to obtain access to high-performing active managers in these strategies.
Similarly, it is not surprising that active mutual funds, with their high liquidity, are also primarily used by smaller endowments, with between 22 percent and 50 percent of allocations of institutions with assets under $500 million taking this form.
Conversely, they are used less frequently by larger institutions, which prefer commingled funds and separate accounts.
Private commingled funds are used for between 61 percent and 72 percent of the overall asset pool by the two larger endowment cohorts. Their use by mid-sized and smaller endowments ranges between 23 and 47 percent of the allocation, while only 4 percent of the assets of the smallest group are allocated using this structure.
Separate accounts are used to some extent across all sizes of endowment. Among the over $1 billion group, 19 percent is allocated to this structure, a figure that drops in the next-largest cohort to the smallest allocation, at 9 percent. From there, however, as endowment size decreases the proportion of the portfolio allocated using a separate account increases, rising to 13 percent among endowments with assets from $51 to $500 million, 15 percent for the group with assets between $25 and $50 million, and 23 percent for the group under $25 million, the highest allocation among all size cohorts.
As noted above, internal management is used by a relatively small number of institutions and for a small percentage of assets overall.
What Are the Components of Cost?
Commonfund, in keeping with its mission to strengthen the financial resources of the nonprofit sector, has for many years collected information on costs and fees. This information formed the basis for our white paper, “Understanding the Cost of Investment Management,” to which we referred earlier. For this year’s NCSE, we asked responding institutions to tell us the various components of their investment costs, using somewhat more detailed questions than in the past. We then used our own calculations of the expected costs associated with the various investment structures that we have just reviewed, combined them with the allocation information, and prepared a comparative table showing differences between our estimate of costs and those of responding institutions.
A few interpretive points are in order when reviewing this information.
First, we do not include in this table any estimates of incentive fees that might be associated with alternative investment management strategies such as marketable alternatives, private equity, venture capital, real estate, or energy and natural resources, to name a few. These fees, by definition, are highly variable depending on the success of the strategy and the individual manager, not to mention the relative negotiating power of the endowment with respect to fee arrangements— factors which make it difficult to arrive at an appropriate benchmark.
Second, we make no normative claims for our own estimates. Individual institutions may pay more, or less, than the figures we set out here; the purpose of this analysis is to provide a source of representative information about average fee levels, not to prescribe what any individual institution does or should pay.
Finally, we should note that the fee environment is itself in considerable flux, with anecdotal information indicating that traditional fee arrangements such as the typical 2 percent of assets and 20 percent of gains charged by many alternative strategies managers are being increasingly challenged, particularly for managers whose performance is below the top quartile. The information provided here is therefore a snapshot of a point in time, and does not indicate any specific direction or level of appropriate costs or fees.With these caveats as background, we can examine the data. The table below is drawn from a suite of questions in which we asked responding institutions to provide information about the fees they paid directly to service providers in FY2016, and to give a three-year average of the components of their overall expense ratio. For each category of reported information, we have set forth Commonfund’s good faith estimate, based on the mix of investment structures used by each size cohort, of the average cost associated with that aspect of the investment management process. We then show the information provided by the participant and the difference between Commonfund’s estimate and the data provided.
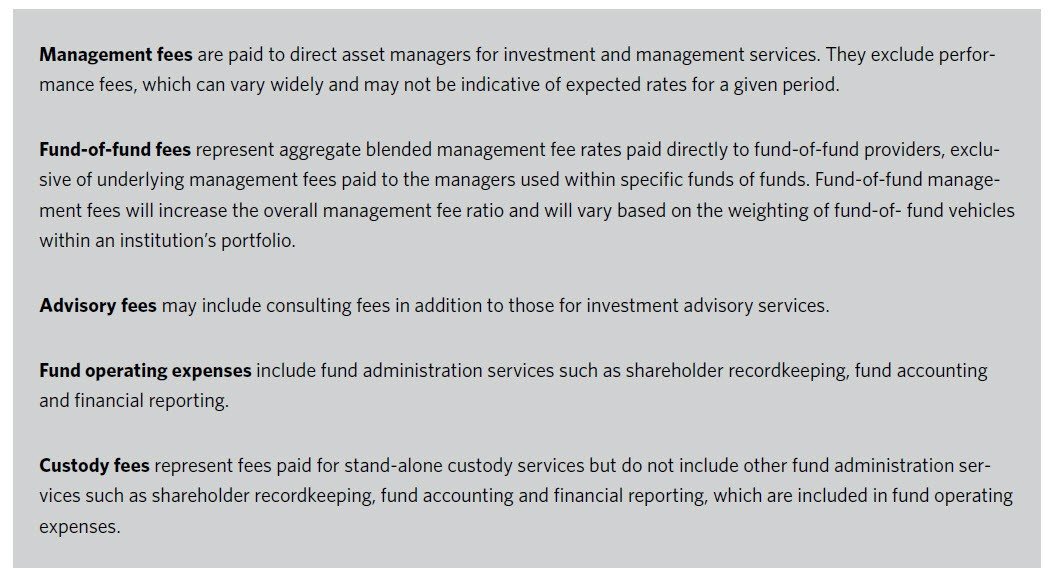
We examine first the top two categories, which represent management fees and fund and operating expenses. Management fees may be directly invoiced or charged indirectly within funds and, therefore, embedded within reported net asset values; fund and operating expenses represent custody, audit, tax and other servicing costs that are typically subtracted at the fund level.
As we have noted, larger endowments tend to use structures such as commingled funds and separate accounts that can attract higher management fees. In addition, their higher degree of diversification usually includes allocations to areas such as private equity, venture capital, emerging markets and other specialized strategies where fees tend to be higher than those for managing listed public securities in developed markets. For these reasons, it is not surprising to see that the three larger endowment cohorts have markedly higher management fees than the three smaller groups. Conversely, reported fund and operating expenses are higher for the smaller three cohorts than for the larger endowments. This may be due to the fact that mutual funds, which are more heavily used by smaller endowments, are required by law to disclose more details of their fund and operating expenses than managers of commingled funds and separate accounts, which are governed by private contract. It is also possible, moreover, that it is difficult even for larger endowments to “drill down” sufficiently into the fund reports to ascertain accurately what the fund and operating expenses actually are.
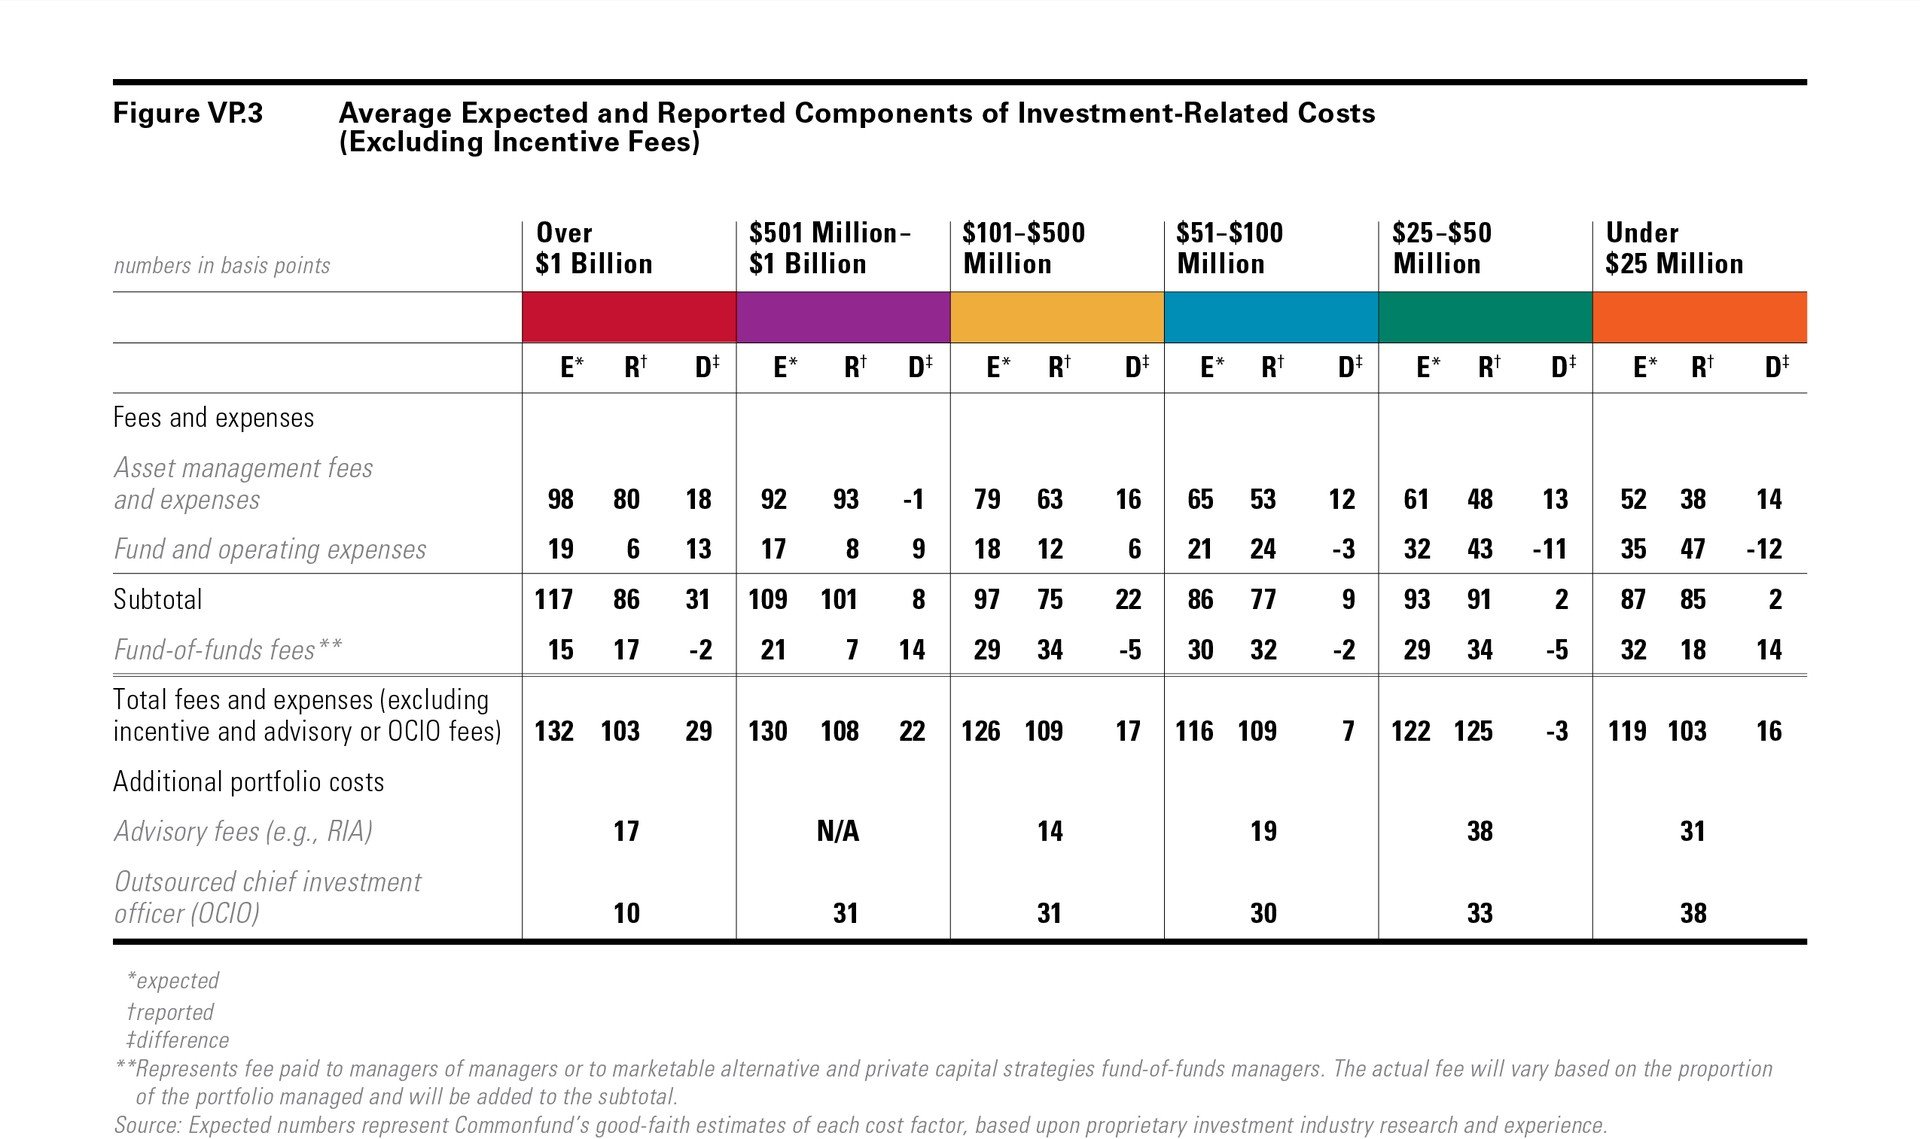 The net result is that, because of the relative clarity of reporting associated with mutual funds, when both management fees and fund and operating expenses are taken into account, smaller endowments’ fee numbers are closer to those estimated by Commonfund than those of their larger counterparts. Put another way, they may have a more complete picture of the fees they are paying. While for the smaller cohorts the difference between their reported figures and Commonfund’s estimates is no more than 9 basis points, for two of the three larger cohorts the differences are 22 and 31 basis points— significant enough to be material— although we note that, for the group with assets between $501 million and $1 billion, the difference, at 8 basis points, is also quite low. Taken as a whole, we believe that this analysis highlights the ongoing difficulty of drawing firm conclusions about expense levels, even when questions are asked with some specificity.
On the four lines below the management fees and operating expenses we review fund-of-fund fees, advisory fees charged by a registered investment adviser (RIA), fees charged by a provider of outsourced chief investment officer (OCIO) services, and custody and administration charges.
Fund-of-fund fees are generally thought to range from 5 to 75 basis points, largely depending upon the size of the endowment under management and the particular strategy; respondents reported fees ranging from 7 basis points for endowments with assets between $501 million and $1 billion to 34 basis points for those with assets between $101 to $500 million and $25 to $50 million. Such a wide range most likely reflects the nature of the different fund-of-fund relationships. Lower fees may be associated with relatively generic, liquid strategies, while higher fees may include alternative investment strategies or the provision of additional oversight or analytical services.
Advisory and OCIO fees, on the other hand, are clearly higher for smaller portfolios and lower for larger ones, reflecting the standard economies of scale associated with the investment management industry. Reported rates ranged from 10 to 38 basis points, with most in the 30-plus range.
Finally, custody fees are in a tight three- to six-basis-point range, with the exception of the cohort with assets between $25 and $50 million, which is an outlier at 11 basis points. Here the respondents may be including internal administrative or other costs in their answers.
Adding It Up
What does all this analysis— of structures, asset allocations, and fee levels— add up to? What does it mean for the responding institutions that helped to create this body of data?
First, and most important, it means that we believe we are finally on the right track to asking the proper questions about fees. While there are certainly differences between Commonfund’s estimates and the reported numbers, respondents on the whole have given us a picture of their cost components and levels that is relatively realistic and within recognizable ranges. If we average, for example, the reported management fees and fund and operating expenses for the two largest cohorts we obtain a total management fee of 94 basis points, reasonably within range of an average of Commonfund’s estimates, which is 113 basis points. The other fee categories, as we have discussed, are harder to pin down and depend on the extent and nature of the services provided as well as on the size of the investment pool. Nevertheless, it is not difficult to arrive at the conclusion, as we have stated elsewhere, that a well-diversified endowment will likely be incurring total costs of between 100 to175 basis points. This number would include an estimated average 40 basis points for incentive fees which will, of course, vary with the nature of the portfolio and the success of the managers. Significantly, this range of total expenses fits nicely around the three-year average expense ratios reported in Figure 5.12 in the full NCSE Study.
So— are we done? Not necessarily. It is important to realize that these figures are aggregates which obscure a host of individual differences among institutions and portfolios. It would be incorrect to use the data presented here as a benchmark of what any particular institution “ought” to be incurring in the way of investment costs. But we offer this analysis as an important beginning, and extend our gratitude to the individuals at the responding institutions who helped us to bring this somewhat murky topic, finally, into the light.
This viewpoint appeared in the 2016 NACUBO-Commonfund Study of Endowments published March 2017.
