Viewpoint: Changing Our Minds

January 12, 2015 |
4 minute read
|

It is often said that we live in a world of change, but it is surprising how slowly that change can occur.

Seven years after the onset of the Great Recession, many business school students are still taught that portfolio volatility is a suitable proxy for risk. In an encouraging contrast, however, this year’s NCSE data show that endowment fiduciaries at educational institutions are increasingly—and meaningfully—assimilating new practices in measuring and overseeing risk, taking steps to acknowledge and understand it in its various forms.

Returns and risk both matter

For four of the five fiscal years since March 2009, endowment returns have been strong:

FY2010: 11.9%
FY2011: 19.2%
FY2012: -0.3%
FY2013: 11.7%
FY2014: 15.5%

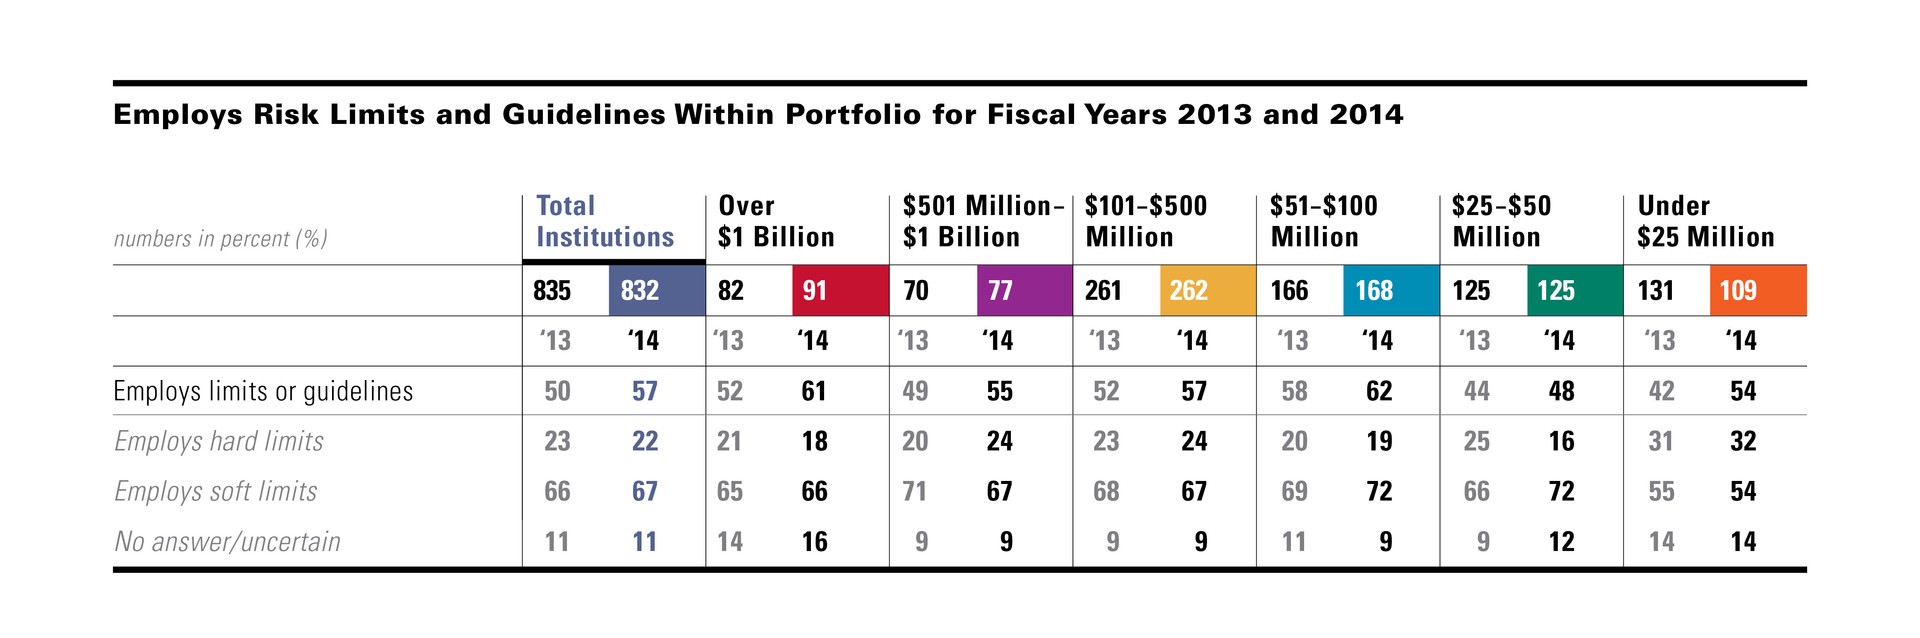
Employs Risk Limits and Guidelines Within Portfolio for Fiscal Years 2013 and 2014

NCSE_14_A

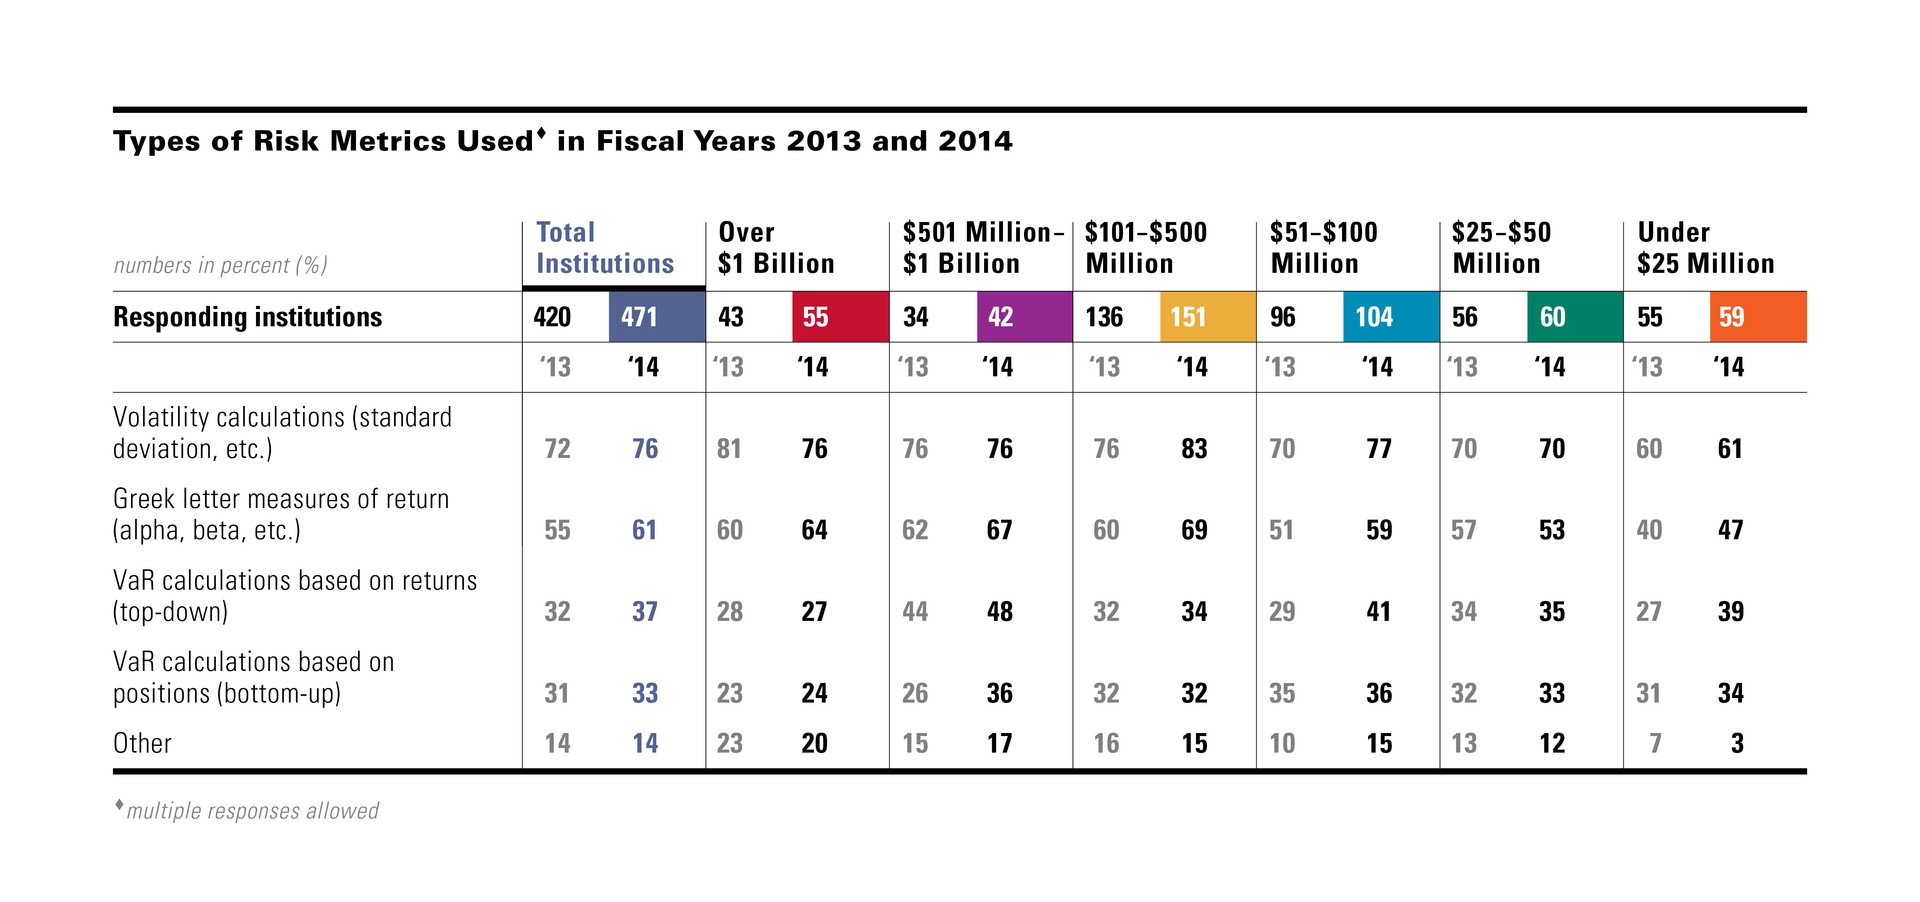
Types of Risk Metrics Used• in Fiscal Years 2013 and 2014

NCSE_14_B

This run of good performance, supported by the policies of global central banks, has boosted NCSE participants’ trailing five-year returns to 11.7 percent. But instead of concluding that life has returned to normal, endowment boards and investment committees seem to have determined that the times call for a renewed emphasis on risk.

In last year’s Study, we introduced a suite of questions about risk management. Participants’ FY2013 responses set a solid but unremarkable baseline: exactly half of responding institutions reported using risk limits and guidelines within their portfolio, with surprisingly little variation by endowment size. But this year, the percentage using such risk measures jumped to 57 percent, with increases across all sizes. Responses to other risk-related questions show a clear increase in the use of risk limits, the types of risk metrics used, and the application of stress or scenario tests to portfolios.

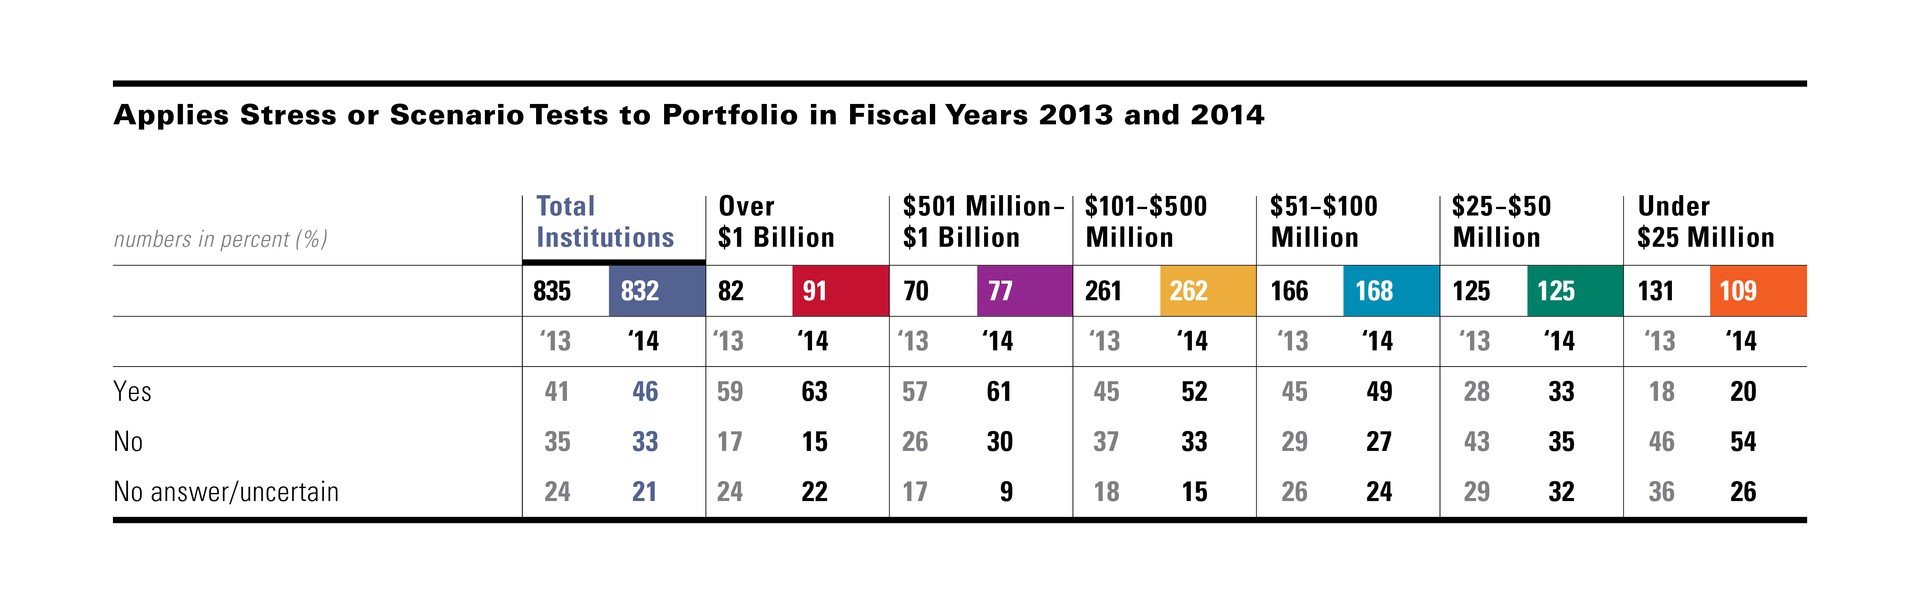
Applies stress or scenario tests to portfolio

A few brief comments will serve to highlight the trends. As noted, the first table shows that 57 percent of respondents said that they use risk limits and guidelines, up from 50 percent in last year’s Study. Among larger endowments, the shift was very pronounced, from 52 percent last year to fully 61 percent this year. But this awakening to the need for risk guidelines was felt among the smallest endowments to an even greater degree, with those with assets under $25 million reporting an increase of 12 percentage points, from 42 percent last year to 54 percent in FY2014. In between these two extremes, the increase varied from four to six percentage points across the various size cohorts. The trend toward use of risk limits overall, however, is quite distinct.

Applies Stress or Scenario Tests to Portfolio in Fiscal Years 2013 and 2014

NCSE_14_C

Drilling down further into the specific types of risk metrics used, the second table shows uniformly increased adoption rates for all four of the metrics surveyed. Interestingly, usage of volatility, the “traditional” risk measure, was essentially stable for three of the six size groups and actually fell in usage among the largest (and presumably most sophisticated) endowments. Use of the “Greek letter” measures such as alpha and beta rose strongly with three of the six size groups, falling at only one. And use of Value at Risk (VaR) calculations, whether returns-based or position-based, also rose.

Respondents’ comments serve to underscore the greater adoption of various risk metrics. A number of institutions commented that they rely on their consultants, investment manager or outsourced chief investment officer (OCIO) firm to conduct various stress tests for them. Other comments provided additional insight:

  • Several institutions said they employ rolling VaR and beta relative to policy. Similarly, Sharpe and Sortino ratios are employed with relative frequency. A private university in the Southeast commented, “We calculate these, measure and discuss, but do not employ hard rules or make decisions solely based on them.”
  • Said a private institution on the West Coast, “We use a proprietary Monte Carlo risk analysis to evaluate value at risk and estimated tail loss, and include our cash flow projection in this as well.”
  •  Another private university in the Southeast commented, “Our only ‘hard’ risk limit is based on a forward-looking long horizon (10-plus years) estimate of absolute risk, quoted as an annualized standard deviation. It is based upon a snapshot of position-level data wherever that is available.”
  • A public university foundation on the West Coast says it views position-level detail by examining each manager’s holdings and then aggregates them to look at overall risk.

Stress and scenario tests used more often

Apart from ratios and traditional risk measures, the use of stress and scenario testing also increased among respondents. The third table shows an across-the-board rise in the percentage of institutions of all sizes applying such tests to their portfolios this year. As might be expected, their use is clearly higher among larger endowments than it is among institutions in the smaller cohorts. Among the four larger size groups, the rate of usage is substantial, in the range of 49 to 63 percent, and only falls to more modest rates of 33 percent and 20 percent, respectively, among institutions with assets between $25 and $50 million and those with assets under $25 million.

Further evidence of the increased emphasis on risk management may be found in another table, showing a variety of ongoing due diligence procedures employed by participating institutions.

Ongoing Due Diligence Procedures Employed• for Fiscal Years 2013 and 2014

NCSE_14_D

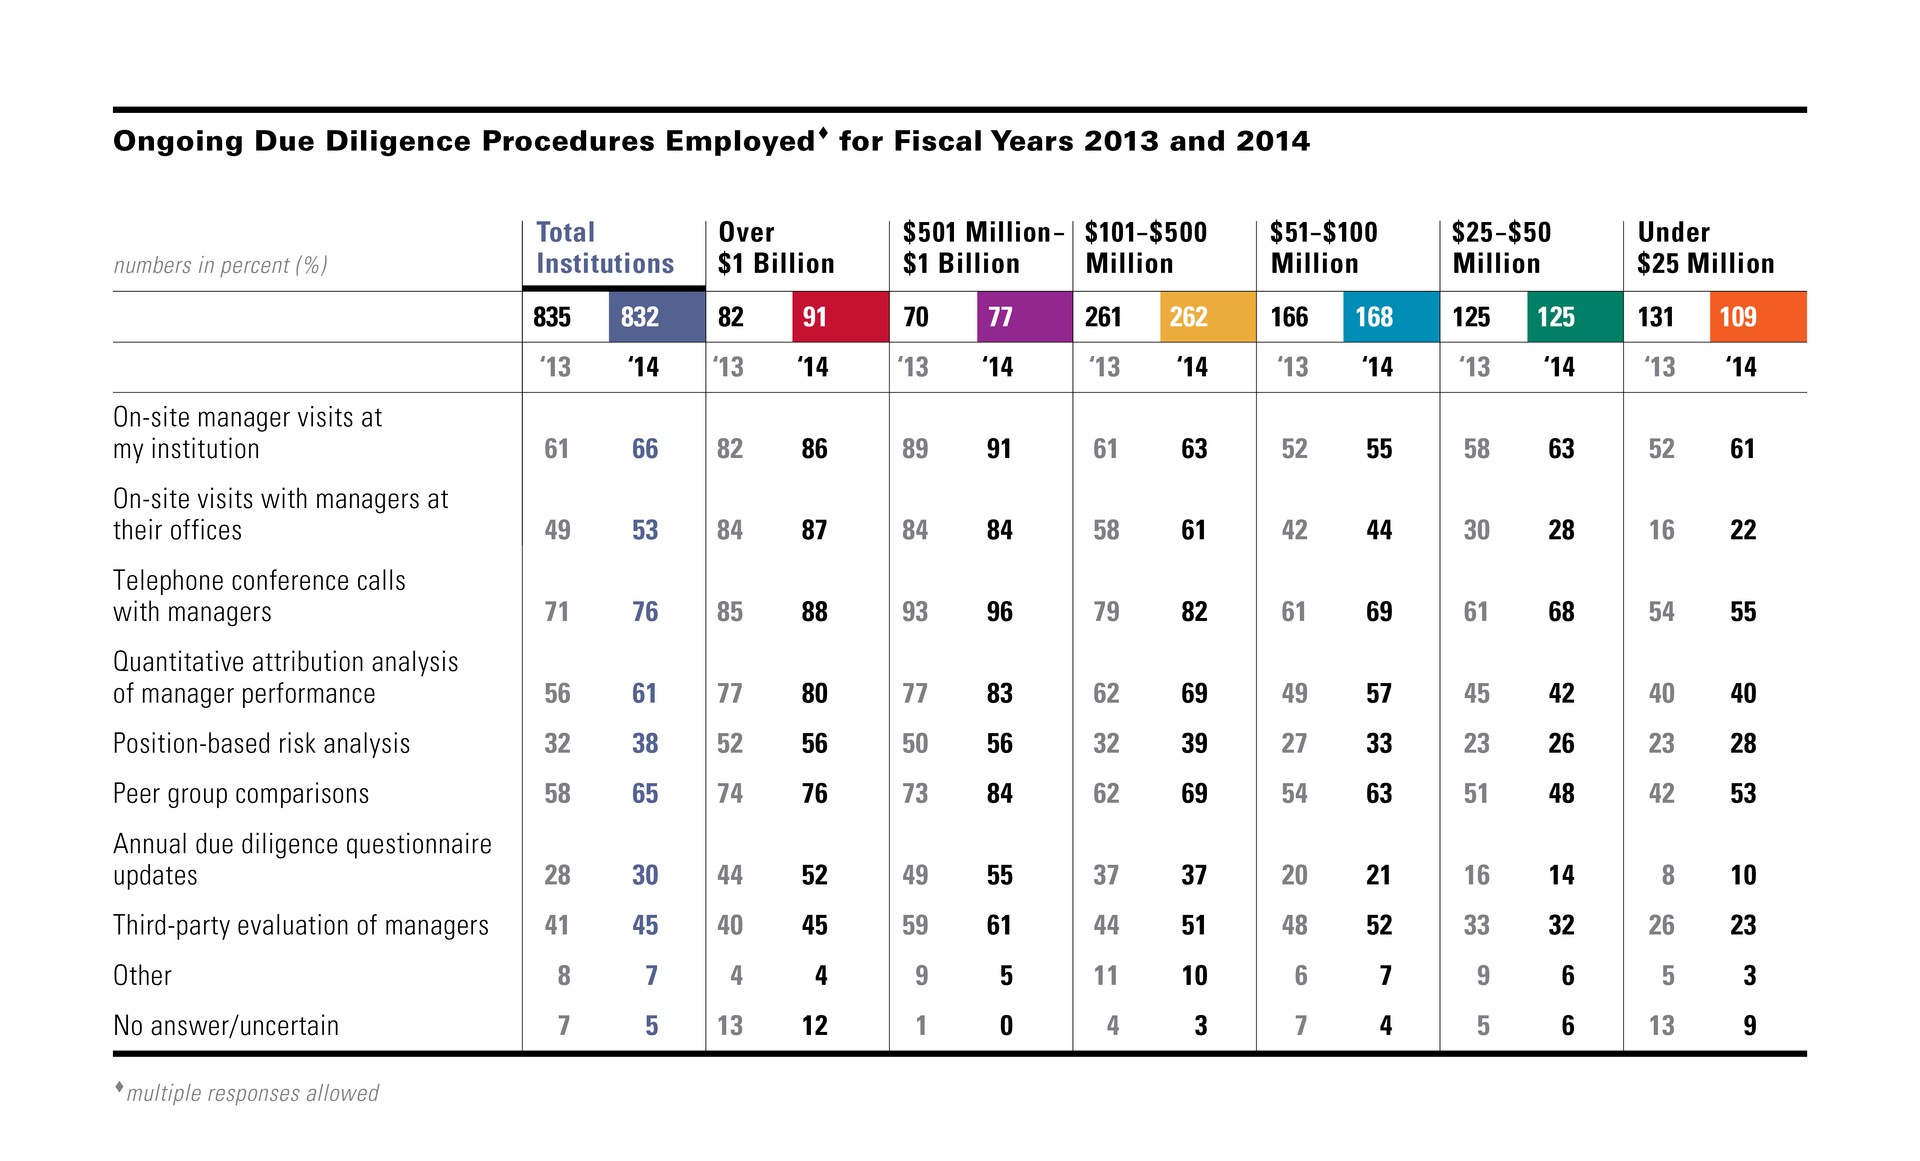
Ongoing due diligence procedures employed

Respondents reported higher overall rates of usage for all eight of the due diligence procedures listed. And, for all but the smaller size cohorts, the eight procedures were employed this year at rates higher than or equal to the previous year. Perhaps most encouragingly, use of the non-quantitative practices such as face-to-face visits and telephone calls with managers also showed healthy increases.

Conclusion

The financial crisis sent a clear message: catastrophic events, while hopefully rare, can and do happen, and the consequences can be severe. It is good to see that risk management disciplines are being placed on a level equal to that of return, creating a culture in which risk-adjusted return becomes the appropriate measure. The future is unknowable, but this increase in best-practice risk measurement is surely to be praised. While those responsible for college and university endowments cannot prevent future crises, at the very least they can be better prepared.

This viewpoint appeared in the 2014 NACUBO- Commonfund Benchmarks Study of Endowments published January 2015. 

Commonfund Institute

Author

Commonfund Institute

Disclaimer

Certain information contained herein has been obtained from or is based on third-party sources and, although believed to be reliable, has not been independently verified. Such information is as of the date indicated, if indicated, may not be complete, is subject to change and has not necessarily been updated. No representation or warranty, express or implied, is or will be given by The Common Fund for Nonprofit Organizations, any of its affiliates or any of its or their affiliates, trustees, directors, officers, employees or advisers (collectively referred to herein as “Commonfund”) or any other person as to the accuracy or completeness of the information in any third-party materials. Accordingly, Commonfund shall not be liable for any direct, indirect or consequential loss or damage suffered by any person as a result of relying on any statement in, or omission from, such third-party materials, and any such liability is expressly disclaimed.

All rights to the trademarks, copyrights, logos and other intellectual property listed herein belong to their respective owners and the use of such logos hereof does not imply an affiliation with, or endorsement by, the owners of such trademarks, copyrights, logos and other intellectual property.

To the extent views presented forecast market activity, they may be based on many factors in addition to those explicitly stated herein. Forecasts of experts inevitably differ. Views attributed to third-parties are presented to demonstrate the existence of points of view, not as a basis for recommendations or as investment advice. Market and investment views of third-parties presented herein do not necessarily reflect the views of Commonfund, any manager retained by Commonfund to manage any investments for Commonfund (each, a “Manager”) or any fund managed by any Commonfund entity (each, a “Fund”). Accordingly, the views presented herein may not be relied upon as an indication of trading intent on behalf of Commonfund, any Manager or any Fund.

Statements concerning Commonfund’s views of possible future outcomes in any investment asset class or market, or of possible future economic developments, are not intended, and should not be construed, as forecasts or predictions of the future investment performance of any Fund. Such statements are also not intended as recommendations by any Commonfund entity or any Commonfund employee to the recipient of the presentation. It is Commonfund’s policy that investment recommendations to its clients must be based on the investment objectives and risk tolerances of each individual client. All market outlook and similar statements are based upon information reasonably available as of the date of this presentation (unless an earlier date is stated with regard to particular information), and reasonably believed to be accurate by Commonfund. Commonfund disclaims any responsibility to provide the recipient of this presentation with updated or corrected information or statements. Past performance is not indicative of future results. For more information please refer to Important Disclosures.

Stay connected with the Insights Blog

Popular Articles


Diversity | Articles

Affirmative Action: Implications for Endowments, Foundations, and the Broader Industry

Affirmative action, a practice used since the 1960s to edge toward equity and address historical and ongoing injustice through higher education attainment, was struck down last month by the Supreme...
Investment Strategy | Articles

6 Keys to Choosing the Right Outsourced CIO

Today, few OCIOs that serve nonprofits are total institutional partners. Six questions can help you find one who takes a holistic approach. Not long ago, the definition and scope of an “Outsourced...
Investment Strategy | Articles

Challenges of Nonprofit Healthcare Organizations and Endowment Management

Facing cost pressures and a new regulatory regime, healthcare organizations — especially those in the small and mid-sized range — should consider adopting the principles of the endowment model....

Disclaimer

Certain information contained herein has been obtained from or is based on third-party sources and, although believed to be reliable, has not been independently verified. Such information is as of the date indicated, if indicated, may not be complete, is subject to change and has not necessarily been updated. No representation or warranty, express or implied, is or will be given by The Common Fund for Nonprofit Organizations, any of its affiliates or any of its or their affiliates, trustees, directors, officers, employees or advisers (collectively referred to herein as “Commonfund”) or any other person as to the accuracy or completeness of the information in any third-party materials. Accordingly, Commonfund shall not be liable for any direct, indirect or consequential loss or damage suffered by any person as a result of relying on any statement in, or omission from, such third-party materials, and any such liability is expressly disclaimed.

All rights to the trademarks, copyrights, logos and other intellectual property listed herein belong to their respective owners and the use of such logos hereof does not imply an affiliation with, or endorsement by, the owners of such trademarks, copyrights, logos and other intellectual property.

To the extent views presented forecast market activity, they may be based on many factors in addition to those explicitly stated herein. Forecasts of experts inevitably differ. Views attributed to third-parties are presented to demonstrate the existence of points of view, not as a basis for recommendations or as investment advice. Market and investment views of third-parties presented herein do not necessarily reflect the views of Commonfund, any manager retained by Commonfund to manage any investments for Commonfund (each, a “Manager”) or any fund managed by any Commonfund entity (each, a “Fund”). Accordingly, the views presented herein may not be relied upon as an indication of trading intent on behalf of Commonfund, any Manager or any Fund.

Statements concerning Commonfund’s views of possible future outcomes in any investment asset class or market, or of possible future economic developments, are not intended, and should not be construed, as forecasts or predictions of the future investment performance of any Fund. Such statements are also not intended as recommendations by any Commonfund entity or any Commonfund employee to the recipient of the presentation. It is Commonfund’s policy that investment recommendations to its clients must be based on the investment objectives and risk tolerances of each individual client. All market outlook and similar statements are based upon information reasonably available as of the date of this presentation (unless an earlier date is stated with regard to particular information), and reasonably believed to be accurate by Commonfund. Commonfund disclaims any responsibility to provide the recipient of this presentation with updated or corrected information or statements. Past performance is not indicative of future results. For more information please refer to Important Disclosures.