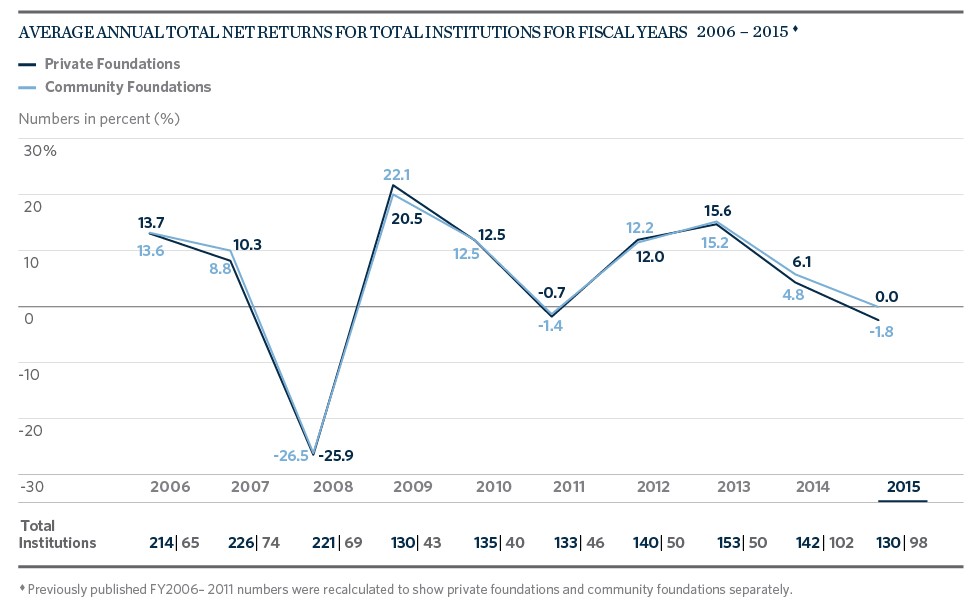
How long is the long term? A year ago, private and community foundations appeared to many observers to have recovered from the losses suffered in the 2008–09 global financial crisis. Double-digit investment returns had been reported in every year except FY2011 and FY2014, donations to community foundations had returned to their pre-crisis levels and the investment strategies of successful foundations were once again followed closely in the financial press.
One-year returns make headlines, but most investment officers consider a 10-year horizon to be a more appropriate period over which to judge success or failure. Somewhat longer than the typical seven-year market cycle, a 10-year period can even encompass two shorter market cycles; for this reason, it is felt by many to be a suitable measuring unit for judging whether an institution’s investment strategy has worked.
In this year’s Viewpoint we examine rolling 10-year returns since FY2010, the earliest year for which we have data. They paint a picture that is far from clear. Most foundations — even those that do not typically receive new infusions of cash — seek to maintain the purchasing power of their endowments after investment returns, spending and fees in order to deliver a constant — and, ideally, constantly growing — level of support to their grantees. But 10-year returns have consistently fallen below endowments’ long-term investment objectives — sometimes well below — even though the objectives have themselves tended to be somewhat reduced. And while the generally robust investment results of recent years have boosted rolling 10-year returns, last year’s lower investment returns and this year’s average return of 0.0 percent for private foundations and -1.8 percent for community foundations have served to reverse that trend.
During this same period, private and community foundations continued to increase their spending from their endowment in dollar terms.
This mismatch between lower but still aggressive investment goals, lower long-term returns and a continuation of generous spending practices may bode ill for the ability of foundations to maintain the purchasing power of their endowments in a future environment in which economic growth and investment results may be subdued in comparison with recent years.
We begin with an examination of private and community foundations’ investment goals. The long-term investment goal, expressed as a percentage, is typically built up from historical expectations of 2–3 percent for inflation, to which are added an amount for spending and 1 percent for fees. Under current regulations, private foundations must, on average, make qualifying distributions of at least 5 percent of their assets, while community foundations have more flexibility in determining their spending rate. Over the last seven years, private foundations have reported long-term return objectives falling between 7.1 and 8.3 percent, while community foundations’ long-term return objectives have been somewhat lower, falling between 7.0 and 7.9 percent. 1
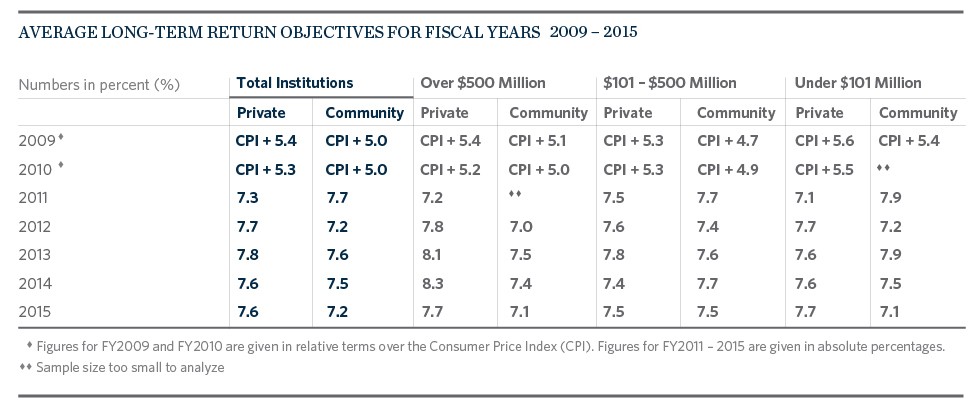
Larger private foundations tend to have higher long-term investment goals than smaller ones, while among community foundations there is no clear relationship between endowment size and long-term investment goals. As a general matter, it is thought that institutions with larger endowments can set higher investment goals due to, among other things, the greater average expertise of their investment committees, their higher degree of portfolio diversification, larger numbers of expert staff, access to top-performing managers and other institutional resources that tend to lead to higher investment performance. For example, smaller private foundations’ long-term goals have at times been 50 to 70 basis points (0.5 to 0.7 percentage points) lower than those of their larger peers.
It would be reasonable to assume that investment returns should bear some relationship to long-term return goals. But, although foundations have on average reported double-digit returns over the last seven years (with the exception of the slight loss in FY2011 and mid-single-digit returns in FY2014), long-term return goals have generally been declining since FY2009 and are now some 20 to 50 basis points lower than they were in that year.
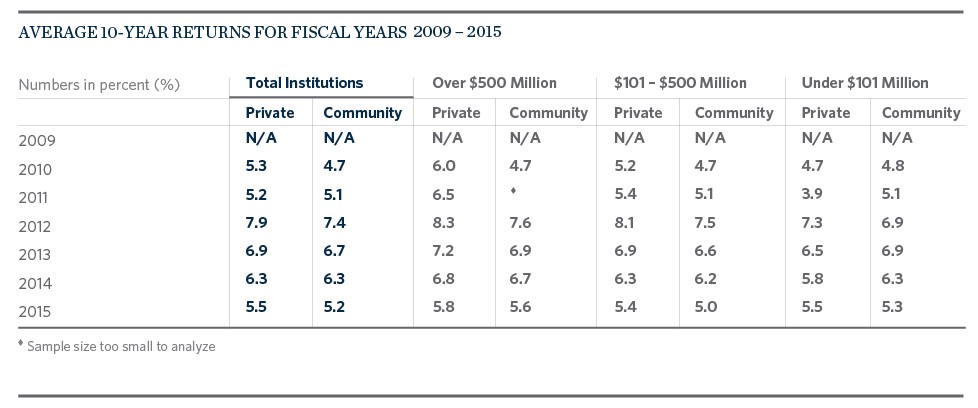
If we look beyond the one-year return numbers, we can see that this decline in long-term goals may be due to the persistence of lower long-term returns. During nearly all of the last six fiscal years, 2 reported 10-year returns have been well below the 7–8 percent long-term investment goals reported by the same institutions. In other words, even during the recovery period, foundations have failed to meet their own investment objectives.
Viewed in historical terms, the 10-year returns measured in FY2010 and FY2011 encompassed not only the global financial crisis but also the negative returns that resulted from the bursting of the tech bubble in FY2001–2002. Ten-year returns for the largest private and community foundations remained higher and recovered more quickly, but it was not until FY2012 that they rose above 7.5 percent. The two smaller size groups exhibited a similar pattern with slightly lower returns, but for the smallest group of community foundations, 10-year returns never breached the 7 percent level.
Perhaps more important, FY2014 and FY2015’s lower consecutive one-year returns have brought an end to the recovery in longer-term returns as well. From an overall average of 7.9 percent and 7.4 percent, respectively, in FY2012, 10-year average returns sank 240 basis points for private foundations and 220 basis points for community foundations to 5.5 percent and 5.2 percent, respectively, in FY2015. This average was paralleled by declines in each size group ranging from 160 to 270 basis points.
If, as many economists believe, the next five years will be characterized by lower global growth and correspondingly lower investment returns than in the past, 10-year average returns may continue to decline.
What are the implications of this mismatch between goals and experience for private and community foundations’ ability to advance their missions? One way to answer this question is to examine whether spending patterns have changed in the period under review.
Investment returns vary from year to year, but most foundations seek to minimize volatility in the annual amount they draw from their endowments. This may be because grantmaking practices, which often contemplate a multi-year horizon, require a certain amount of stability for planning purposes. While private foundations must, as noted, spend a minimum of 5 percent on average each year, over one-third of private foundations and a large majority of community foundations rely on a multi-year smoothing rule first proposed in the 1970s, pursuant to which spending is calculated by applying a percentage—the “policy rate”— to a figure calculated by taking the average market value of the endowment at the beginning of the preceding three years or twelve quarters.3
It is striking how stable this practice has remained over the last seven years. Among community foundations as a whole, use of the moving average method has generally been in the mid- to high 80 percent range during the entire period. Even among the largest community foundations, many of which may choose other methodologies to calculate spending, between 50 and 90 percent have reported using a moving average method. Among the other two community foundation size cohorts, the moving average method is never used by less than 74 percent of the group, and usage is frequently above 80 percent.
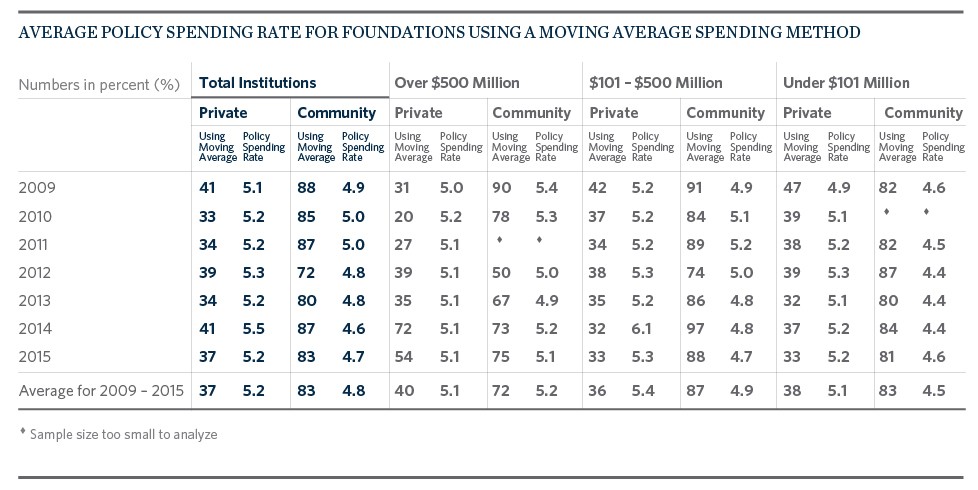
Among private foundations, use of a moving average methodology is understandably less common, but it has averaged between 31 and 39 percent, with few exceptions, over the last seven years across all size groups.
Just as remarkable is the stability in the policy rate that is applied by community and private foundations to the average endowment value. Among private foundations it has, with few exceptions, ranged from 5.1 to 5.3 percent. For community foundations, it has consistently remained between 4.4 and 5.4 percent across all size cohorts. On average, the rate has increased by 10 to 20 basis points among private foundations over the last seven years. Among community foundations it has declined very slightly by 20 to 30 basis points among the larger size cohorts; among the smallest cohort it has remained stable.
Thus, despite the fact that long-term investment returns have failed to meet long-term investment goals, private and community foundations’ spending rates and formulas have not changed materially and have, in fact, continued to be calculated in the same way.
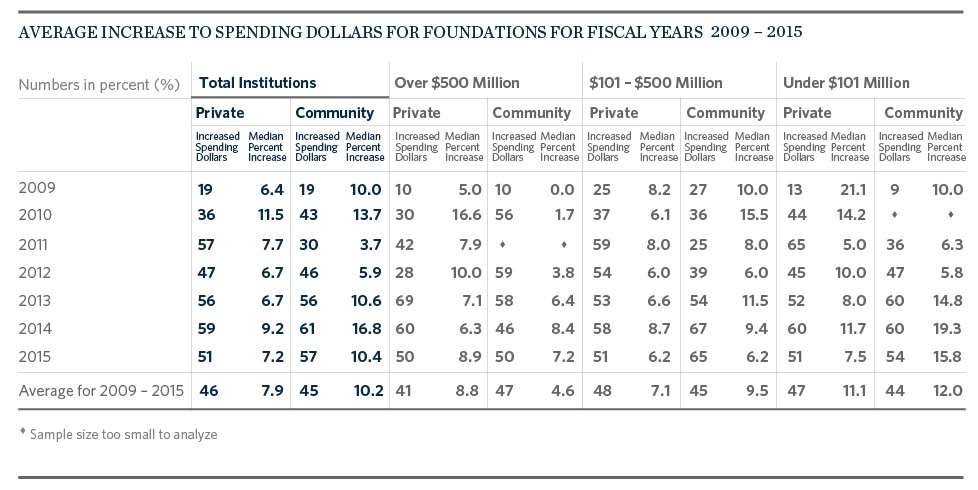
This circumstance can be seen more clearly in the proportion of participating foundations that increase their spending in dollar terms from year to year. In every year except FY2009, an average of between 36 and 59 percent of private foundations, and between 30 and 61 percent of community foundations reported that they increased their endowment spending in dollar terms. Even in that catastrophic year, fully 19 percent of both types of foundation increased their dollar spending, ranging from 9 percent of the hard-hit smallest community foundations to 27 percent of community foundations with endowment assets between $101 and $500 million. Private foundations exhibited a similar pattern.
Nor were these increases trivial. The lowest median increase for private foundations that raised dollar spending was 6.4 percent, again in FY2009, but the highest was the following year, when private foundations as a group increased dollar spending by 11.5 percent. Over the seven-year period an average of 46 percent of private foundations increased dollar spending from year to year, and the average of the median increases was 7.9 percent, well in excess of inflation.
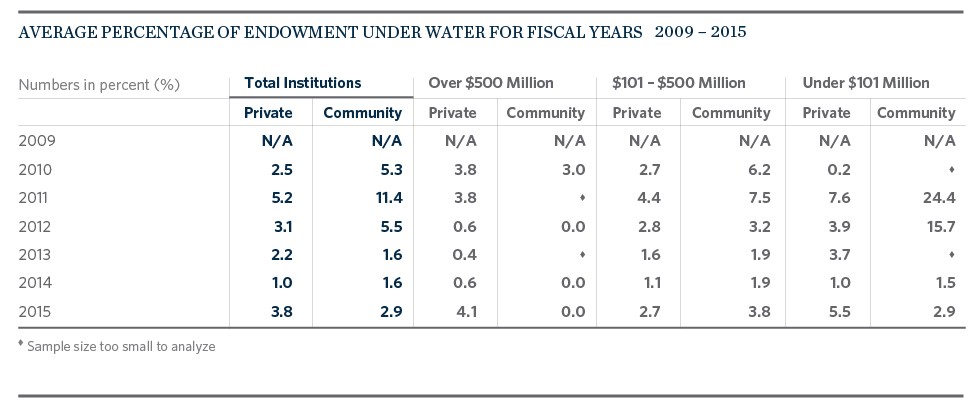
Among community foundations, a less distinct pattern obtained. Here, while spending grew strongly in FY2009 and FY2010, the following two years, which were respectively characterized by negative investment returns and the Greek euro crisis, saw comparatively subdued spending growth. In each of the following three years, however, average spending increased by double digits. This comparative volatility may be related to the presence of underwater funds at some community foundations, which we discuss below, and to the falloff in giving that occurred in the aftermath of the financial crisis. These circumstances may have caused community foundations’ fiduciaries to increase spending at a slower rate in FY2011 and FY2012 as they acted to preserve the value of their endowments to ensure their ability to make continued grants in the future. It remains worth noting, however, that a substantial plurality of community foundations did increase dollar spending in each of these difficult years.
It should also be observed that smaller private and community foundations have increased their dollar spending at a higher percentage rate overall than larger ones. This should not be surprising, since the larger institutions began with higher dollar amounts and any increases, while substantial in dollar terms, would likely be smaller in percentage terms.
As we have noted, increases in dollar spending were doubtless also constrained by the presence in many endowments of underwater funds — funds whose value had fallen below the “historic dollar value” that they had when created. Often relatively new, these funds lacked a cushion of accumulated but unspent gains and, in most states, the law that prevailed at the time prohibited or limited spending from such funds. It is in this light that the lower incidence of higher dollar spending by community foundations in FY2011–2012 may also be viewed. This dilemma was a spur to the enactment throughout the nation of the Uniform Prudent Management of Institutional Funds Act (UPMIFA), which had been proposed in 2006 but acquired new urgency as nonprofits of all types found themselves constrained by law from drawing on their endowments to support their missions.
We invest for the long term, but we live day to day. The fact that private and community foundations have continued to sustain their spending rates and have — aided by a recovery in gifts and donations to community foundations — increased their spending in dollar terms is laudable. But is it sustainable? If long-term returns continue to be lower than assumed by institutions’ long-term investment goals, and if spending continues at rates that are not supported by those returns, then the logical result will be a gradual erosion of purchasing power due to inflation and overspending. UPMIFA assumes that, over the long term, donors expect fiduciaries to maintain the purchasing power of their endowed gifts. If higher spending persists — or is demanded by new legislation — and investment returns do not recover sufficiently to fund this higher spending, it is not difficult to imagine some donors deciding against endowed gifts in favor of annual charitable gifts that do not necessarily ensure the long-term support of a charitable organization.
The judgment of success or failure for any endowed institution intended by its founders to last into perpetuity lies, ultimately, in the balance between the success of its mission in the present age and its ability to conduct that same mission in the future. Financial resources are a key part of that mission. As the world economy enters a period in which growth may be subdued, the striking of an appropriate balance becomes more important than ever.
1 In most years, we have asked CCSF participants to express their long-term investment goals as an absolute percentage. In FY2009 and 2010, we asked them to express their goals in terms of a margin over the Consumer Price Index (CPI). The two methods, as can be seen, yield essentially the same answer.
2 We began gathering information about 10-year returns in FY2010.
3 Much less frequently, five years or twenty quarters may be used; other periods, such as seven or even ten years, are used by a small number of institutions.