| Articles

Taking a Regional Perspective

April 12, 2023 |
2 minute read
|

The Commonfund Benchmarks Study® of Independent Schools (CSIS) report provides and analysis of the investment and governance policies and practices of U.S. independent day and boarding schools. For the first time, the FY2022 CSIS presented a regional breakout of data that has previously been collected and only reported at the national level. The differences among the geographies is not profound, but there are wrinkles that are worth noting.

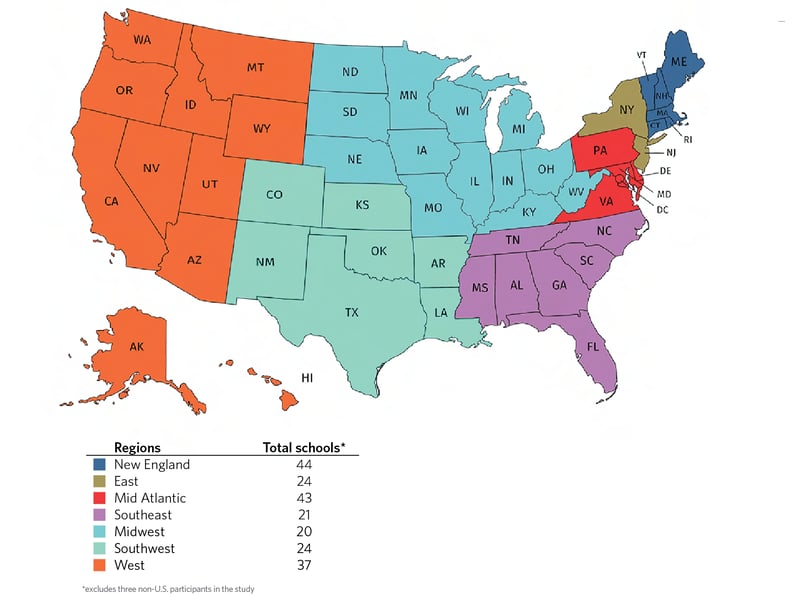
The National Association of Business Officers (NBOA) segments the nation into seven regions shown in the map below. For this analysis the data were segmented along the same lines and the focus was on selected topline findings: investment returns, asset allocation, policy spend rate, new gifts to endowment, and support for the operating budget from annual giving and from the endowment. Note: Total Schools for all tables included in the Regional Analysis section only includes those 213 schools that are based in the U.S.  Two schools from Canada and one from Singapore are not included here.
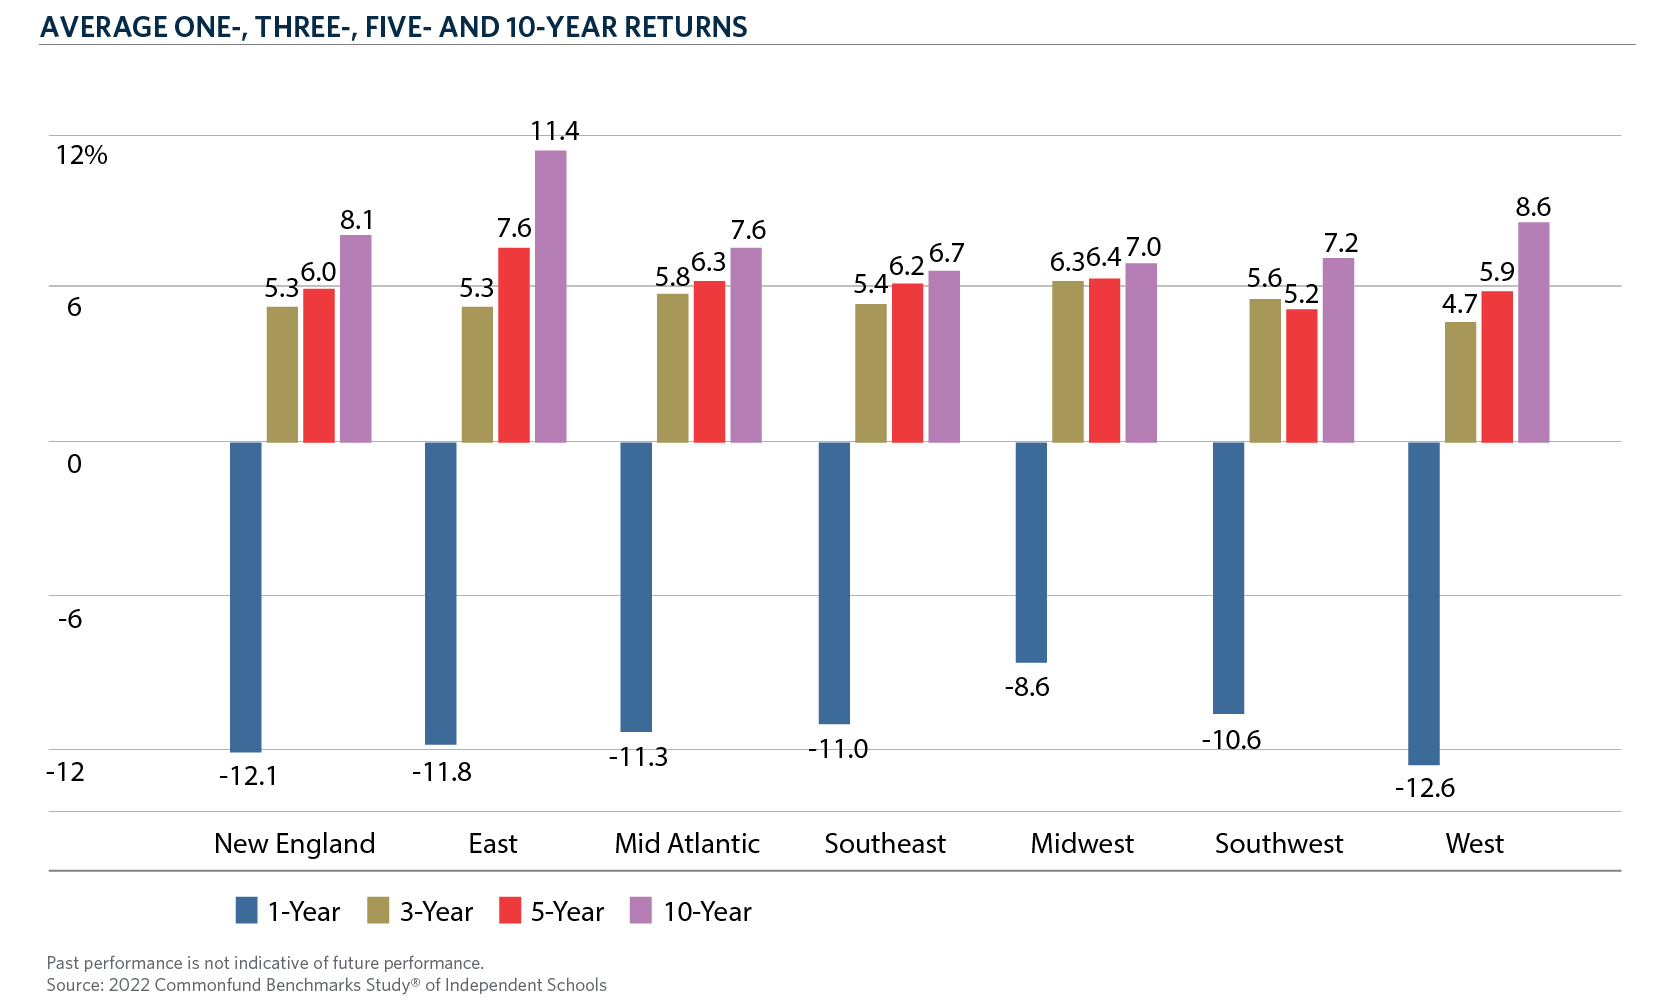
RegionMAPwLegend_Web Chart

Investment Returns

On average, participating schools in every region reported negative returns in FY2022, but the Midwest fared the best on a relative basis with a return of -8.6 percent. All other returns were losses in the lower double digits. Long term, however, schools in the East region produced the best 10-year return at 11.4 percent, 280 basis points annually ahead of 8.6 percent in the West region.
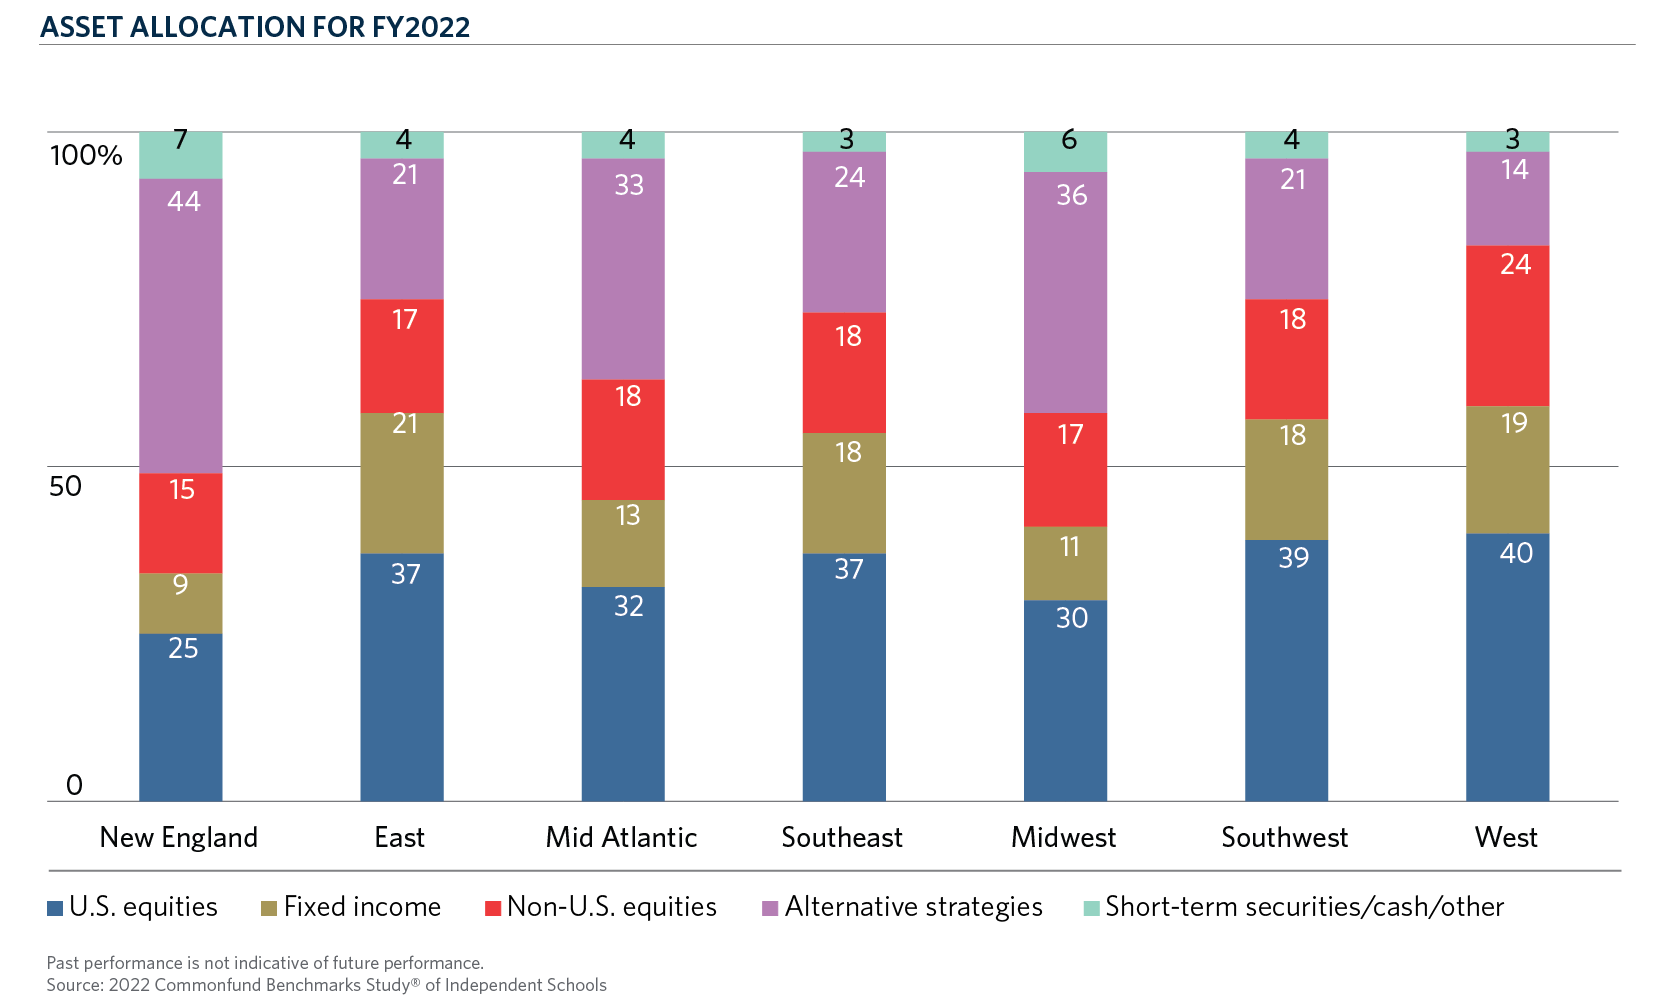
CH2-RegionReturns_Web Chart

Asset Allocation

As is to be expected, there were some fairly wide variations across the five asset classes/strategies and seven regions. One of the most interesting was schools in the West region—home of Silicon Valley and other tech hot spots—reporting the lowest average allocation to alternative strategies, 14 percent. The highest was 44 percent in the New England region. The West did have the largest allocations to traditional equities, however—namely, U.S. and non-U.S. equities. Schools in the East had the largest fixed income allocation, 21 percent, while New England schools had the smallest, 9 percent.

CH3-RegionAA_Web Chart

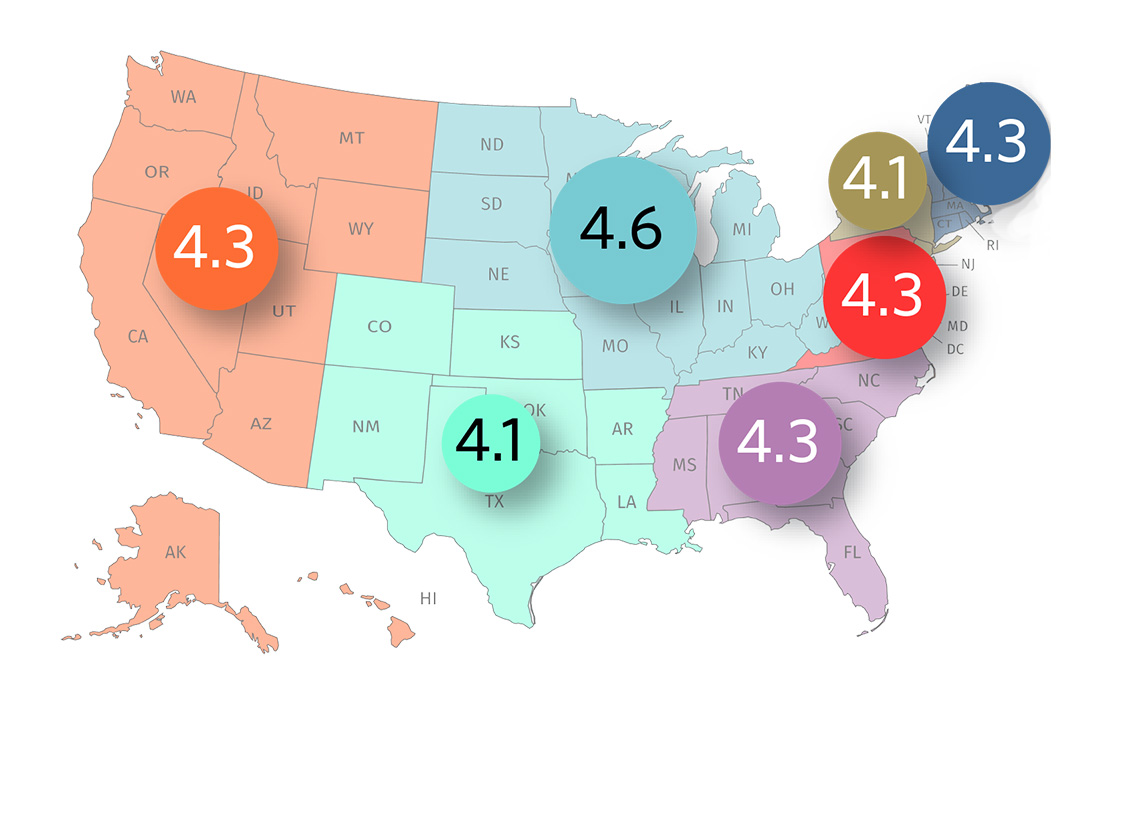
Policy Spending Rate

In general, stated policy spending rates were fairly consistent across regions, the one standout being a higher 4.6 percent rate in the Midwest region. The Midwest region was also distinguished by having the lowest share of schools with a spending policy, 90 percent. The next-closest were 92 percent of schools in the West and 93 percent of schools in the Mid-Atlantic. Only the East region had 100 percent of participating institutions with a spending policy.

AVERAGE STATED POLICY SPENDING RATE FOR FY2022
Numbers in percent

NBOA Regional Map-SpendRayr

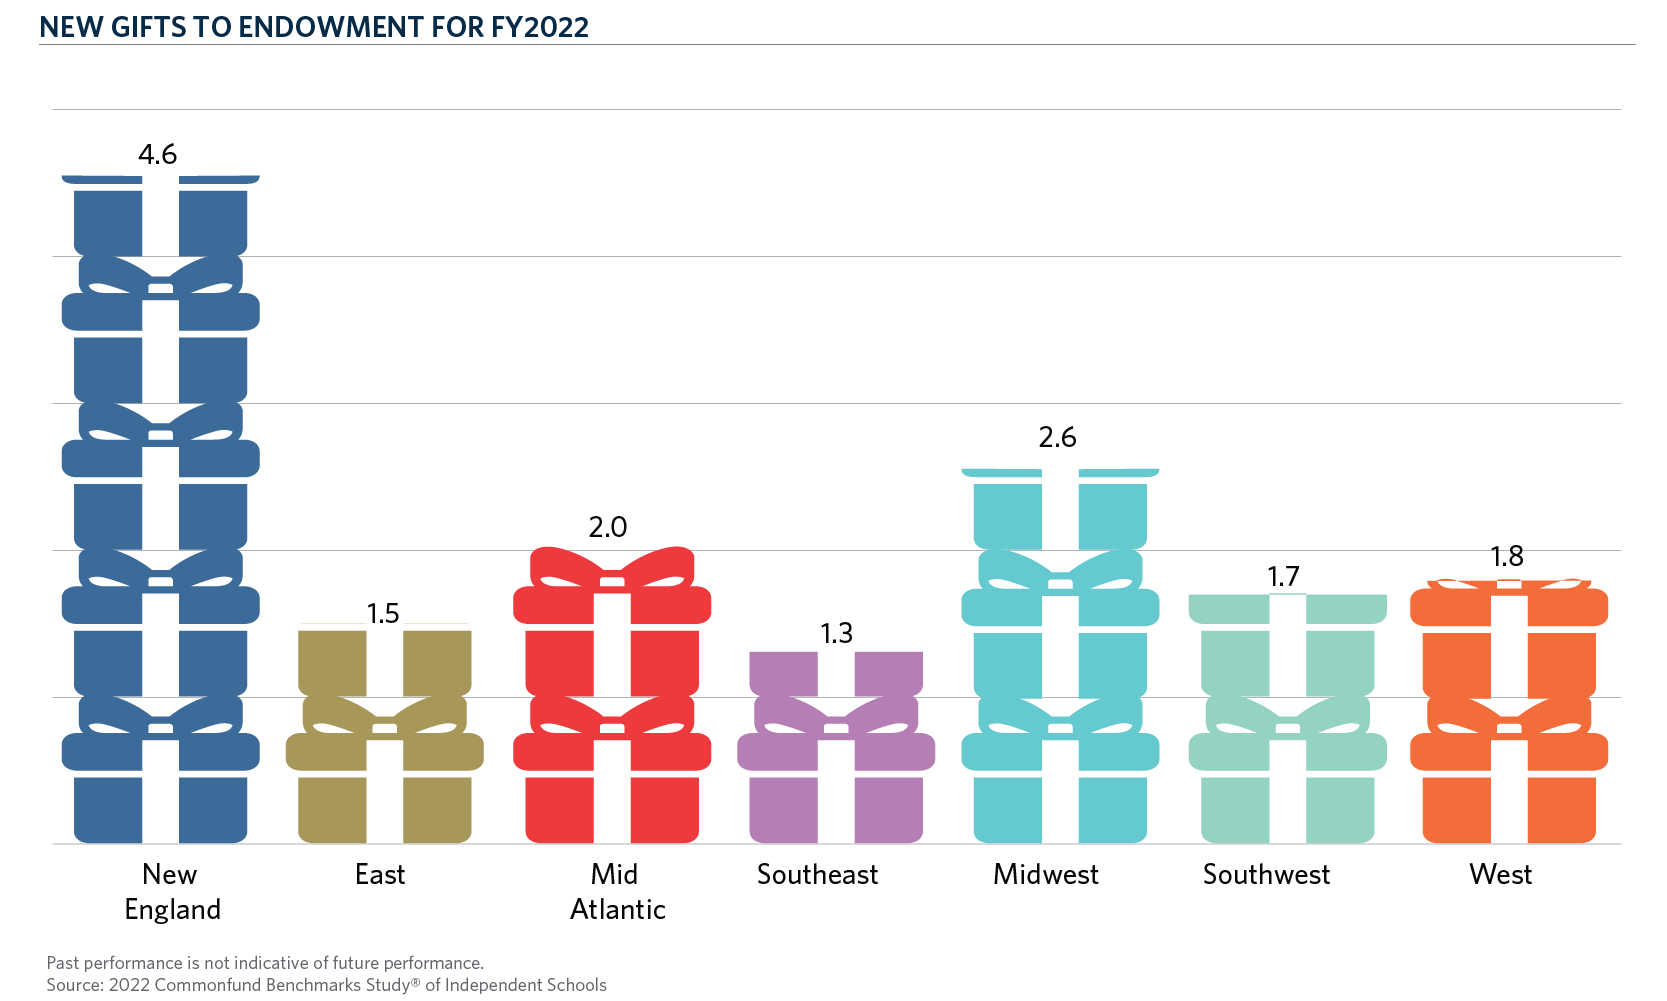
New Gifts to Endowment

The New England region stood out for having by far the highest average new gift to endowment, $4.6 million. The lowest were $1.3 million in the Southeast and $1.5 million in the East. After New England, the highest average new gift to endowment was $2.6 million in the Midwest.


CH4-RegionGifts_Web Chart


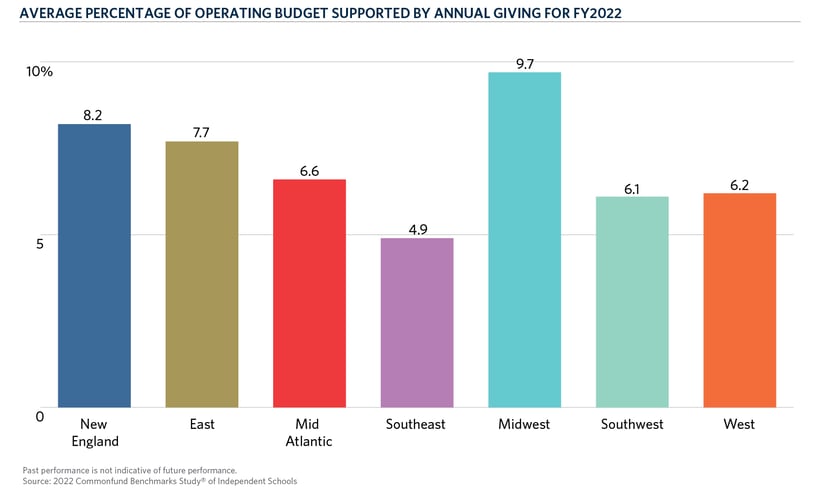
Operating Budget Support from Annual Giving

The Midwest reported the highest average and median percentages of the operating budget supported by annual giving, 9.7 percent and 7.6 percent, respectively. After that, the second highest was New England at 8.2 percent and 7.2 percent, respectively.

CH5-RegionOperBudgeGiving_Web Chart

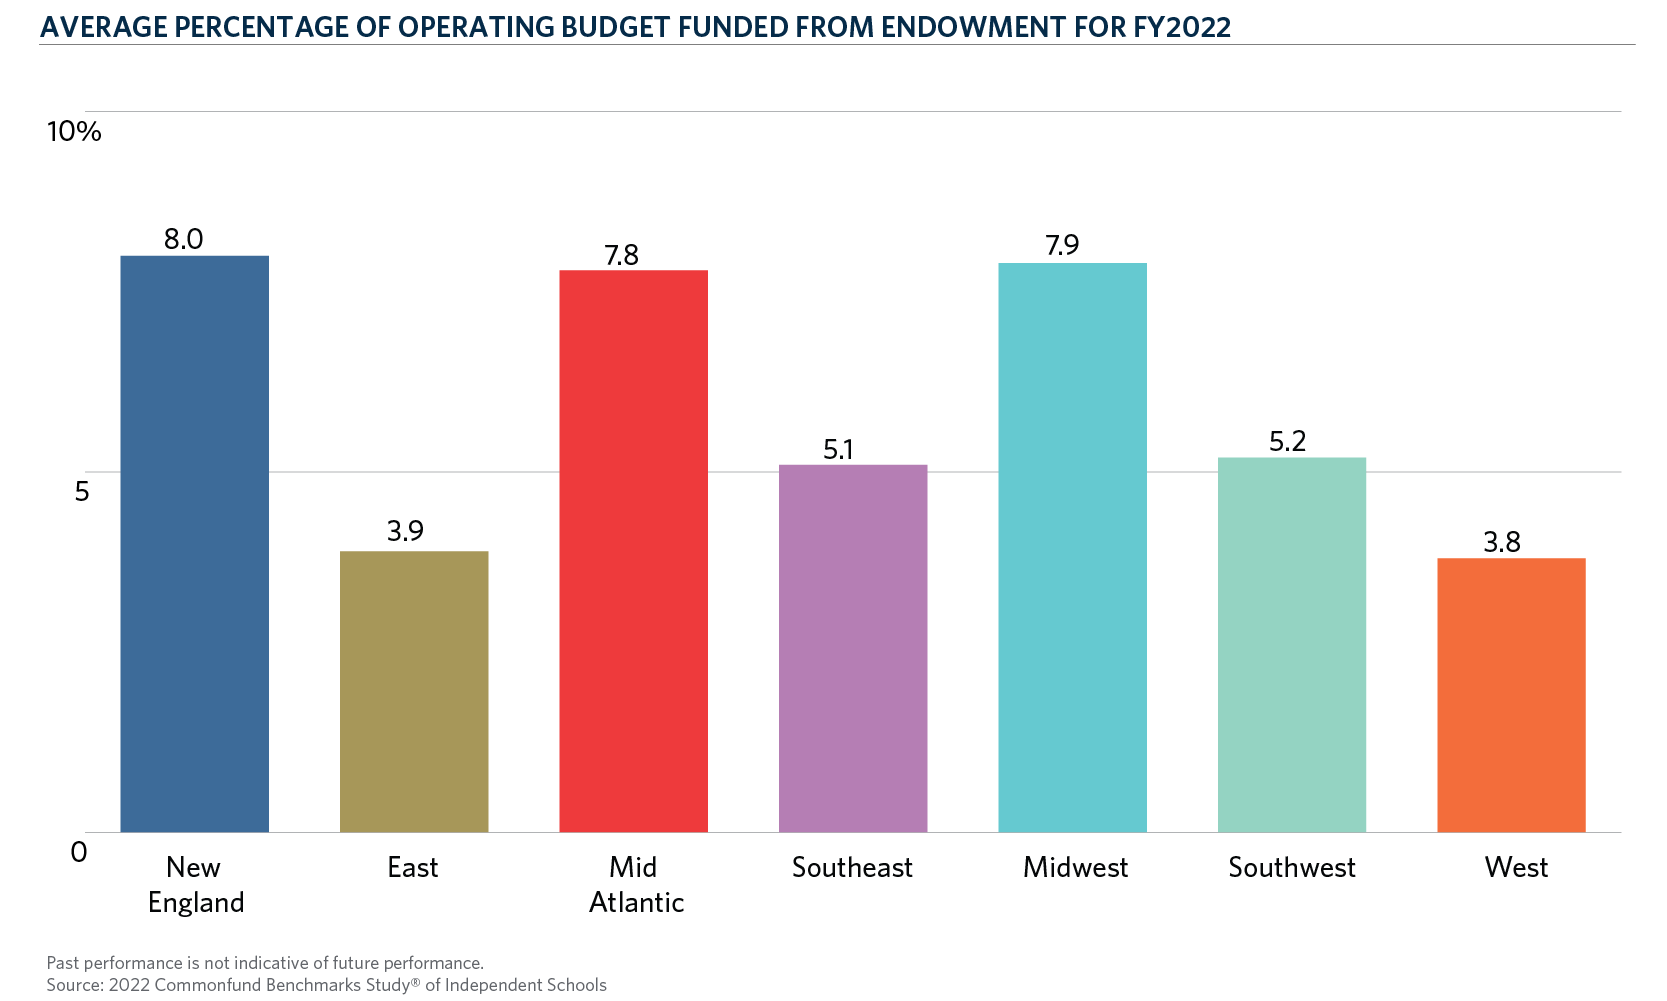
Operating Budget Funded from Endowment

Schools in three regions were close in the share of their operating budget funded by the endowment: 8.0 percent of the budget for schools in New England, 7.9 percent for schools in the Midwest and 7.8 percent for schools in the Mid-Atlantic. The lowest average share of the operating budget funded through endowment was 3.8 percent in the West. 

CH6-RegionOperBudgeEnd_Web Chart

Request your copy of the CSIS for FY2023

Commonfund Institute

Author

Commonfund Institute

Disclaimer

Certain information contained herein has been obtained from or is based on third-party sources and, although believed to be reliable, has not been independently verified. Such information is as of the date indicated, if indicated, may not be complete, is subject to change and has not necessarily been updated. No representation or warranty, express or implied, is or will be given by The Common Fund for Nonprofit Organizations, any of its affiliates or any of its or their affiliates, trustees, directors, officers, employees or advisers (collectively referred to herein as “Commonfund”) or any other person as to the accuracy or completeness of the information in any third-party materials. Accordingly, Commonfund shall not be liable for any direct, indirect or consequential loss or damage suffered by any person as a result of relying on any statement in, or omission from, such third-party materials, and any such liability is expressly disclaimed.

All rights to the trademarks, copyrights, logos and other intellectual property listed herein belong to their respective owners and the use of such logos hereof does not imply an affiliation with, or endorsement by, the owners of such trademarks, copyrights, logos and other intellectual property.

To the extent views presented forecast market activity, they may be based on many factors in addition to those explicitly stated herein. Forecasts of experts inevitably differ. Views attributed to third-parties are presented to demonstrate the existence of points of view, not as a basis for recommendations or as investment advice. Market and investment views of third-parties presented herein do not necessarily reflect the views of Commonfund, any manager retained by Commonfund to manage any investments for Commonfund (each, a “Manager”) or any fund managed by any Commonfund entity (each, a “Fund”). Accordingly, the views presented herein may not be relied upon as an indication of trading intent on behalf of Commonfund, any Manager or any Fund.

Statements concerning Commonfund’s views of possible future outcomes in any investment asset class or market, or of possible future economic developments, are not intended, and should not be construed, as forecasts or predictions of the future investment performance of any Fund. Such statements are also not intended as recommendations by any Commonfund entity or any Commonfund employee to the recipient of the presentation. It is Commonfund’s policy that investment recommendations to its clients must be based on the investment objectives and risk tolerances of each individual client. All market outlook and similar statements are based upon information reasonably available as of the date of this presentation (unless an earlier date is stated with regard to particular information), and reasonably believed to be accurate by Commonfund. Commonfund disclaims any responsibility to provide the recipient of this presentation with updated or corrected information or statements. Past performance is not indicative of future results. For more information please refer to Important Disclosures.

Stay connected with the Insights Blog

Popular Articles


Diversity | Articles

Affirmative Action: Implications for Endowments, Foundations, and the Broader Industry

Affirmative action, a practice used since the 1960s to edge toward equity and address historical and ongoing injustice through higher education attainment, was struck down last month by the Supreme...
Investment Strategy | Articles

6 Keys to Choosing the Right Outsourced CIO

Today, few OCIOs that serve nonprofits are total institutional partners. Six questions can help you find one who takes a holistic approach. Not long ago, the definition and scope of an “Outsourced...
Investment Strategy | Articles

Challenges of Nonprofit Healthcare Organizations and Endowment Management

Facing cost pressures and a new regulatory regime, healthcare organizations — especially those in the small and mid-sized range — should consider adopting the principles of the endowment model....

Disclaimer

Certain information contained herein has been obtained from or is based on third-party sources and, although believed to be reliable, has not been independently verified. Such information is as of the date indicated, if indicated, may not be complete, is subject to change and has not necessarily been updated. No representation or warranty, express or implied, is or will be given by The Common Fund for Nonprofit Organizations, any of its affiliates or any of its or their affiliates, trustees, directors, officers, employees or advisers (collectively referred to herein as “Commonfund”) or any other person as to the accuracy or completeness of the information in any third-party materials. Accordingly, Commonfund shall not be liable for any direct, indirect or consequential loss or damage suffered by any person as a result of relying on any statement in, or omission from, such third-party materials, and any such liability is expressly disclaimed.

All rights to the trademarks, copyrights, logos and other intellectual property listed herein belong to their respective owners and the use of such logos hereof does not imply an affiliation with, or endorsement by, the owners of such trademarks, copyrights, logos and other intellectual property.

To the extent views presented forecast market activity, they may be based on many factors in addition to those explicitly stated herein. Forecasts of experts inevitably differ. Views attributed to third-parties are presented to demonstrate the existence of points of view, not as a basis for recommendations or as investment advice. Market and investment views of third-parties presented herein do not necessarily reflect the views of Commonfund, any manager retained by Commonfund to manage any investments for Commonfund (each, a “Manager”) or any fund managed by any Commonfund entity (each, a “Fund”). Accordingly, the views presented herein may not be relied upon as an indication of trading intent on behalf of Commonfund, any Manager or any Fund.

Statements concerning Commonfund’s views of possible future outcomes in any investment asset class or market, or of possible future economic developments, are not intended, and should not be construed, as forecasts or predictions of the future investment performance of any Fund. Such statements are also not intended as recommendations by any Commonfund entity or any Commonfund employee to the recipient of the presentation. It is Commonfund’s policy that investment recommendations to its clients must be based on the investment objectives and risk tolerances of each individual client. All market outlook and similar statements are based upon information reasonably available as of the date of this presentation (unless an earlier date is stated with regard to particular information), and reasonably believed to be accurate by Commonfund. Commonfund disclaims any responsibility to provide the recipient of this presentation with updated or corrected information or statements. Past performance is not indicative of future results. For more information please refer to Important Disclosures.