In this Council on Foundations-Commonfund Study of Foundations viewpoint, it's about analyzing and interpreting the data we've collected. What do they tell us? What trends are emerging? How are private and community foundations alike and how do they differ? We have identified five areas where there are gaps between what the data say foundations are doing and what they may want to do based on generally accepted principle of endowment management.
In other words, there are instances where the data suggest there is a gap between the descriptive and the prescriptive. The descriptive is what foundations are actually doing. The prescriptive is what they may want to think about doing in order to elevate their governance and endowment management practices. Taking a closer look at the body of data for this year’s CCSF, there are five areas where these gaps seem to be well defined and worthy of consideration by foundation decision-makers.
Long-Term Return Objectives
The first is the matter of long-term return objectives or, rather, the lack of them. This year, 18 percent of private foundations and 24 percent of community foundations don’t have long-term investment objectives, gave no answer or were uncertain about them, indicating that if such an objective exists, it is foggy, ill-defined or poorly communicated. Going back a few years, to 2014, the data haven’t changed very much: That year 23 percent of private foundations and 24 percent of community foundations said they didn’t have a long-term return objective (or didn’t answer or were uncertain). When the data are parsed by size of foundation, larger foundations were somewhat more likely to articulate long-term return objectives than smaller foundations, and across the size spectrum community foundations were less likely to have return objectives than private foundations.
This begs the question: How do foundations establish an asset allocation policy and support a policy spending rate without having a long-term return target? These are two central pillars of an effective investment policy statement (IPS). The relevance of—if not the outright need for—a long-term investment objective takes on a sense of urgency when one considers that foundations’ long-term investment performance does not appear to be delivering the returns necessary to cover annual spending and inflation. As documented in this Study, 10-year trailing returns jumped by more than 300 basis points this year only because 2009 returns were dropped from the calculation. But five-year annualized returns were just 4.7 percent for private foundations and 3.9 percent for community foundations. Three-year returns were stronger, but below what is needed to cover a 5.0 percent effective spending rate—the minimum for private foundations—plus inflation and investment management costs (not to mention an increment for future growth).
The selection of a return objective is also a major consideration in establishing the portfolio’s risk profile. One asset allocation mix may offer perceived safety to a board with a low tolerance for risk—but not support its spending policy. Another asset mix may be overly concentrated and produce top-tier returns when the allocation aligns with the market environment but be overly susceptible to shifts in sentiment. Boards are highly unlikely to implement a proposed asset allocation without understanding the risk-adjusted return it is projected to produce.
Risk Not Defined in the IPS
Risk management brings us to the second point where actions speak louder than data: Risk—important though it may be—often goes undefined in foundations’ investment policy statements. For 2018, 45 percent of private foundations and 28 percent of community foundations said risk is not defined in their IPS. Another 5 percent and 12 percent, respectively, gave no answer or were uncertain.
Even when risk is defined, the definition can be vague; too many foundations address risk with language that states something to the effect of “appropriate risk control measures” will be implemented. This observation is supported by the fact that 23 percent of private foundations and 25 percent of community foundations reported that they do not employ specific risk metrics (such as standard deviation, Sharpe ratio, value at risk or portfolio illiquidity).
At the same time, investment committees do appear to acknowledge that risk management is important. Seventy-eight percent of private foundations and 80 percent of community foundations participating in this year’s CCSF said their investment committee spent time discussing risk management in 2018. Perhaps these discussions will lead those who don’t have a definition of risk in their IPS to conclude that crafting one is important and necessary.
Spending Rate Methodology
Another area warranting attention is spending policy. Thirty-eight percent of private foundations and 79 percent of community foundations use the “percent of a moving average of endowment value over X years or quarters” as the basis for their spending methodology, making it by far the most frequently-used spending policy among community foundations. This methodology is exceeded among private foundations only by the 70 percent whose policy is to meet the Internal Revenue Service minimum spending rate of 5.0 percent. Notwithstanding the IRS minimum spending requirement, we observe that too few private foundations consider spending policies that include effective mechanisms to smooth distributions. This is particularly important for foundations that have multi-year grants or where volatility of distributions can adversely impact a foundation’s mission.
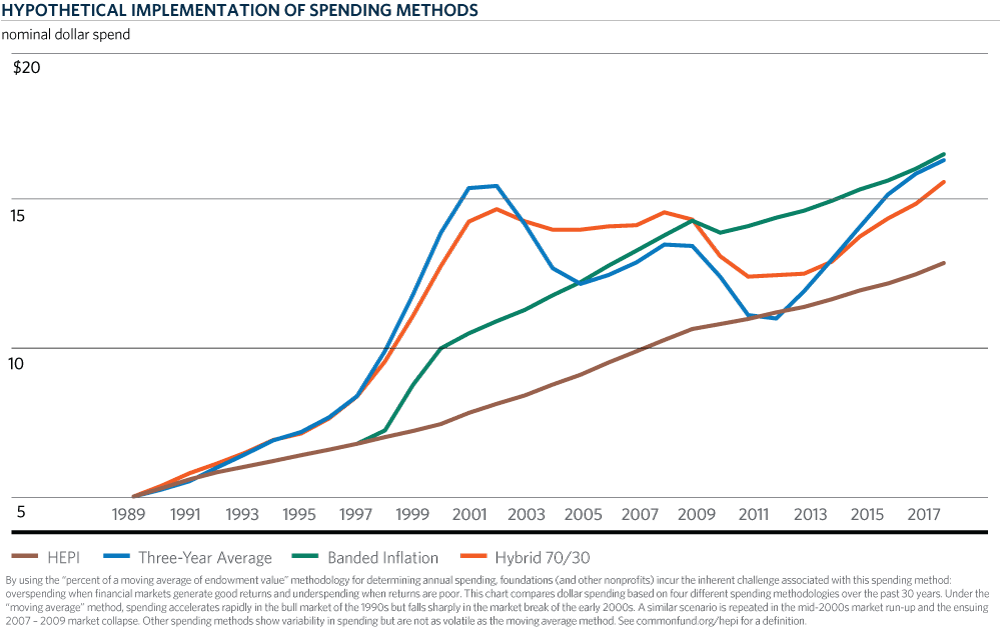 Returning to the percentage of a moving average method of calculating spending, we recognize that it is the most widely used methodology across the nonprofit sector, to include not only foundations but also educational endowments and nonprofit healthcare organizations. That doesn’t mean this approach is without shortcomings, however. Specifically, while this method is intended to smooth spending it still can lead to overspending in periods of good returns and underspending when returns are flat or negative. The chart shows how spending would have grown in the 1990s using the three-year moving average method before falling precipitously in the early 2000s. The same pattern occurred in 2003–2006 before the sharp decline in 2007–2009. The point: Once institutions get accustomed to the higher spend in real dollars it’s hard to reduce.
Twenty-percent of private foundations and 12 percent of community foundations decide on an appropriate rate each year. This allows trustees to weigh many factors—investment returns, inflation, the needs of the foundation and the health of the economy—but it also makes decision-makers susceptible to short-term pressures like those imposed by a nasty bear market.
Other methodologies do a better job of smoothing spending. For instance, the so-called Yale/Stanford rule is a weighted average or hybrid approach. This can be thought of as a middle road between the moving average and the banded inflation spending methods. Typically employed by more endowment-dependent institutions, the Yale/Stanford rule is a weighted average methodology in which the predominant weighting, for example, 80 percent, is given to the banded inflation method, with the remainder, 20 percent, calculated according to the moving average method. This technique results in a reduced volatility of spending due to its lower reliance on market value-based calculations, while honoring the fact that market values do have an influence on the ability to spend.
We are not advocating for one spending policy over another; rather it is important for foundations to actively consider methodologies, not just spending rates. The various spending methodologies have their own strengths and weaknesses. We also understand that there are programmatic and operational inputs that inform a foundation’s spending policy. How much or how little a foundation depends on its endowment is a major factor. Generally, private foundations are not engaged in fund raising and rely entirely on their endowment to fund operations and grants; community foundations, on the other hand, do raise funds and that reduces dependence on their endowment.
Diversification Among Alternative Investment Strategies
Asset class/investment strategy diversification is universally recognized as a primary characteristic of a sound investment portfolio; it’s sometimes referred to as “the only free lunch” in investment management. Foundations participating in the CCSF generally have well diversified portfolios. But there is an exception, and that is another area warranting a closer look at a gap the data highlight. We are talking about diversification within the largest single portfolio allocation for foundations of both types—alternative investment strategies. In this case, the benefit of diversification is somewhat negated by concentration.
Our focus is on the overweight to marketable alternative strategies (hedge funds, absolute return, market neutral, long/short, 130/30, event-driven and derivatives). On a dollar-weighted basis, marketable alternative strategies account for one-third of private foundations’ alternative strategies allocation and well over half that of community foundations. The specific weights are 15 percent out of a 46 percent allocation among private foundations and 15 percent out of a 26 percent allocation among community foundations. On an equal-weighted basis, the concentration is even greater: Among private foundations, marketable alternatives account for 38 percent of private foundations’ alternatives allocation and 50 percent of community foundations’ allocation. This means that smaller foundations are more heavily concentrated in marketable alternative strategies than larger foundations and thus even less diversified.
This concentration proved costly in 2018. Private foundations reported that their marketable alternatives allocation lost 2.1 percent while community foundations reported that the allocation declined 1.5 percent. Some hedge fund strategies, e.g., long/short equity, correlate too closely with publicly traded equity markets, so there is little to no diversification benefit—only expensive equity exposure.
At the other extreme of allocations within alternative investment strategies, venture capital accounted for 10 percent out of a 46 percent alternative allocation among private foundations—a reasonably-sized commitment—but only 1 percent out of a 26 percent allocation among community foundations. After marketable alternatives and private equity, the allocations to other strategies were de minimis—including private real estate, energy and natural resources, commodities and managed futures, private credit, and distressed debt.
The gap may be a lack of quantitative rigor that foundations and their advisors apply to defining the role that alternative strategies play in long-term portfolios – and the size of those allocations in long-term asset allocations. Are you asking such questions as the following? Are hedge funds effectively diversifying market exposure and serving as a unique source of excess return? Are illiquid strategies generating a consistent premium above returns in public markets and to what extent can you “give up” liquidity for that return? Are real assets providing yield and diversifying benefits unique from equity and bond allocations?
Change may be on the horizon. In a new question this year, we inquired about portfolio changes that foundations expect to make over the next three years. Slightly more private and community foundations indicated they plan to decrease their hedge fund allocation than indicated they plan to increase it. Based on foundations’ expected changes, the allocation to private credit should rise measurably over the next three years, as should the allocation to private real estate, venture capital and distressed debt.
Responsible Investing
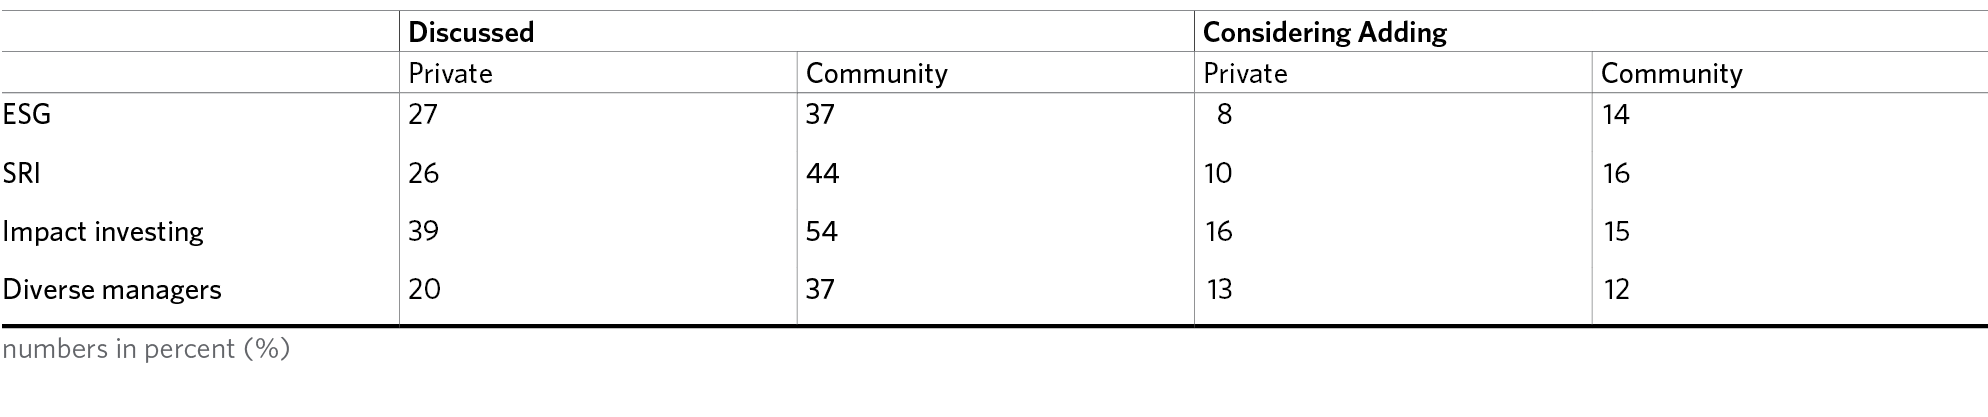
In this discussion of the distance between data and action that the data reveal, we turn to our last topic: responsible investing. Here, the data show that this is a topic frequently discussed yet implemented, even partially, infrequently. Discussions such as these are a good thing—airing topics such as this is exactly what investment committees should be doing … and there is no mandate that these discussions must be acted upon. But, as we shall see, this pattern has persisted for a few years. The following table highlighting data from the 2018 CCSF points to this gap between discussion and potential action:
Responsible Investing Discussed vs. Considering Adding in Next 12 Months
What’s interesting about discussions of responsible investing is that they weren’t just a topic for discussion and relatively little action in 2018, but for a few years now. Using data from the three previous Studies, we find the following:
Considering Changing Investment Policy to Include ESG Integration

Including the current Study for 2018, the data from foundations “considering adding” responsible investing is fairly consistent over the four years. Granted, 2018 data and data from the previous three Studies do not completely align. In the previous three Studies, we inquired about possible inclusion of ESG only, not about including other forms of responsible investing; and the question was phrased slightly differently this year (earlier Studies did not inquire about “discussing,” only about “considering”).
That said, we can observe that responsible investing is drawing the attention of foundation investment committees, particularly those of community foundations. Impact investing, in particular, is being discussed, which is not surprising since it represents an opportunity to align responsible investing with the foundation’s mission. Discussion escalates into active consideration in only 25–33 percent of the data set, however, indicating that while the interest is genuine, there is hesitancy to take the next step in the direction of actual implementation.
Conclusion
Data in the CCSF provide an up-to-date profile of endowment management and governance practices within a major component of the nonprofit sector—private and community foundations. Even greater value can be derived from the fact that the data allow foundations to compare their practices and policies to foundations in general and to type/size peers in particular—all to promulgate best practices and elevate standards among foundations and, indeed, the entire nonprofit sector. Data can surprise or it can confirm. It can shine a light on both growing trends and those that are fading. In this Viewpoint, we have sought to highlight those areas where there are gaps between actual practice and what foundations may want to consider more actively. If this analysis stimulates discussion and, we hope, carefully considered action, it will have done its job.