Our 2021 Council on Foundations-Commonfund Study of Foundations marked our 10th year in collaboration with Council on Foundations and the Commonfund Institute to measure, analyze and document the endowment management and governance practices of private and community foundations. Both organizations have long espoused best practices and we believe that reliable information is essential to the promulgation of excellence in stewardship across the nonprofit sector.
As this is a milestone Study, we have broken down the Viewpoint into three blogs that focus on the long term and review selected data points that our research has uncovered over the years—not data for data’s sake, but rather for insights into the evolution of foundations’ endowment management over the decade and the implications they may carry for the future. Perhaps most importantly, we hope to stimulate discussion among board and investment committee members and senior staff. In this second blog of the series, we take a closer look at asset allocation.
The universally accepted dictum coming out of the landmark Brinson, Hood and Beebower study (published in 1986) is the conclusion that investment policy, on average, accounts for 91.5 percent of the quarterly variability in total return. As asset allocation is widely regarded as the cornerstone of investment policy, it is the pivotal decision made by boards and investment committees. Decision makers may not be able to influence external factors that steer markets, but they do set and manage their institution’s asset allocation, which is the means by which investors activate what has been called “the last free lunch”: diversification. It is worth pausing to consider the value of asset allocation/diversification in light of 10-year average annual returns for selected benchmarks from 2014 to 2021 shown below.
Trailing 10-Year Average Annual Returns for
Selected Benchmarks at December 31
| numbers in percent (%) | 2014 | 2017 | 2021 |
|
U.S. Equities S&P 500 |
7.7 |
8.5 |
16.6 |
|
Fixed Income Bloomberg Barclays US Aggregate Bond |
4.7 |
4.6 |
2.9 |
|
Non-U.S. Equities MSCI World ex-U.S. Index |
4.6 |
1.9 |
7.8 |
|
Alternatives Strategies Burgiss Private IQ* HFRI Fund of Funds Composite |
11.7 3.0 |
9.1 1.0 |
14.9 4.6 |
|
Short-term Securities/Cash/Other ML 3-Month Treasury Bill (Average Yield) |
1.5 |
0.4 |
0.6 |
|
*Venture Capital and Private Equity Point to Point Group Median IRRs as of December 31, 2021. Benchmark returns calculated through Burgiss Private IQ. For 2014 the Venture Capital and Private Equity index returns were provide by Thomson Reuters Private Equity Index which reflects all U.S. private capital funds including but not limited to U.S. venture capital, buyout and mezzanine funds through 6/30/14. It does not include a dedicated natural resources component but does include (as buyouts) certain natural resources funds. Sources: Bloomberg, Burgiss, Thomson Reuters (2014 only) |
|||
The conclusions one can draw are that equities, public and private, outperformed fixed income—but that is no surprise; second, that returns generally increased over the period (fixed income and short-term securities being the exceptions). This is consistent with the rationale for the endowment model, whose tenets are: 1) an equity bias; 2) portfolio diversification; and 3) sufficient exposure to illiquid strategies in order to capture the return premium that is associated with those assets/strategies (which goes with having the long-term, even perpetual, horizon of most endowments).
How have foundations’ asset allocations changed or evolved to adapt to—or benefit from—long-term trends? We looked at asset allocation year by year over the past decade but based our assessment on the past eight years because that is the period when data were segmented by type of foundation, private or community. The first observation is one we have made before: asset allocation is marked by distinct differences between foundation types. Secondly, despite continual one-year deviations, asset allocation has changed relatively little over the eight-year period.
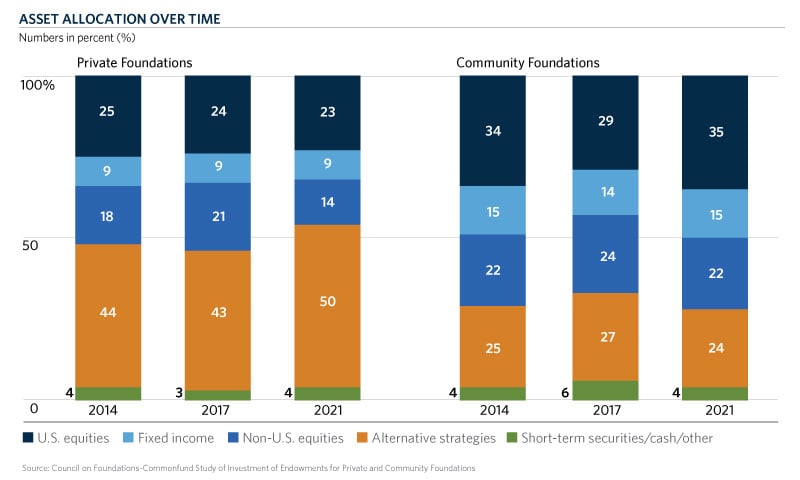
The two allocations that most clearly illustrate the difference between foundation types are fixed income and alternative strategies. Community foundations have consistently reported higher allocations to fixed income. Their allocations began the eight-year period at 15 percent and rose to 18 percent in 2019 before returning to 15 percent in 2021. In most years allocations were in the 14 to 16 percent range. Private foundation allocations were roughly one-third smaller and were reported at a surprisingly steady 9 percent every year but one (8 percent in 2016).
Allocations to alternative strategies showed more year-to-year change among foundations of both types. Private foundations were consistently the larger—that spread reaching more than two to one in 2021 when private foundations’ allocation was 50 percent versus community foundations’ 24 percent. Twenty twenty-one was also the high point for private foundations’ allocation; in other years it ranged from 42 percent to 46 percent. Community foundations’ allocation was as low as 23 percent (2019) and as high as 27 percent (2017).
A closer look at alternative strategy allocations brings two observations to light. First, private foundations had larger allocations to the two most widely implemented strategies: marketable alternatives and private equity. For foundations of both types, marketable alternatives were the largest allocation, an eight-year average of 15 percent for private foundations and 11 percent for community foundations. Respective averages for private equity were 8 percent for private foundations and 4 percent for community foundations. That leads to the second observation: Allocations could be considered overly concentrated. With community foundations, bear in mind that the 11 percent average allocation to marketable alternatives was out of an average total alternatives allocation of 25 percent, meaning that 44 percent of their alternatives allocation was to a single strategy. Further, community foundations’ allocation to most strategies was de minimis—for example, in most years venture capital was a 1 percent allocation.
Two final observations: Private foundations reported an average allocation to U.S. equities in the mid-20 percent range while community foundations have been in the 30 to 35 percent range. Although the spread was just one percentage point at the beginning of the period, in 2021 it expanded to its widest, 12 percentage points (35 percent community, 23 percent private). Secondly, community foundations have reported the larger allocation to non-U.S. equities. Their allocation was consistent, 22 percent in four of the eight years and 24 percent in three more. Private foundations’ allocation averaged 18 percent over the period but trended downward, reaching its lowest point, 14 percent, in 2021.
Conclusion
Asset allocation is a primary driver of return and it is under the control of boards and investment committees (with rebalancing being a complementary control factor when actions in financial markets cause allocation ranges or boundaries to be exceeded). As we observe in this Study, total equities (public and private) accounted for 87 percent of private foundations’ and 80 percent of community foundations’ asset allocation. That checks the equity bias box of the endowment model. But the composition of those allocations is vastly different and may favor private foundations going forward. Private foundations have shrunk their U.S. and non-U.S. equities allocations and grown their alternative strategies allocation. And, consistently, they have had the smaller fixed income exposure—an allocation under stress in a rising interest rate regime. Certainly, community foundations’ public equity allocation has served them well in the past three years. That said, private foundations overall have reported moderately higher returns in two of those three years. A prolonged downturn in public equity markets may become a drag on private markets, but alternatives offer more alternatives. Examples in 2022 are commodities, private credit, certain equity hedge fund strategies and pockets of the equity real estate market—all showing positive returns when virtually every other asset class and strategy is negative. Foundations participating in CCSF have practically no exposure in these areas and may well be motivated to look more closely at them in what could be a very different investment environment going forward.