As we inch closer to 2024, domestic markets have been largely driven by shifts in sentiment surrounding the macroeconomic environment, leading many to question the relationship between “bad news” and market performance.
A year ago, a recession in 2023 was highly anticipated as many foresaw a material rise in unemployment (including this blog). While the labor market has slowed, it has remained far more resilient than most have expected with the four-week average of initial unemployment claims hardly higher than the beginning of the year.
Over the last month, markets have rallied pricing in “goldilocks” conditions of moderating inflation, relatively stable unemployment, and a peak in rates. November marked the strongest month for a traditional 60/40 portfolio since the winter of 1991 as the S&P 500 returned nearly 9 percent and the Bloomberg Aggregate Bond Index returned 4.5 percent in its largest rally since 1985. While strong performance comes as a relief for many, it has been a rocky year for rates. Not only has the shape of the yield curve changed, but domestic rates also have parallel shifted both upward and downward in a wide range between 4 and 5 percent. The 10-year Treasury briefly traded above five percent but has rallied nearly 60 basis points in November. At present, realized volatility on long-dated Treasuries has exceeded that of equities on a one-year basis.1
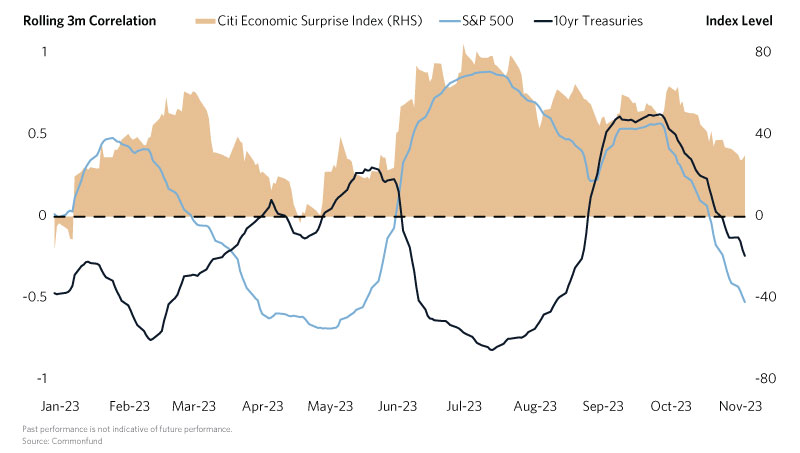
This Chart of the Month displays the relationship between domestic economic surprises and market performance. Shown below is the Citi Economic Surprise Index and the rolling 3-month correlation between the index value and the S&P 500, as well as 10-year Treasuries.2 For much of the year, economic surprises tended to have opposite directional relationships with stocks and bonds, peaking in the summer as strong economic data led to rates trending towards 5 percent. Additionally, weaker equity performance reflected an environment where good news for the economy was bad news for markets. Since September, however, both stock and bonds have largely moved in concert with economic surprises.

In the final months of 2023, economic data began to slow relative to midsummer highs marked by further weakness in PMI and housing data, as well as slowing nonfarm payroll growth and job openings. Both assets have rallied in response, as shown by the dramatic shift in correlation well into negative territory. This largely reflects that “bad news” in the economy has been good news for market performance, as weakening data supported the end of rate hikes and potential easing (which forward rate expectations now price as soon as March 2024). Such a trend is also reflected in the correlation between asset class performance, which has moved into positive territory yet again as markets traded unidirectionally throughout October and November. While many expect economic data to continue to slow, a key theme through 2024 will be how markets digest the trends in data.
- Measured by the TLT and SPY ETFs as of December 1st.
- The inverse correlation was used for Treasuries to reflect prices rather than yields.


