Chart of the Month |  Are We on the Verge of a Global Energy Crisis?

October 7, 2021 |
2 minute read
|

It is hard to imagine that in the short span of less than 18 months, energy markets went from a state of overabundance to one of severe shortages and skyrocketing prices. In April 2020, Brent oil traded at its lowest levels since 2001 while the U.S.-based West Texas Intermediate settled at a negative price as tanks filled quickly and traders resorted to expensive storage alternatives.

Back then, the world faced an enormous drop in demand as manufacturing around the globe shuttered in response to COVID-19, while Saudi Arabia and Russia kept production high and engaged in a price war to gain market share. Today, the world appears to be on the verge of an energy crisis as production has not kept up with increasing demand. As the effects of COVID-19 begin to subside, factories are approaching full utilization capacity to meet demand, and the oversupply of natural gas and crude oil has quickly turned into supply deficits.

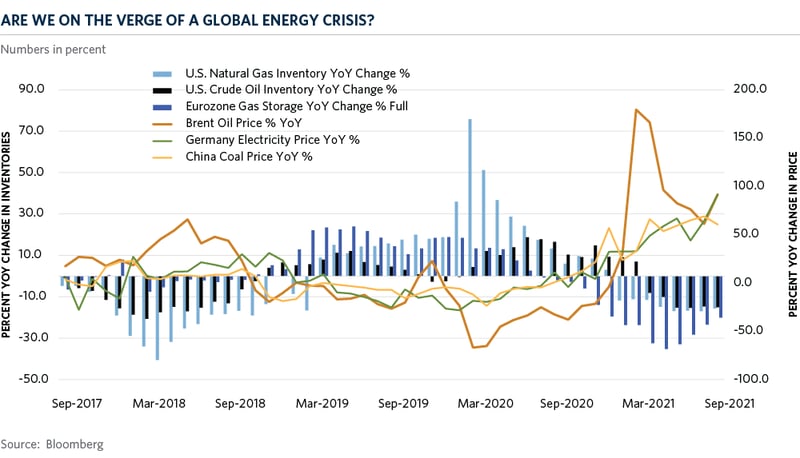
In this month’s chart, we show the year-over-year change in U.S. crude oil and natural gas inventories as well as the change in European gas storage (percent of full storage). Currently, available stocks are between 10 and 30 percent lower than last year, with some European nations experiencing a 60 percent drawdown.

In China, central government officials ordered the country’s top state-owned energy companies to secure supplies of oil, natural gas, and coal at all costs for the upcoming winter. As seen in the chart, China’s thermal coal prices are up over 60 percent versus last year. China’s power shortage could take a toll on its fourth quarter economic growth and trigger further fiscal policy easing in the near term. More than 20 provinces, accounting for more than 70 percent of GDP in the first half of 2021 have announced emergency power cuts so far. Furthermore, the goals of maintaining strong economic growth and achieving peak power sector emissions before 2030, and carbon neutrality by 2060, could exacerbate the current situation. India is also experiencing a power crunch as coal inventories have declined to dangerously low levels.

In Europe, natural gas prices have skyrocketed along with electricity prices and the offsetting carbon credits. Electricity prices have risen between 50 and 300 percent in different parts of the Eurozone while current natural gas on hand is 20 percent lower compared to last year. Natural gas prices in the U.K. and the Netherlands are close to six times higher than last year, partially due to Europe’s continued efforts to remove coal-fired power plants from the grid and replace them with less carbon intensive resources. A weather-driven drop in wind-generated power has coincided with a colder-than-expected September amid the lower supplies of natural gas, further straining the system.

On the supply side, deliveries from gas producing countries like Norway and Russia have been slow into Europe despite the more attractive price levels. Some have speculated that the surprising lack of supplies from Russia, the leading gas exporter to the Eurozone, is an attempt by Russia to capitalize on the current energy crisis to bolster the case in favor of the Nord Stream 2 project supplying gas into Germany through a pipeline under the Baltic Sea. The project has been heavily criticized as continuing Europe’s dependence on fossil fuels and strengthening President Putin’s position in geopolitical relations. In the U.K., a slightly different version of energy shortage is occurring, affecting mostly drivers. A scarcity of truck drivers due to foreigners leaving the country post-Brexit has resulted in 30 percent of the 1,200 gas stations being left without fuel. In response, the British Army mobilized 200 military personnel, including 100 drivers, to deliver fuel across the country.

These developments in the energy sector are supporting the case for higher levels of inflation for longer. As global economies continue to recover from the pandemic, while simultaneously moving towards reducing carbon emissions, it is resulting in an energy crunch. Investors and institutions are shying away from the energy sector at the same time that producers are reluctant to increase capital spending, leading to declines in production and persistently high energy prices. The world could be about to enter a cold (and expensive) winter.

img-chart-of-the-month-2021-10

 
Ivo C. Nenin

Author

Ivo C. Nenin

Disclaimer

Certain information contained herein has been obtained from or is based on third-party sources and, although believed to be reliable, has not been independently verified. Such information is as of the date indicated, if indicated, may not be complete, is subject to change and has not necessarily been updated. No representation or warranty, express or implied, is or will be given by The Common Fund for Nonprofit Organizations, any of its affiliates or any of its or their affiliates, trustees, directors, officers, employees or advisers (collectively referred to herein as “Commonfund”) or any other person as to the accuracy or completeness of the information in any third-party materials. Accordingly, Commonfund shall not be liable for any direct, indirect or consequential loss or damage suffered by any person as a result of relying on any statement in, or omission from, such third-party materials, and any such liability is expressly disclaimed.

All rights to the trademarks, copyrights, logos and other intellectual property listed herein belong to their respective owners and the use of such logos hereof does not imply an affiliation with, or endorsement by, the owners of such trademarks, copyrights, logos and other intellectual property.

To the extent views presented forecast market activity, they may be based on many factors in addition to those explicitly stated herein. Forecasts of experts inevitably differ. Views attributed to third-parties are presented to demonstrate the existence of points of view, not as a basis for recommendations or as investment advice. Market and investment views of third-parties presented herein do not necessarily reflect the views of Commonfund, any manager retained by Commonfund to manage any investments for Commonfund (each, a “Manager”) or any fund managed by any Commonfund entity (each, a “Fund”). Accordingly, the views presented herein may not be relied upon as an indication of trading intent on behalf of Commonfund, any Manager or any Fund.

Statements concerning Commonfund’s views of possible future outcomes in any investment asset class or market, or of possible future economic developments, are not intended, and should not be construed, as forecasts or predictions of the future investment performance of any Fund. Such statements are also not intended as recommendations by any Commonfund entity or any Commonfund employee to the recipient of the presentation. It is Commonfund’s policy that investment recommendations to its clients must be based on the investment objectives and risk tolerances of each individual client. All market outlook and similar statements are based upon information reasonably available as of the date of this presentation (unless an earlier date is stated with regard to particular information), and reasonably believed to be accurate by Commonfund. Commonfund disclaims any responsibility to provide the recipient of this presentation with updated or corrected information or statements. Past performance is not indicative of future results. For more information please refer to Important Disclosures.

Stay connected with the Insights Blog

Popular Blog Posts


Market Commentary | Insights Blog

Chart of the Month | U.S. Budget Deficit Hits Record Highs

In his first 100 days as President of the United States, Joe Biden has introduced three domestic funding proposals, totaling close to $6.0 Trillion, reflecting a desire to enhance the role of the...
Perspectives | Insights Blog

The Case for Using the Higher Education Price Index® (HEPI) to Define Inflation for Colleges

When calculating return targets for an endowment portfolio, a conventional piece of the equation is often the Consumer Price Index (CPI). CPI plus 5% is the common short-hand formula for institutions...
Market Commentary | Insights Blog

Chart of the Month | The Surprising Relationship Between Money Supply and Inflation

The potential for rising inflation is becoming a top concern for many investors and consumers. Many believe that inflation is already here as evidenced by price increases in commodities, homes,...

Disclaimer

Certain information contained herein has been obtained from or is based on third-party sources and, although believed to be reliable, has not been independently verified. Such information is as of the date indicated, if indicated, may not be complete, is subject to change and has not necessarily been updated. No representation or warranty, express or implied, is or will be given by The Common Fund for Nonprofit Organizations, any of its affiliates or any of its or their affiliates, trustees, directors, officers, employees or advisers (collectively referred to herein as “Commonfund”) or any other person as to the accuracy or completeness of the information in any third-party materials. Accordingly, Commonfund shall not be liable for any direct, indirect or consequential loss or damage suffered by any person as a result of relying on any statement in, or omission from, such third-party materials, and any such liability is expressly disclaimed.

All rights to the trademarks, copyrights, logos and other intellectual property listed herein belong to their respective owners and the use of such logos hereof does not imply an affiliation with, or endorsement by, the owners of such trademarks, copyrights, logos and other intellectual property.

To the extent views presented forecast market activity, they may be based on many factors in addition to those explicitly stated herein. Forecasts of experts inevitably differ. Views attributed to third-parties are presented to demonstrate the existence of points of view, not as a basis for recommendations or as investment advice. Market and investment views of third-parties presented herein do not necessarily reflect the views of Commonfund, any manager retained by Commonfund to manage any investments for Commonfund (each, a “Manager”) or any fund managed by any Commonfund entity (each, a “Fund”). Accordingly, the views presented herein may not be relied upon as an indication of trading intent on behalf of Commonfund, any Manager or any Fund.

Statements concerning Commonfund’s views of possible future outcomes in any investment asset class or market, or of possible future economic developments, are not intended, and should not be construed, as forecasts or predictions of the future investment performance of any Fund. Such statements are also not intended as recommendations by any Commonfund entity or any Commonfund employee to the recipient of the presentation. It is Commonfund’s policy that investment recommendations to its clients must be based on the investment objectives and risk tolerances of each individual client. All market outlook and similar statements are based upon information reasonably available as of the date of this presentation (unless an earlier date is stated with regard to particular information), and reasonably believed to be accurate by Commonfund. Commonfund disclaims any responsibility to provide the recipient of this presentation with updated or corrected information or statements. Past performance is not indicative of future results. For more information please refer to Important Disclosures.