Chart of the Month | Are Bonds Still a Good Hedge for Equity Market Declines?

February 4, 2021 |
2 minute read
|

In the middle of January, the Biden administration announced the details on a new $1.9 trillion stimulus package, including enhanced unemployment benefits, an increase in the minimum wage, and support for small businesses, state and local governments and further spending on education and vaccine distribution. Additional Treasury issuance to fund the growing budget deficits, along with economists’ optimistic growth projections for 2021, led nominal 10-year yields to reach 1.19 percent, an increase of 28 bps since the start of the month. While 10-year yields bottomed in the beginning of August 2020 and have been rising since then, investors have been wondering how high yields could climb in 2021. Further, if the Fed begins to taper earlier than expected, how will a sharp increase in interest rates impact traditional equities and fixed income portfolios? Bonds have proven their worth during every crisis in the last 30 years despite investors predicting their end as a portfolio diversifier as interest rates crept ever lower. However, as 10-year yields fell to 0.5 percent in August, investors may have been right to question whether historically expensive Treasuries can hedge a potential sell-off in historically overpriced equities.

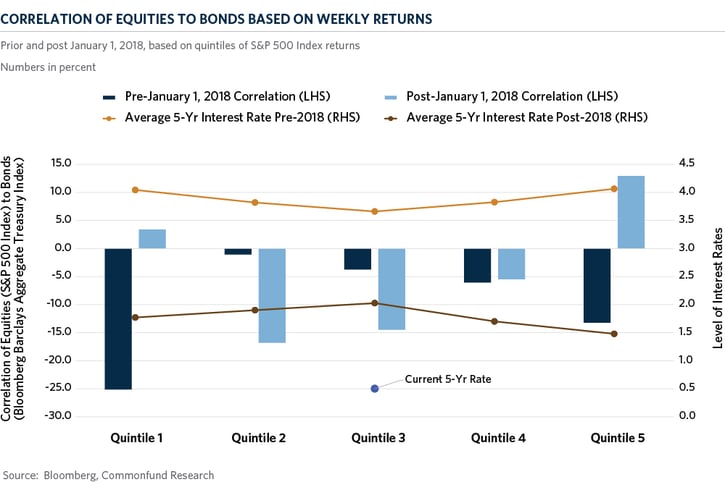
In this month’s chart, we focus on the correlation between equity and bond prices as an indication of bonds’ future ability to protect portfolios during equity declines. We analyze weekly rolling returns of the S&P 500 and the Bloomberg Barclays Aggregate Treasury indices, which are sorted from weakest to highest with Quintile 1 representing the worst 20 percent of weekly returns and Quintile 5 representing the best 20 percent of weekly returns. Then, we calculate the correlation between the weekly equity returns and the corresponding bond returns for each one of the five quintiles, performing the analysis for periods prior to 2018 and after. The correlations are shown in the dark and light blue bars, while the orange and brown lines represent the average interest rate pre- and post-2018. It is important to note that prior to 2018, bonds provided the most protection, indicated by the most negative correlation, during the largest drawdowns in equities. Correlation was also negative in periods of strong equity gains as economic growth and real rates increased, leading to negative bond returns. Post 2018, the protection from bonds during the weakest equity returns has disappeared as indicated by the slightly positive light blue bar in Quintile 1—meaning bonds declined simultaneously with equities. Bonds have also demonstrated positive correlation during the best weekly equity returns over the last three years. The low yield in Treasuries has led investors to increase allocations to high yield credit—which could be correlated with equities—increasing the total equity-like risk in the portfolio.

At Commonfund, our public credit allocations are underweight high yield credit as we expect default rates to peak in 2021 while our private credit strategies allocate to senior short-term corporate loans which may benefit from an increase in short-term interest rates. It is important to note, that a sudden tapering of Fed support is unlikely to go unpunished by both equities and fixed income markets which is why Fed Chairman Powell has been anxious to reassure investors that substantially more economic progress is needed before any tapering is considered. Similarly, most forecasters continue to expect a very slow increase in interest rates, although most of the recent move up occurred on the back of higher inflation expectations. However, in the 10+ years since the Global Financial Crisis, realized inflation has consistently fallen short of target and the sensitivity of interest rates to increases in economic growth expectations has also been diminishing. Finally, we believe that reduced industrial capacity utilization and slack in the labor market, together with a slower-than-expected roll-out of vaccines should limit the rebound in pent-up demand and keep interest rates contained in 2021.
img-chart-of-the-month-2021-02


Ivo C. Nenin

Author

Ivo C. Nenin

Disclaimer

Certain information contained herein has been obtained from or is based on third-party sources and, although believed to be reliable, has not been independently verified. Such information is as of the date indicated, if indicated, may not be complete, is subject to change and has not necessarily been updated. No representation or warranty, express or implied, is or will be given by The Common Fund for Nonprofit Organizations, any of its affiliates or any of its or their affiliates, trustees, directors, officers, employees or advisers (collectively referred to herein as “Commonfund”) or any other person as to the accuracy or completeness of the information in any third-party materials. Accordingly, Commonfund shall not be liable for any direct, indirect or consequential loss or damage suffered by any person as a result of relying on any statement in, or omission from, such third-party materials, and any such liability is expressly disclaimed.

All rights to the trademarks, copyrights, logos and other intellectual property listed herein belong to their respective owners and the use of such logos hereof does not imply an affiliation with, or endorsement by, the owners of such trademarks, copyrights, logos and other intellectual property.

To the extent views presented forecast market activity, they may be based on many factors in addition to those explicitly stated herein. Forecasts of experts inevitably differ. Views attributed to third-parties are presented to demonstrate the existence of points of view, not as a basis for recommendations or as investment advice. Market and investment views of third-parties presented herein do not necessarily reflect the views of Commonfund, any manager retained by Commonfund to manage any investments for Commonfund (each, a “Manager”) or any fund managed by any Commonfund entity (each, a “Fund”). Accordingly, the views presented herein may not be relied upon as an indication of trading intent on behalf of Commonfund, any Manager or any Fund.

Statements concerning Commonfund’s views of possible future outcomes in any investment asset class or market, or of possible future economic developments, are not intended, and should not be construed, as forecasts or predictions of the future investment performance of any Fund. Such statements are also not intended as recommendations by any Commonfund entity or any Commonfund employee to the recipient of the presentation. It is Commonfund’s policy that investment recommendations to its clients must be based on the investment objectives and risk tolerances of each individual client. All market outlook and similar statements are based upon information reasonably available as of the date of this presentation (unless an earlier date is stated with regard to particular information), and reasonably believed to be accurate by Commonfund. Commonfund disclaims any responsibility to provide the recipient of this presentation with updated or corrected information or statements. Past performance is not indicative of future results. For more information please refer to Important Disclosures.

Stay connected with the Insights Blog

Popular Blog Posts


Market Commentary | Insights Blog

Chart of the Month | U.S. Budget Deficit Hits Record Highs

In his first 100 days as President of the United States, Joe Biden has introduced three domestic funding proposals, totaling close to $6.0 Trillion, reflecting a desire to enhance the role of the...
Investment Strategy | Insights Blog

Key Factors in Asset Allocation Decisions for Endowments

There are several broad subjects that an effective investment policy statement (IPS) should include in its contents and address clearly and specifically as they relate to an endowed institution. This...
Perspectives | Insights Blog

The Case for Using the Higher Education Price Index® (HEPI) to Define Inflation for Colleges

When calculating return targets for an endowment portfolio, a conventional piece of the equation is often the Consumer Price Index (CPI). CPI plus 5% is the common short-hand formula for institutions...

Disclaimer

Certain information contained herein has been obtained from or is based on third-party sources and, although believed to be reliable, has not been independently verified. Such information is as of the date indicated, if indicated, may not be complete, is subject to change and has not necessarily been updated. No representation or warranty, express or implied, is or will be given by The Common Fund for Nonprofit Organizations, any of its affiliates or any of its or their affiliates, trustees, directors, officers, employees or advisers (collectively referred to herein as “Commonfund”) or any other person as to the accuracy or completeness of the information in any third-party materials. Accordingly, Commonfund shall not be liable for any direct, indirect or consequential loss or damage suffered by any person as a result of relying on any statement in, or omission from, such third-party materials, and any such liability is expressly disclaimed.

All rights to the trademarks, copyrights, logos and other intellectual property listed herein belong to their respective owners and the use of such logos hereof does not imply an affiliation with, or endorsement by, the owners of such trademarks, copyrights, logos and other intellectual property.

To the extent views presented forecast market activity, they may be based on many factors in addition to those explicitly stated herein. Forecasts of experts inevitably differ. Views attributed to third-parties are presented to demonstrate the existence of points of view, not as a basis for recommendations or as investment advice. Market and investment views of third-parties presented herein do not necessarily reflect the views of Commonfund, any manager retained by Commonfund to manage any investments for Commonfund (each, a “Manager”) or any fund managed by any Commonfund entity (each, a “Fund”). Accordingly, the views presented herein may not be relied upon as an indication of trading intent on behalf of Commonfund, any Manager or any Fund.

Statements concerning Commonfund’s views of possible future outcomes in any investment asset class or market, or of possible future economic developments, are not intended, and should not be construed, as forecasts or predictions of the future investment performance of any Fund. Such statements are also not intended as recommendations by any Commonfund entity or any Commonfund employee to the recipient of the presentation. It is Commonfund’s policy that investment recommendations to its clients must be based on the investment objectives and risk tolerances of each individual client. All market outlook and similar statements are based upon information reasonably available as of the date of this presentation (unless an earlier date is stated with regard to particular information), and reasonably believed to be accurate by Commonfund. Commonfund disclaims any responsibility to provide the recipient of this presentation with updated or corrected information or statements. Past performance is not indicative of future results. For more information please refer to Important Disclosures.