Chart of the Month | The Stock Market Rally May Finally Be Broadening Beyond Tech Names

March 3, 2021 |
2 minute read
|

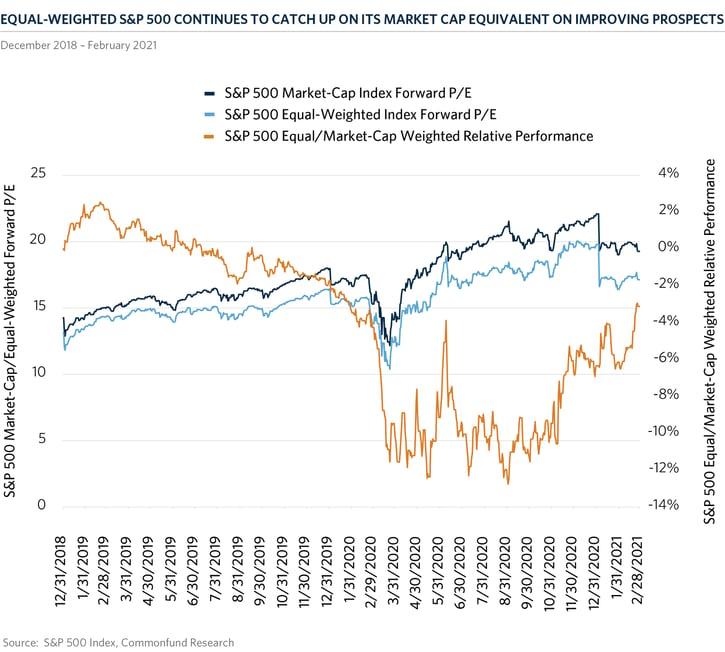
The trend of improving performance of sectors most sensitive to the strengthening economy remained on track in February 2021. For the most part of 2020, the traditional S&P 500 market-cap-weighted index maintained a significant price premium over its equal-weighted equivalent mainly due to considerable concentration in highly priced technology and communication services names. The two sectors along with e-commerce leader, Amazon, accounted for 44.8 percent of the S&P 500 while the FAANG+M (Facebook, Apple, Amazon, Netflix, Google, Microsoft) stocks represented 24.7 percent of the S&P 500 market capitalization at the end of August 2020.

The COVID-19 pandemic and the ensuing work-from-home environment led the market-cap-weighted index to outperform by 12 percent in the first eight months of 2020. However, since that time, most of the underperformance has been recovered with the equal-weighted index outperforming by 11.74 percent. In February 2021, the equal-weighted index outperformed by 332 basis points led by energy, financials and industrials which returned 22.7, 11.5 and 6.9 percent.

Conversely, sectors that were negatively impacted by rising interest rates like utilities, healthcare and staples declined by 6.1, 2.1 and 1.4 percent, while discretionary also fell 0.9 percent. Energy names were driven higher by a mild case of euphoria about tighter oil markets and expectations of a new commodities supercycle driven by a weaker U.S. dollar and massive central bank support. Financials were supported by positive sensitivity to rising interest rates and the steepening yield curve, strengthening earnings, price momentum and attractive valuations. Industrials also benefited from the increased probability of a fiscal stimulus and an infrastructure bill from the Biden Administration.

At the end of February 2021, the equal-weighted S&P 500 index maintained a relative overweight in those sectors of 235, 262 and 582 basis points, respectively. On the other hand, it had a 639 and a 1226 basis point underweight to the communication service and technology sectors which returned 6.2 and 1.2 percent. The average price-to-earnings multiple of the tech, communications and discretionary sectors in the market-cap weighted index is also pricier, mostly due to a higher allocation to Tesla with a trailing price-to-earnings multiple of 914.

As long as investors continue to view increasing interest rates as a sign of improving prospects for the economy, the equal-weighted index should continue to gain ground. Of course, companies need to show improving earnings for the equity market to be able to absorb higher rates and continue to move in a positive direction. So far, 98 percent of companies in the S&P 500 index have reported fourth-quarter earnings, generating a positive average earnings surprise of 17.5 percent over gloomy expectations. Earnings grew by 5.25 percent over the previous quarter with materials, financials and technology showing the strongest growth. Given these dynamics, we continue to favor the S&P 500 equal-weighted index over the traditional S&P 500 cap-weighted index for portfolio allocations to passive U.S. equities.

img-chart-of-the-month-2021-03


Ivo C. Nenin

Author

Ivo C. Nenin

Disclaimer

Certain information contained herein has been obtained from or is based on third-party sources and, although believed to be reliable, has not been independently verified. Such information is as of the date indicated, if indicated, may not be complete, is subject to change and has not necessarily been updated. No representation or warranty, express or implied, is or will be given by The Common Fund for Nonprofit Organizations, any of its affiliates or any of its or their affiliates, trustees, directors, officers, employees or advisers (collectively referred to herein as “Commonfund”) or any other person as to the accuracy or completeness of the information in any third-party materials. Accordingly, Commonfund shall not be liable for any direct, indirect or consequential loss or damage suffered by any person as a result of relying on any statement in, or omission from, such third-party materials, and any such liability is expressly disclaimed.

All rights to the trademarks, copyrights, logos and other intellectual property listed herein belong to their respective owners and the use of such logos hereof does not imply an affiliation with, or endorsement by, the owners of such trademarks, copyrights, logos and other intellectual property.

To the extent views presented forecast market activity, they may be based on many factors in addition to those explicitly stated herein. Forecasts of experts inevitably differ. Views attributed to third-parties are presented to demonstrate the existence of points of view, not as a basis for recommendations or as investment advice. Market and investment views of third-parties presented herein do not necessarily reflect the views of Commonfund, any manager retained by Commonfund to manage any investments for Commonfund (each, a “Manager”) or any fund managed by any Commonfund entity (each, a “Fund”). Accordingly, the views presented herein may not be relied upon as an indication of trading intent on behalf of Commonfund, any Manager or any Fund.

Statements concerning Commonfund’s views of possible future outcomes in any investment asset class or market, or of possible future economic developments, are not intended, and should not be construed, as forecasts or predictions of the future investment performance of any Fund. Such statements are also not intended as recommendations by any Commonfund entity or any Commonfund employee to the recipient of the presentation. It is Commonfund’s policy that investment recommendations to its clients must be based on the investment objectives and risk tolerances of each individual client. All market outlook and similar statements are based upon information reasonably available as of the date of this presentation (unless an earlier date is stated with regard to particular information), and reasonably believed to be accurate by Commonfund. Commonfund disclaims any responsibility to provide the recipient of this presentation with updated or corrected information or statements. Past performance is not indicative of future results. For more information please refer to Important Disclosures.

Stay connected with the Insights Blog

Popular Blog Posts


Market Commentary | Insights Blog

Chart of the Month | U.S. Budget Deficit Hits Record Highs

In his first 100 days as President of the United States, Joe Biden has introduced three domestic funding proposals, totaling close to $6.0 Trillion, reflecting a desire to enhance the role of the...
Perspectives | Insights Blog

The Case for Using the Higher Education Price Index® (HEPI) to Define Inflation for Colleges

When calculating return targets for an endowment portfolio, a conventional piece of the equation is often the Consumer Price Index (CPI). CPI plus 5% is the common short-hand formula for institutions...
Market Commentary | Insights Blog

Chart of the Month | The Surprising Relationship Between Money Supply and Inflation

The potential for rising inflation is becoming a top concern for many investors and consumers. Many believe that inflation is already here as evidenced by price increases in commodities, homes,...

Disclaimer

Certain information contained herein has been obtained from or is based on third-party sources and, although believed to be reliable, has not been independently verified. Such information is as of the date indicated, if indicated, may not be complete, is subject to change and has not necessarily been updated. No representation or warranty, express or implied, is or will be given by The Common Fund for Nonprofit Organizations, any of its affiliates or any of its or their affiliates, trustees, directors, officers, employees or advisers (collectively referred to herein as “Commonfund”) or any other person as to the accuracy or completeness of the information in any third-party materials. Accordingly, Commonfund shall not be liable for any direct, indirect or consequential loss or damage suffered by any person as a result of relying on any statement in, or omission from, such third-party materials, and any such liability is expressly disclaimed.

All rights to the trademarks, copyrights, logos and other intellectual property listed herein belong to their respective owners and the use of such logos hereof does not imply an affiliation with, or endorsement by, the owners of such trademarks, copyrights, logos and other intellectual property.

To the extent views presented forecast market activity, they may be based on many factors in addition to those explicitly stated herein. Forecasts of experts inevitably differ. Views attributed to third-parties are presented to demonstrate the existence of points of view, not as a basis for recommendations or as investment advice. Market and investment views of third-parties presented herein do not necessarily reflect the views of Commonfund, any manager retained by Commonfund to manage any investments for Commonfund (each, a “Manager”) or any fund managed by any Commonfund entity (each, a “Fund”). Accordingly, the views presented herein may not be relied upon as an indication of trading intent on behalf of Commonfund, any Manager or any Fund.

Statements concerning Commonfund’s views of possible future outcomes in any investment asset class or market, or of possible future economic developments, are not intended, and should not be construed, as forecasts or predictions of the future investment performance of any Fund. Such statements are also not intended as recommendations by any Commonfund entity or any Commonfund employee to the recipient of the presentation. It is Commonfund’s policy that investment recommendations to its clients must be based on the investment objectives and risk tolerances of each individual client. All market outlook and similar statements are based upon information reasonably available as of the date of this presentation (unless an earlier date is stated with regard to particular information), and reasonably believed to be accurate by Commonfund. Commonfund disclaims any responsibility to provide the recipient of this presentation with updated or corrected information or statements. Past performance is not indicative of future results. For more information please refer to Important Disclosures.