Investment Manager Fees Part II: Creating Alignment

June 17, 2019 |
3 minute read
|

In Part I of this blog series, “Investment Manager Fees: Out of Sight, Out of Mind”, we discussed our approach to determining the value of an asset manager and how we might calculate a fair price for their strategy and the excess returns they may deliver, through a combination of management and performance fees.

Creating Alignment

A favorable fee arrangement should make sense and foster positive outcomes for both our clients and managers. One approach might be to pay for performance, or returns above some agreed upon level (e.g., above a specified benchmark). This, of course, is common in hedge funds as well as private equity, where managers can earn carried interest on investments. It is not common, however, in traditional public equity and fixed income strategies, which typically charge just a flat management fee.

From our perspective, a flat management fee based on assets lacks alignment and may not be the optimal arrangement for both the investor and the manager. On the one hand, the manager has the security of knowing that they will be paid consistently regardless of performance swings. On the other hand, the manager who produces consistent outperformance is forgoing considerable upside. Similarly, the investor will pay the same level of fees even when their portfolio underperforms, but they do keep more of the winnings when the manager outperforms. We can build on our “fee indifference curve” approach from Part I to find a fee arrangement that maintains an acceptable management fee while motivating the manager to deliver outperformance such that both parties are satisfied.

Pay for Performance, Not for Benchmark Returns

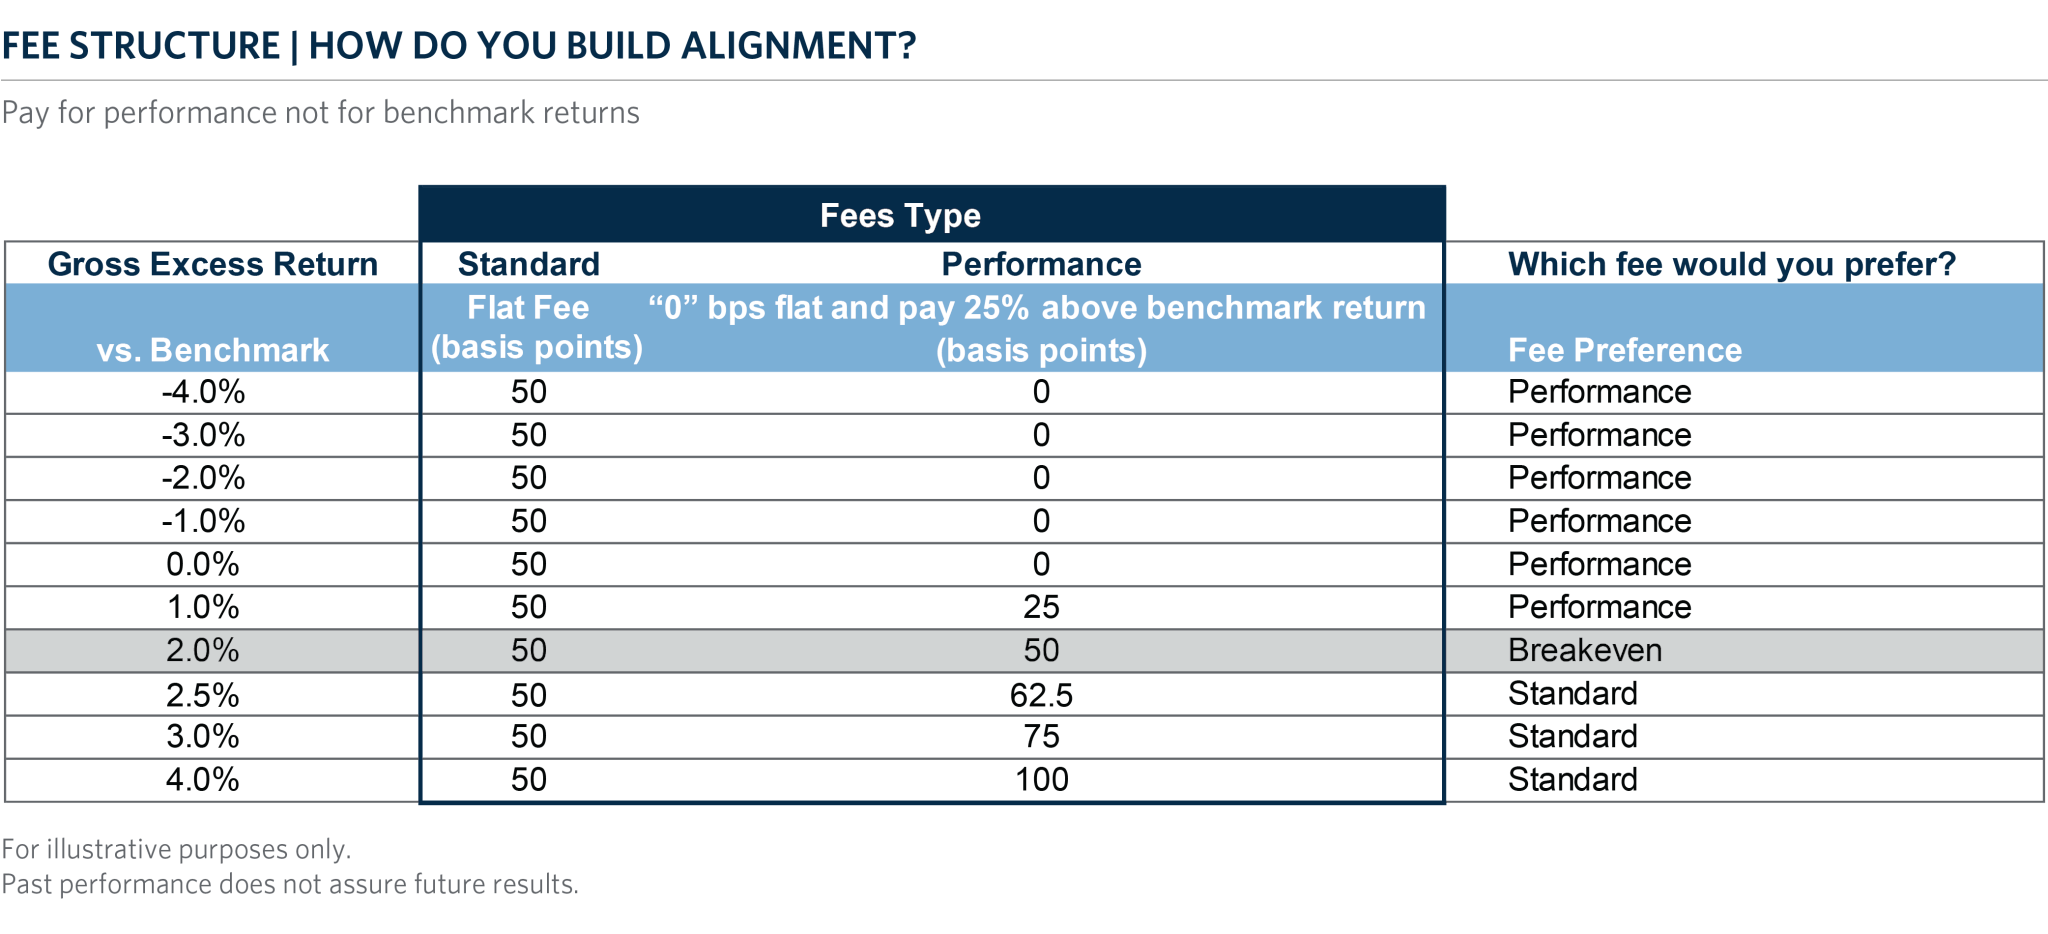
The left column in the table below shows various potential returns that a manager could deliver relative to their benchmark ranging from -4 percent to +4 percent. The middle two columns then display the resulting fees that an investor would pay in two different scenarios – a “Standard” flat fee of 50 basis points or a flat fee of zero and a 25 percent “Performance” fee, meaning the manager gets 25 percent of any performance they deliver above the benchmark. For example, if we look at the first column and scroll down to the row showing 1.0 percent relative return we can then read across and see that the manager would be paid 50 basis points in the standard arrangement and just 25 basis points using the performance fee arrangement. The last column serves to clarify which fee arrangement would be preferable to the investor in each case.

Fee Structure Table

The Right Tradeoff Structure Can be a Win-Win

In this example, we show that the manager would need to outperform the benchmark by more than 200 basis points before the performance fee would exceed the standard flat fee. We see this tradeoff in fee structure as an overall win. If the manager beats the benchmark by less than 200 basis points, the investor wins as fees are lower…and if the manager generates excess returns greater than 200 basis points…everybody wins (that is a lot of excess return)!

Important Considerations

Of course, there are many other variables to consider when hiring a manager and negotiating fees, not least of which is your ability to negotiate in the first place. Assuming the manager has capacity, you’ll need to be making a large enough investment that the manager will be motivated to engage in a fee discussion. Once you’ve crossed that bridge, here are a few additional considerations to keep in mind:

  • Investment guidelines and risk controls: It is important to be mindful that introducing a performance fee does not inadvertently cause the manager to take outsize risks in pursuit of a big payday. Make sure to specify very clear risk parameters and investment guidelines and embed those into the investment management agreement.

  • Transparency: Once you agree to specific risk controls and investment guidelines, you’ll need enough transparency into the portfolio to monitor that those guidelines are being followed – potentially down to the security level at a daily frequency.

  • Fee caps: It’s also a good idea to negotiate a cap on fees – just to ensure that total fees (flat + performance) do not become excessive in an outlier performance scenario.

  • Look-back period and hurdles: Make sure that you specify the look-back period for performance fees to avoid whipsaws and further align evaluation time frames. Lastly, consider whether establishing a hurdle rate for any performance fee may be appropriate.

As we pointed out in the first part of this series, fiduciaries have a duty to understand and ensure that the fees they pay to asset managers are not only reasonable but also structured to maximize net-of-fee returns wherever possible. At Commonfund we actively negotiate fees on behalf of our investors every day.

Kristofer Kwait

Author

Kristofer Kwait

Chief Market Strategist

Disclaimer

Certain information contained herein has been obtained from or is based on third-party sources and, although believed to be reliable, has not been independently verified. Such information is as of the date indicated, if indicated, may not be complete, is subject to change and has not necessarily been updated. No representation or warranty, express or implied, is or will be given by The Common Fund for Nonprofit Organizations, any of its affiliates or any of its or their affiliates, trustees, directors, officers, employees or advisers (collectively referred to herein as “Commonfund”) or any other person as to the accuracy or completeness of the information in any third-party materials. Accordingly, Commonfund shall not be liable for any direct, indirect or consequential loss or damage suffered by any person as a result of relying on any statement in, or omission from, such third-party materials, and any such liability is expressly disclaimed.

All rights to the trademarks, copyrights, logos and other intellectual property listed herein belong to their respective owners and the use of such logos hereof does not imply an affiliation with, or endorsement by, the owners of such trademarks, copyrights, logos and other intellectual property.

To the extent views presented forecast market activity, they may be based on many factors in addition to those explicitly stated herein. Forecasts of experts inevitably differ. Views attributed to third-parties are presented to demonstrate the existence of points of view, not as a basis for recommendations or as investment advice. Market and investment views of third-parties presented herein do not necessarily reflect the views of Commonfund, any manager retained by Commonfund to manage any investments for Commonfund (each, a “Manager”) or any fund managed by any Commonfund entity (each, a “Fund”). Accordingly, the views presented herein may not be relied upon as an indication of trading intent on behalf of Commonfund, any Manager or any Fund.

Statements concerning Commonfund’s views of possible future outcomes in any investment asset class or market, or of possible future economic developments, are not intended, and should not be construed, as forecasts or predictions of the future investment performance of any Fund. Such statements are also not intended as recommendations by any Commonfund entity or any Commonfund employee to the recipient of the presentation. It is Commonfund’s policy that investment recommendations to its clients must be based on the investment objectives and risk tolerances of each individual client. All market outlook and similar statements are based upon information reasonably available as of the date of this presentation (unless an earlier date is stated with regard to particular information), and reasonably believed to be accurate by Commonfund. Commonfund disclaims any responsibility to provide the recipient of this presentation with updated or corrected information or statements. Past performance is not indicative of future results. For more information please refer to Important Disclosures.

Stay connected with the Insights Blog

Popular Blog Posts


Market Commentary | Insights Blog

Chart of the Month | U.S. Budget Deficit Hits Record Highs

In his first 100 days as President of the United States, Joe Biden has introduced three domestic funding proposals, totaling close to $6.0 Trillion, reflecting a desire to enhance the role of the...
Perspectives | Insights Blog

The Case for Using the Higher Education Price Index® (HEPI) to Define Inflation for Colleges

When calculating return targets for an endowment portfolio, a conventional piece of the equation is often the Consumer Price Index (CPI). CPI plus 5% is the common short-hand formula for institutions...
Market Commentary | Insights Blog

Chart of the Month | The Surprising Relationship Between Money Supply and Inflation

The potential for rising inflation is becoming a top concern for many investors and consumers. Many believe that inflation is already here as evidenced by price increases in commodities, homes,...

Disclaimer

Certain information contained herein has been obtained from or is based on third-party sources and, although believed to be reliable, has not been independently verified. Such information is as of the date indicated, if indicated, may not be complete, is subject to change and has not necessarily been updated. No representation or warranty, express or implied, is or will be given by The Common Fund for Nonprofit Organizations, any of its affiliates or any of its or their affiliates, trustees, directors, officers, employees or advisers (collectively referred to herein as “Commonfund”) or any other person as to the accuracy or completeness of the information in any third-party materials. Accordingly, Commonfund shall not be liable for any direct, indirect or consequential loss or damage suffered by any person as a result of relying on any statement in, or omission from, such third-party materials, and any such liability is expressly disclaimed.

All rights to the trademarks, copyrights, logos and other intellectual property listed herein belong to their respective owners and the use of such logos hereof does not imply an affiliation with, or endorsement by, the owners of such trademarks, copyrights, logos and other intellectual property.

To the extent views presented forecast market activity, they may be based on many factors in addition to those explicitly stated herein. Forecasts of experts inevitably differ. Views attributed to third-parties are presented to demonstrate the existence of points of view, not as a basis for recommendations or as investment advice. Market and investment views of third-parties presented herein do not necessarily reflect the views of Commonfund, any manager retained by Commonfund to manage any investments for Commonfund (each, a “Manager”) or any fund managed by any Commonfund entity (each, a “Fund”). Accordingly, the views presented herein may not be relied upon as an indication of trading intent on behalf of Commonfund, any Manager or any Fund.

Statements concerning Commonfund’s views of possible future outcomes in any investment asset class or market, or of possible future economic developments, are not intended, and should not be construed, as forecasts or predictions of the future investment performance of any Fund. Such statements are also not intended as recommendations by any Commonfund entity or any Commonfund employee to the recipient of the presentation. It is Commonfund’s policy that investment recommendations to its clients must be based on the investment objectives and risk tolerances of each individual client. All market outlook and similar statements are based upon information reasonably available as of the date of this presentation (unless an earlier date is stated with regard to particular information), and reasonably believed to be accurate by Commonfund. Commonfund disclaims any responsibility to provide the recipient of this presentation with updated or corrected information or statements. Past performance is not indicative of future results. For more information please refer to Important Disclosures.