Midyear Rally or Multiple Expansion?

June 26, 2023 |
2 minute read
|

The long-awaited decline in earnings growth appears to be upon us nearly halfway through 2023. Expectations for S&P 500 year-end earnings per share (EPS) growth range from flat to a tepid 1 percent.

Despite the evident weakness in corporate profits, the index is up over 13 percent through June 21st as investors have eschewed weakening earnings and redoubled bets on a mild recession accompanied with a Fed pause and/or easing cycle. In the face of multiple headwinds including significant regional bank stresses and persistent inflation readings that are unlikely to abate by year end, investors have been comfortable investing in equities at a relatively high price to earnings (P/E) multiple. Although down from trading nearly 31x earnings in early 2021, the S&P 500 is now trading at nearly 21x earnings (up from a low of 17x in October 2022). This is above the 20-year average of 18.4x and in the 83rd percentile of valuations over the same time frame.

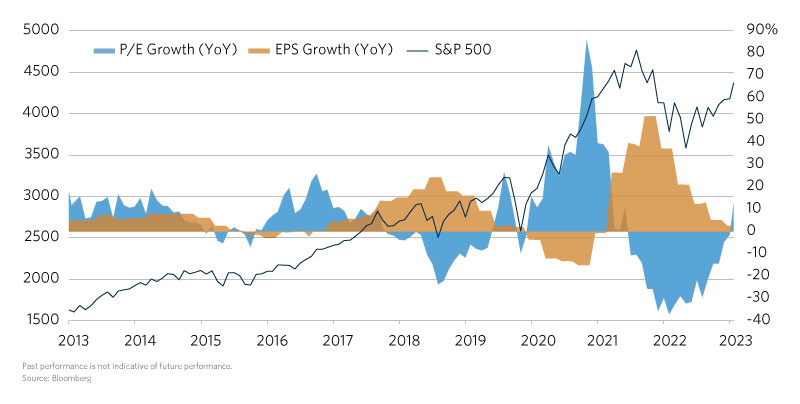
Although this may suggest that the S&P 500 is stretched in terms of valuation, strong market performance continues to be driven by multiple expansion. This chart of the month takes a 10-year lookback at year-over-year P/E growth, EPS growth, and the S&P 500 price. As the chart displays, multiple expansion has been a strong driver of S&P 500 returns throughout the last decade. In fact, there were multiple years where the index had positive returns with 0 or negative EPS growth. This is most prevalent in 2020 and 2021, where accommodative monetary policy and rates at the zero bound justified a significantly higher multiple whilst corporate earnings suffered in the face of the pandemic. The reverse was true in 2022 as firms were able to pass off higher costs on consumers and grow earnings while a swift rate hiking cycle led to significant multiple contraction.

Thus far, 2023 has been a return to the backdrop of equity returns driven by multiple expansion that dominated the last decade. This time however, short rates are 500 basis points higher, leading many to question whether equity market valuations are stretched at nearly 21x earnings. However, the S&P has often been driven by P/E expansion in the past. While many have noted the narrowness of the current rally1, market breadth has been improving this month as more index constituents make new highs with small cap and value performance closing the gap with mega cap growth. Only time will tell whether the rally can extend as uncertainty over the forward rate path continues.

Chart-Midyear-rally

  1. Amazon, Apple, Google, Meta, Microsoft, Nvidia, and Tesla contributed over 90 percent of the S&P YTD return as of May 31st.
Cameron Dyer

Author

Cameron Dyer

Disclaimer

Certain information contained herein has been obtained from or is based on third-party sources and, although believed to be reliable, has not been independently verified. Such information is as of the date indicated, if indicated, may not be complete, is subject to change and has not necessarily been updated. No representation or warranty, express or implied, is or will be given by The Common Fund for Nonprofit Organizations, any of its affiliates or any of its or their affiliates, trustees, directors, officers, employees or advisers (collectively referred to herein as “Commonfund”) or any other person as to the accuracy or completeness of the information in any third-party materials. Accordingly, Commonfund shall not be liable for any direct, indirect or consequential loss or damage suffered by any person as a result of relying on any statement in, or omission from, such third-party materials, and any such liability is expressly disclaimed.

All rights to the trademarks, copyrights, logos and other intellectual property listed herein belong to their respective owners and the use of such logos hereof does not imply an affiliation with, or endorsement by, the owners of such trademarks, copyrights, logos and other intellectual property.

To the extent views presented forecast market activity, they may be based on many factors in addition to those explicitly stated herein. Forecasts of experts inevitably differ. Views attributed to third-parties are presented to demonstrate the existence of points of view, not as a basis for recommendations or as investment advice. Market and investment views of third-parties presented herein do not necessarily reflect the views of Commonfund, any manager retained by Commonfund to manage any investments for Commonfund (each, a “Manager”) or any fund managed by any Commonfund entity (each, a “Fund”). Accordingly, the views presented herein may not be relied upon as an indication of trading intent on behalf of Commonfund, any Manager or any Fund.

Statements concerning Commonfund’s views of possible future outcomes in any investment asset class or market, or of possible future economic developments, are not intended, and should not be construed, as forecasts or predictions of the future investment performance of any Fund. Such statements are also not intended as recommendations by any Commonfund entity or any Commonfund employee to the recipient of the presentation. It is Commonfund’s policy that investment recommendations to its clients must be based on the investment objectives and risk tolerances of each individual client. All market outlook and similar statements are based upon information reasonably available as of the date of this presentation (unless an earlier date is stated with regard to particular information), and reasonably believed to be accurate by Commonfund. Commonfund disclaims any responsibility to provide the recipient of this presentation with updated or corrected information or statements. Past performance is not indicative of future results. For more information please refer to Important Disclosures.

Stay connected with the Insights Blog

Popular Blog Posts


Market Commentary | Insights Blog

Chart of the Month | U.S. Budget Deficit Hits Record Highs

In his first 100 days as President of the United States, Joe Biden has introduced three domestic funding proposals, totaling close to $6.0 Trillion, reflecting a desire to enhance the role of the...
Perspectives | Insights Blog

The Case for Using the Higher Education Price Index® (HEPI) to Define Inflation for Colleges

When calculating return targets for an endowment portfolio, a conventional piece of the equation is often the Consumer Price Index (CPI). CPI plus 5% is the common short-hand formula for institutions...
Investment Strategy | Insights Blog

Key Factors in Asset Allocation Decisions for Endowments

There are several broad subjects that an effective investment policy statement (IPS) should include in its contents and address clearly and specifically as they relate to an endowed institution. This...

Disclaimer

Certain information contained herein has been obtained from or is based on third-party sources and, although believed to be reliable, has not been independently verified. Such information is as of the date indicated, if indicated, may not be complete, is subject to change and has not necessarily been updated. No representation or warranty, express or implied, is or will be given by The Common Fund for Nonprofit Organizations, any of its affiliates or any of its or their affiliates, trustees, directors, officers, employees or advisers (collectively referred to herein as “Commonfund”) or any other person as to the accuracy or completeness of the information in any third-party materials. Accordingly, Commonfund shall not be liable for any direct, indirect or consequential loss or damage suffered by any person as a result of relying on any statement in, or omission from, such third-party materials, and any such liability is expressly disclaimed.

All rights to the trademarks, copyrights, logos and other intellectual property listed herein belong to their respective owners and the use of such logos hereof does not imply an affiliation with, or endorsement by, the owners of such trademarks, copyrights, logos and other intellectual property.

To the extent views presented forecast market activity, they may be based on many factors in addition to those explicitly stated herein. Forecasts of experts inevitably differ. Views attributed to third-parties are presented to demonstrate the existence of points of view, not as a basis for recommendations or as investment advice. Market and investment views of third-parties presented herein do not necessarily reflect the views of Commonfund, any manager retained by Commonfund to manage any investments for Commonfund (each, a “Manager”) or any fund managed by any Commonfund entity (each, a “Fund”). Accordingly, the views presented herein may not be relied upon as an indication of trading intent on behalf of Commonfund, any Manager or any Fund.

Statements concerning Commonfund’s views of possible future outcomes in any investment asset class or market, or of possible future economic developments, are not intended, and should not be construed, as forecasts or predictions of the future investment performance of any Fund. Such statements are also not intended as recommendations by any Commonfund entity or any Commonfund employee to the recipient of the presentation. It is Commonfund’s policy that investment recommendations to its clients must be based on the investment objectives and risk tolerances of each individual client. All market outlook and similar statements are based upon information reasonably available as of the date of this presentation (unless an earlier date is stated with regard to particular information), and reasonably believed to be accurate by Commonfund. Commonfund disclaims any responsibility to provide the recipient of this presentation with updated or corrected information or statements. Past performance is not indicative of future results. For more information please refer to Important Disclosures.