Spending Policy: Is Yours Ready for the Next Downturn?

November 7, 2017 |
3 minute read
|

In most Investment Policy Statements there is often a reference to two important, but conflicting, objectives: one, to preserve the purchasing power of the long-term portfolio in real terms, and two, to provide a stable, predictable and hopefully growing source of income to the institution that the long-term portfolio supports.

Why the conflict? Because in order to generate returns that will sustain real purchasing power in perpetuity, the portfolio must be exposed to risk which often means volatility and thus potential instability or unpredictability in the income stream. With a perpetual investment horizon, one could argue that the portfolio should take on as much short-term volatility as it can be compensated for.

On the other hand, though, many institutions are dependent on these long-term portfolios to fund significant portions of their operating budgets so short-term volatility can have a very real impact on budgets, scholarships, grants, or other mission critical needs. So how do fiduciaries bridge this gap between accepting volatility in pursuit of long-term returns while generating stable income for their institution? One of the most effective ways is through a thoughtfully constructed spending policy.

Given the importance of a spending policy, two things surprise us as we meet with investment committees of non-profits: first, that so little time is spent on something so important and second, how many still use what we view to be a flawed and outdated methodology. Most investment committees spend at least one meeting per year comprehensively evaluating asset allocation policy. They review historical models, analyze stress tests, consider future projections, and evaluate important trade-offs. It is not often that we see an investment committee evaluate their spending policy with the same rigor. Instead, many accept the existing policy, which more often than not is some form of a rolling average where the payout is calculated as a set percentage, often 5%, of an average market value over a set period of time, most often three years. A few years ago, we published a white paper1 that argued that the rolling average spending formula was flawed for precisely the reason that it doesn’t achieve the objective set out in so many investment policies. We argued that institutions should consider decoupling their spending calculation from the volatility of the capital markets and linking it instead to the cost structure of the institution or a growth rate, thus reducing the risk of a shortfall. There’s no question the three-year rolling average spending formula has worked brilliantly for the past ten years. Why? Because there has been very little volatility and the general direction of most portfolios has been up. But anyone who remembers the financial crisis of 2008 or the bear market of 2001-2003 knows the challenges of this formula. A comparison of two different spending policies over the past 20 years illustrates this challenge.

img_chart_spending_policy

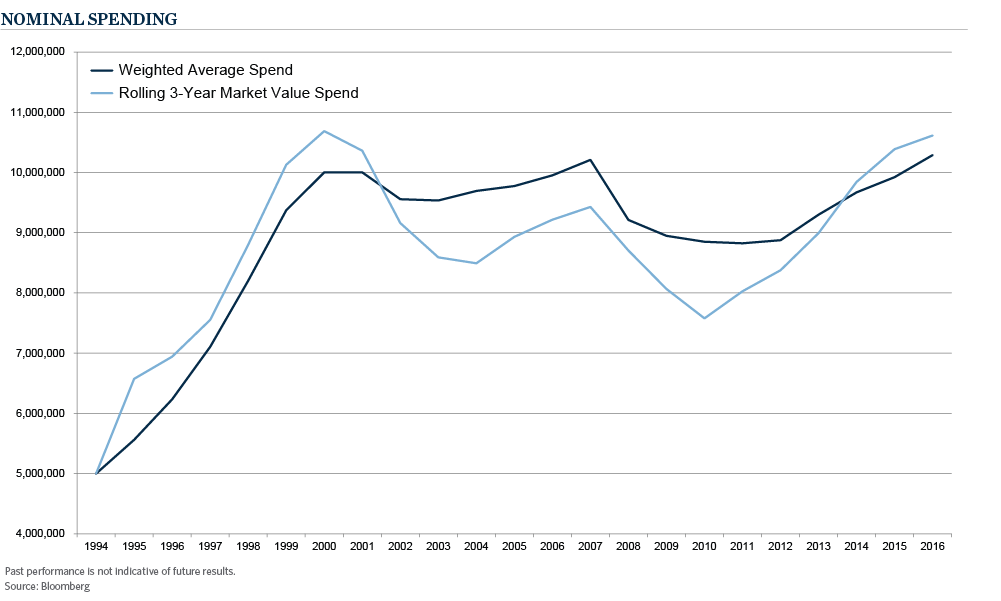
This simple model reflects the nominal spending on a $100mm portfolio that invested 70/30 in the S&P 500 and Bloomberg Barclays U.S. Aggregate Bond Indices. The light blue line is the dollar spend calculated using a 5% rolling three-year calculation. The blue line is the dollar spend using a weighted average formula that considers both inflation (CPI +1%) and market value. Interestingly, both spending formulas produce roughly the same level of aggregate spend yet the paths were quite different. The rolling average formula resulted in a decline in spending of more than 20% from 2000 and 2004 and took 13 years to reclaim the high water mark of 2000. The weighted average spend calculation didn’t reach the same heights yet also didn’t experience the same decline. Or more simply stated, it resulted in a more consistent (i.e., less volatile) payout than the rolling average formula.

We are not advocating the weighted average spending formula as the “perfect” formula for all institutions; there are several different formulas and countless variations of those formulas. Like asset allocation, it is a decision that should be considered in the context of institutional objectives, constraints, and risk profile. Like asset allocation, it is also something that should be evaluated on a regular basis. When under consideration, the spending rate (how much you draw) impacts current spending ability on the one hand and long-term sustainability of the investment portfolio on the other hand. The spending methodology (how you calculate that draw) impacts the variability or volatility of the spending stream. These decisions have important ramifications for your institution which are undoubtedly easier to wrestle with at the end of a long economic expansion than they are at the beginning of the next recession or market correction.

1 Commonfund Institute, Endowment Spending: A Look Back, September 2012.

Timothy T. Yates, Jr.

Author

Timothy T. Yates, Jr.

President and CEO, Commonfund OCIO

Disclaimer

Certain information contained herein has been obtained from or is based on third-party sources and, although believed to be reliable, has not been independently verified. Such information is as of the date indicated, if indicated, may not be complete, is subject to change and has not necessarily been updated. No representation or warranty, express or implied, is or will be given by The Common Fund for Nonprofit Organizations, any of its affiliates or any of its or their affiliates, trustees, directors, officers, employees or advisers (collectively referred to herein as “Commonfund”) or any other person as to the accuracy or completeness of the information in any third-party materials. Accordingly, Commonfund shall not be liable for any direct, indirect or consequential loss or damage suffered by any person as a result of relying on any statement in, or omission from, such third-party materials, and any such liability is expressly disclaimed.

All rights to the trademarks, copyrights, logos and other intellectual property listed herein belong to their respective owners and the use of such logos hereof does not imply an affiliation with, or endorsement by, the owners of such trademarks, copyrights, logos and other intellectual property.

To the extent views presented forecast market activity, they may be based on many factors in addition to those explicitly stated herein. Forecasts of experts inevitably differ. Views attributed to third-parties are presented to demonstrate the existence of points of view, not as a basis for recommendations or as investment advice. Market and investment views of third-parties presented herein do not necessarily reflect the views of Commonfund, any manager retained by Commonfund to manage any investments for Commonfund (each, a “Manager”) or any fund managed by any Commonfund entity (each, a “Fund”). Accordingly, the views presented herein may not be relied upon as an indication of trading intent on behalf of Commonfund, any Manager or any Fund.

Statements concerning Commonfund’s views of possible future outcomes in any investment asset class or market, or of possible future economic developments, are not intended, and should not be construed, as forecasts or predictions of the future investment performance of any Fund. Such statements are also not intended as recommendations by any Commonfund entity or any Commonfund employee to the recipient of the presentation. It is Commonfund’s policy that investment recommendations to its clients must be based on the investment objectives and risk tolerances of each individual client. All market outlook and similar statements are based upon information reasonably available as of the date of this presentation (unless an earlier date is stated with regard to particular information), and reasonably believed to be accurate by Commonfund. Commonfund disclaims any responsibility to provide the recipient of this presentation with updated or corrected information or statements. Past performance is not indicative of future results. For more information please refer to Important Disclosures.

Stay connected with the Insights Blog

Popular Blog Posts


Market Commentary | Insights Blog

Chart of the Month | U.S. Budget Deficit Hits Record Highs

In his first 100 days as President of the United States, Joe Biden has introduced three domestic funding proposals, totaling close to $6.0 Trillion, reflecting a desire to enhance the role of the...
Perspectives | Insights Blog

The Case for Using the Higher Education Price Index® (HEPI) to Define Inflation for Colleges

When calculating return targets for an endowment portfolio, a conventional piece of the equation is often the Consumer Price Index (CPI). CPI plus 5% is the common short-hand formula for institutions...
Market Commentary | Insights Blog

Chart of the Month | The Surprising Relationship Between Money Supply and Inflation

The potential for rising inflation is becoming a top concern for many investors and consumers. Many believe that inflation is already here as evidenced by price increases in commodities, homes,...

Disclaimer

Certain information contained herein has been obtained from or is based on third-party sources and, although believed to be reliable, has not been independently verified. Such information is as of the date indicated, if indicated, may not be complete, is subject to change and has not necessarily been updated. No representation or warranty, express or implied, is or will be given by The Common Fund for Nonprofit Organizations, any of its affiliates or any of its or their affiliates, trustees, directors, officers, employees or advisers (collectively referred to herein as “Commonfund”) or any other person as to the accuracy or completeness of the information in any third-party materials. Accordingly, Commonfund shall not be liable for any direct, indirect or consequential loss or damage suffered by any person as a result of relying on any statement in, or omission from, such third-party materials, and any such liability is expressly disclaimed.

All rights to the trademarks, copyrights, logos and other intellectual property listed herein belong to their respective owners and the use of such logos hereof does not imply an affiliation with, or endorsement by, the owners of such trademarks, copyrights, logos and other intellectual property.

To the extent views presented forecast market activity, they may be based on many factors in addition to those explicitly stated herein. Forecasts of experts inevitably differ. Views attributed to third-parties are presented to demonstrate the existence of points of view, not as a basis for recommendations or as investment advice. Market and investment views of third-parties presented herein do not necessarily reflect the views of Commonfund, any manager retained by Commonfund to manage any investments for Commonfund (each, a “Manager”) or any fund managed by any Commonfund entity (each, a “Fund”). Accordingly, the views presented herein may not be relied upon as an indication of trading intent on behalf of Commonfund, any Manager or any Fund.

Statements concerning Commonfund’s views of possible future outcomes in any investment asset class or market, or of possible future economic developments, are not intended, and should not be construed, as forecasts or predictions of the future investment performance of any Fund. Such statements are also not intended as recommendations by any Commonfund entity or any Commonfund employee to the recipient of the presentation. It is Commonfund’s policy that investment recommendations to its clients must be based on the investment objectives and risk tolerances of each individual client. All market outlook and similar statements are based upon information reasonably available as of the date of this presentation (unless an earlier date is stated with regard to particular information), and reasonably believed to be accurate by Commonfund. Commonfund disclaims any responsibility to provide the recipient of this presentation with updated or corrected information or statements. Past performance is not indicative of future results. For more information please refer to Important Disclosures.