Tactical Allocation: Winning Strategy or a Fool’s Game?

October 4, 2019 |
4 minute read
|

Institutional investors overseeing long-term pools of capital typically define their strategic asset allocation with specific targets and bands or ranges around those targets, which allow for tactical positioning. These bands are also used to trigger rebalancing trades to ensure a disciplined approach to maintaining the stated portfolio allocations. At Commonfund, we define tactical asset allocation as intentional market timing – taking over- and under-weight positions around the policy portfolio targets.

For example, if we were to say we are “overweight equities relative to our policy portfolio”, that is a tactical allocation decision. Much of the asset management industry has been built on the belief that some investors can consistently predict what the market will do and where it is going. It's not surprising – in an uncertain world selling the idea that knowing the future is a skill that can be harnessed to deliver superior results is extremely appealing. But, are professional investors able to consistently predict where the market is going and profit from that knowledge? In this blog we will share what we see in the data and how our research informs us as investors.

What Do We See in the Data?

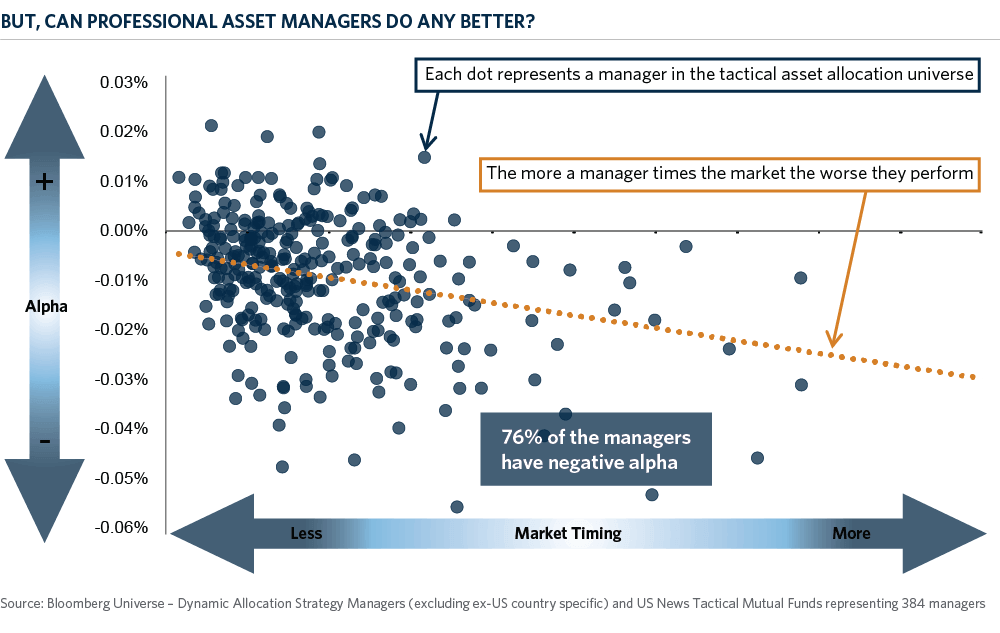
To better understand the merits (or not) of tactical allocation we looked at a Bloomberg asset manager universe of roughly 400 tactical asset allocators. Each manager had at least a two-year track record over a twenty-year look-back period. The blue dots in the figure below each represent one of these managers – plotted by degree of market timing (X-Axis) and return versus their stated benchmark or Alpha (Y-Axis). This analysis attempts to answer two questions.
img-CH-01-TacticalAllocation-WinningStrategy

Question 1: Do the managers in this universe have skill at market timing?

We used regression analysis to identify and isolate the primary risks that these managers take in their strategies – equity and interest rate risk – to see if they generate excess returns after we control for these factors. The 24% of managers represented by the blue dots that fall above the black zero line are delivering alpha through their tactical allocations. However, a full three quarters or 76% of the managers on this chart are delivering negative alpha through market timing and detracting from returns for their investors.

Question 2: Is there a relationship between performance and the degree of market timing a manager engages in?

We used a second regression analysis to account for each manager's variability in their market risk or beta exposure over time. The managers (blue dots) to the left are timing the market less often, and managers to the right are timing the market more often. The orange best-fit line shows the relationship or correlation between skill and the degree of market timing. We can see that the line is sloping down, meaning the more a manager tries to market time the worse their performance.

These two simple analyses indicate that investors should be wary of managers who claim to able to add value through tactical allocation tilts. The numbers indicate that is exceedingly difficult – and keep in mind that these are the survivors in the universe – it doesn't include the funds that closed during the twenty-year period!

Measuring and Sizing Tactical Risk

Among the many reasons that winning with tactical bets is so difficult is that it requires getting three things right:

  1. Which strategy/region/asset/trade to over- or under-weight,
  2. When to get in, and
  3. When to get out.

Given the difficulties, it behooves those who still want to take this approach to understand exactly how much risk they are budgeting for this activity – and sizing it appropriately.

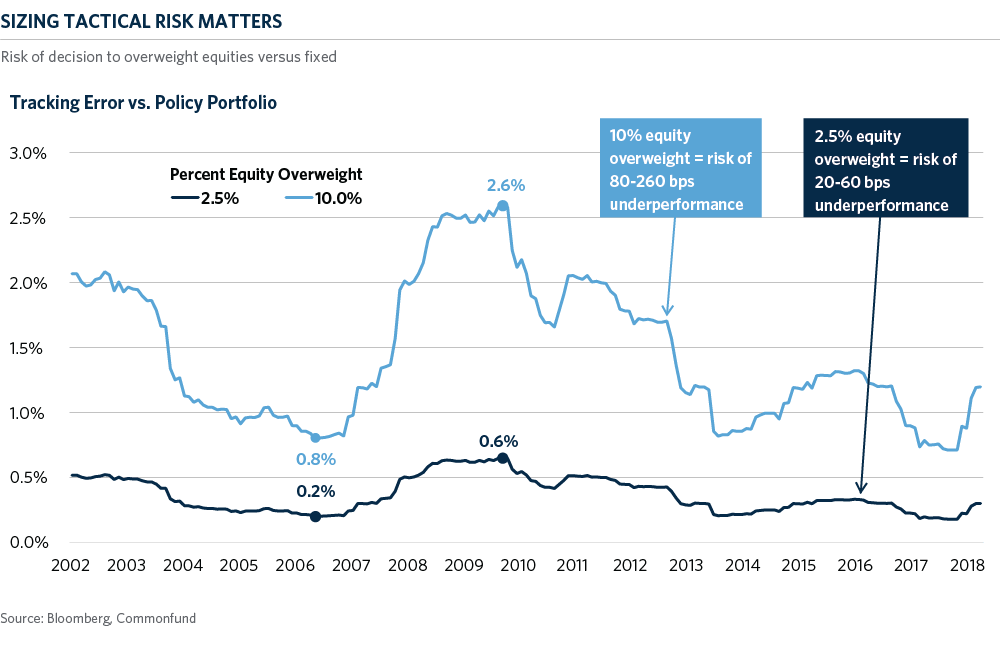
As a simple illustration, the chart below starts with a strategic policy portfolio allocation of 70 percent equities and 30 percent fixed income and then looks at how 10 percent and 2.5 percent over-weights impact tracking error and potential underperformance versus the policy portfolio (risk) over time. Over this period the cost of being wrong with a 10 percent equity overweight swings between a low of 80 basis points and a high of 260 basis points. These are significant numbers in the context of the total portfolio. At the other end of the spectrum, the blue line shows the risk of a significantly smaller 2.5 percent overweight to equities. At first blush this may seem like a small bet to take, but it has the potential to drive 20-60 basis points of over- or underperformance. When sizing our tactical bets, we think about how that risk contribution compares to the highest conviction manager in a portfolio – aiming to keep it in-line or less than what we expect from any single manager.
img-CH-02-TacticalAllocation-WinningStrategy

Winning the Fool's Game

Given our research findings discussed above, one might assume that Commonfund avoids making tactical bets in the portfolios that we run. However, despite the evidence, we do believe that tactical allocation can add value, but the devil is in the execution details. Our approach includes three critical guiding principles. First, we believe that tactical tilts should align with the long-term horizon of our institutional clients so we evaluate any opportunities with the expectation that we should take positions for months or years, not days or weeks. Our process focuses on four catalysts that we believe are the most important when evaluating market opportunities or threats:

  1. Growth

  2. Inflation
  3. Monetary policy

  4. Interest rates

Note – these are all longer-term fundamental indicators – not short-term technicals like price action or sentiment. We track several data points and measures against each of these catalysts.

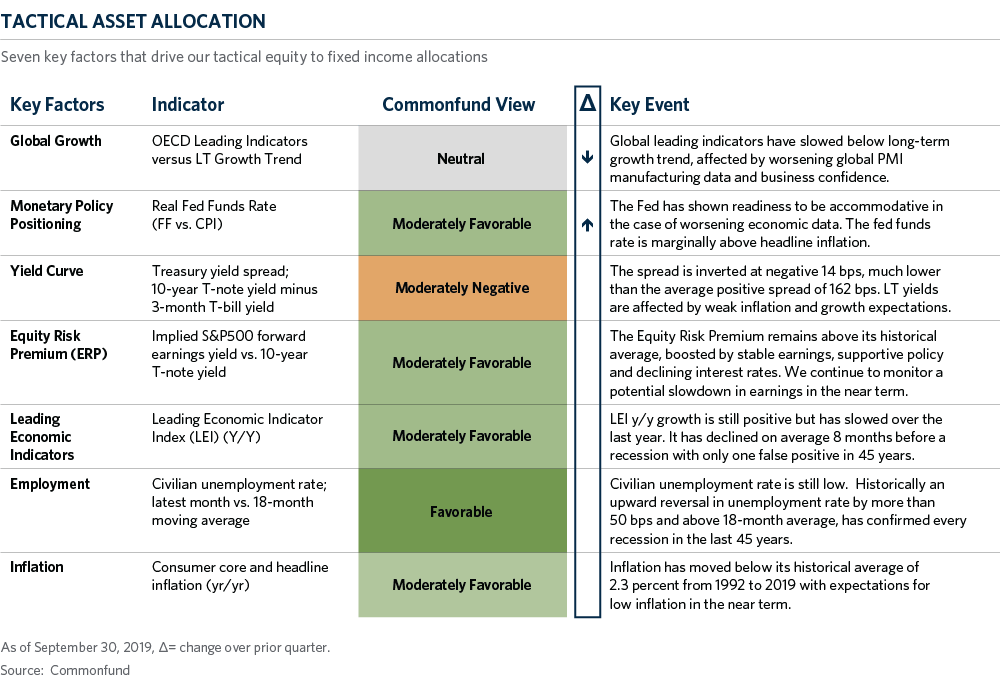
Second, we believe that a consistent process is critical, so we look at the same measures every month without deviation. We do this to avoid the temptation to adjust the data to fit with a pre-determined view or bias. Below is an example of the summary dashboard that we use.
img-CH-03-TacticalAllocation-WinningStrategy

Third, as discussed above, we are very careful about sizing a tactical position when we institute one. The reason for this gets back to our skepticism about adding value through this lever. At Commonfund, we believe that our edge is in designing a strategic allocation, manager selection and access, and delivering the liquidity premium to investors. Thus, we are careful to appropriately size any tactical allocation risk so that it does not overwhelm the potential return benefits of those components. And, we only take a tactical position when our conviction is high and supported by the data and our process.

Visit our Commonfund Research Center to learn more about risk management. 

Find out more about our investment philosophy and how we can help your institution.

 
Deborah Spalding

Author

Deborah Spalding

Chief Investment Officer

Deborah Spalding

Author

Kristofer Kwait

Chief Market Strategist

Disclaimer

Certain information contained herein has been obtained from or is based on third-party sources and, although believed to be reliable, has not been independently verified. Such information is as of the date indicated, if indicated, may not be complete, is subject to change and has not necessarily been updated. No representation or warranty, express or implied, is or will be given by The Common Fund for Nonprofit Organizations, any of its affiliates or any of its or their affiliates, trustees, directors, officers, employees or advisers (collectively referred to herein as “Commonfund”) or any other person as to the accuracy or completeness of the information in any third-party materials. Accordingly, Commonfund shall not be liable for any direct, indirect or consequential loss or damage suffered by any person as a result of relying on any statement in, or omission from, such third-party materials, and any such liability is expressly disclaimed.

All rights to the trademarks, copyrights, logos and other intellectual property listed herein belong to their respective owners and the use of such logos hereof does not imply an affiliation with, or endorsement by, the owners of such trademarks, copyrights, logos and other intellectual property.

To the extent views presented forecast market activity, they may be based on many factors in addition to those explicitly stated herein. Forecasts of experts inevitably differ. Views attributed to third-parties are presented to demonstrate the existence of points of view, not as a basis for recommendations or as investment advice. Market and investment views of third-parties presented herein do not necessarily reflect the views of Commonfund, any manager retained by Commonfund to manage any investments for Commonfund (each, a “Manager”) or any fund managed by any Commonfund entity (each, a “Fund”). Accordingly, the views presented herein may not be relied upon as an indication of trading intent on behalf of Commonfund, any Manager or any Fund.

Statements concerning Commonfund’s views of possible future outcomes in any investment asset class or market, or of possible future economic developments, are not intended, and should not be construed, as forecasts or predictions of the future investment performance of any Fund. Such statements are also not intended as recommendations by any Commonfund entity or any Commonfund employee to the recipient of the presentation. It is Commonfund’s policy that investment recommendations to its clients must be based on the investment objectives and risk tolerances of each individual client. All market outlook and similar statements are based upon information reasonably available as of the date of this presentation (unless an earlier date is stated with regard to particular information), and reasonably believed to be accurate by Commonfund. Commonfund disclaims any responsibility to provide the recipient of this presentation with updated or corrected information or statements. Past performance is not indicative of future results. For more information please refer to Important Disclosures.

Stay connected with the Insights Blog

Popular Blog Posts


Market Commentary | Insights Blog

Chart of the Month | U.S. Budget Deficit Hits Record Highs

In his first 100 days as President of the United States, Joe Biden has introduced three domestic funding proposals, totaling close to $6.0 Trillion, reflecting a desire to enhance the role of the...
Investment Strategy | Insights Blog

Key Factors in Asset Allocation Decisions for Endowments

There are several broad subjects that an effective investment policy statement (IPS) should include in its contents and address clearly and specifically as they relate to an endowed institution. This...
Perspectives | Insights Blog

The Case for Using the Higher Education Price Index® (HEPI) to Define Inflation for Colleges

When calculating return targets for an endowment portfolio, a conventional piece of the equation is often the Consumer Price Index (CPI). CPI plus 5% is the common short-hand formula for institutions...

Disclaimer

Certain information contained herein has been obtained from or is based on third-party sources and, although believed to be reliable, has not been independently verified. Such information is as of the date indicated, if indicated, may not be complete, is subject to change and has not necessarily been updated. No representation or warranty, express or implied, is or will be given by The Common Fund for Nonprofit Organizations, any of its affiliates or any of its or their affiliates, trustees, directors, officers, employees or advisers (collectively referred to herein as “Commonfund”) or any other person as to the accuracy or completeness of the information in any third-party materials. Accordingly, Commonfund shall not be liable for any direct, indirect or consequential loss or damage suffered by any person as a result of relying on any statement in, or omission from, such third-party materials, and any such liability is expressly disclaimed.

All rights to the trademarks, copyrights, logos and other intellectual property listed herein belong to their respective owners and the use of such logos hereof does not imply an affiliation with, or endorsement by, the owners of such trademarks, copyrights, logos and other intellectual property.

To the extent views presented forecast market activity, they may be based on many factors in addition to those explicitly stated herein. Forecasts of experts inevitably differ. Views attributed to third-parties are presented to demonstrate the existence of points of view, not as a basis for recommendations or as investment advice. Market and investment views of third-parties presented herein do not necessarily reflect the views of Commonfund, any manager retained by Commonfund to manage any investments for Commonfund (each, a “Manager”) or any fund managed by any Commonfund entity (each, a “Fund”). Accordingly, the views presented herein may not be relied upon as an indication of trading intent on behalf of Commonfund, any Manager or any Fund.

Statements concerning Commonfund’s views of possible future outcomes in any investment asset class or market, or of possible future economic developments, are not intended, and should not be construed, as forecasts or predictions of the future investment performance of any Fund. Such statements are also not intended as recommendations by any Commonfund entity or any Commonfund employee to the recipient of the presentation. It is Commonfund’s policy that investment recommendations to its clients must be based on the investment objectives and risk tolerances of each individual client. All market outlook and similar statements are based upon information reasonably available as of the date of this presentation (unless an earlier date is stated with regard to particular information), and reasonably believed to be accurate by Commonfund. Commonfund disclaims any responsibility to provide the recipient of this presentation with updated or corrected information or statements. Past performance is not indicative of future results. For more information please refer to Important Disclosures.