The central document guiding the management of a nonprofit institution’s endowment—essentially, the strategic plan of the investment committee—is the investment policy statement (IPS). The IPS should be specific, embodying in concrete terms the best thinking of the board of trustees about the investment pool, its goals and its purposes; but it also needs to be sufficiently flexible to guide the board through environments that may be very different from those prevailing at the time of its adoption.
In this second blog in the series outlining “the 6 Ps of investment stewardship” We will discuss Policy, an essential principle of effective endowment management. (Click here to read about the first Principle – Purpose)
Endowed institutions differ in their missions, capabilities and resources, and investment policy statements naturally mirror these differences. In that sense, there is no single “right” IPS; each institution’s board must craft a statement that responds to the needs of the institution and the preferences and risk tolerances of the trustees.
There are five key points that should be addressed specifically and in some detail in the IPS: return targets, spending (formula and rate), asset allocation, risk management and liquidity.
RETURN OBJECTIVES
If the board aspires to maintain the purchasing power of the investment pool over time, then assumptions must be made about the long-term spending rate from the endowment, the anticipated rate of inflation and investment management costs. In addition, many institutions add an increment for the growth of the endowment’s corpus. With regard to the spending rate, both practical experience and economic modeling tools have demonstrated that it is rarely possible to spend in excess of 5 percent of the portfolio each year without suffering an erosion in purchasing power over time. As for inflation, it has fluctuated considerably over time; an assumed long-term rate of 2 percent is generally used. Administrative and other costs typically are considered to add 1 percent to the expense base.
SPENDING
Spending (sometimes referred to as “payout”) is the amount withdrawn from the endowment on an annual basis to fund the institution’s operations or, on occasion, to support an exceptional, specific expenditure.
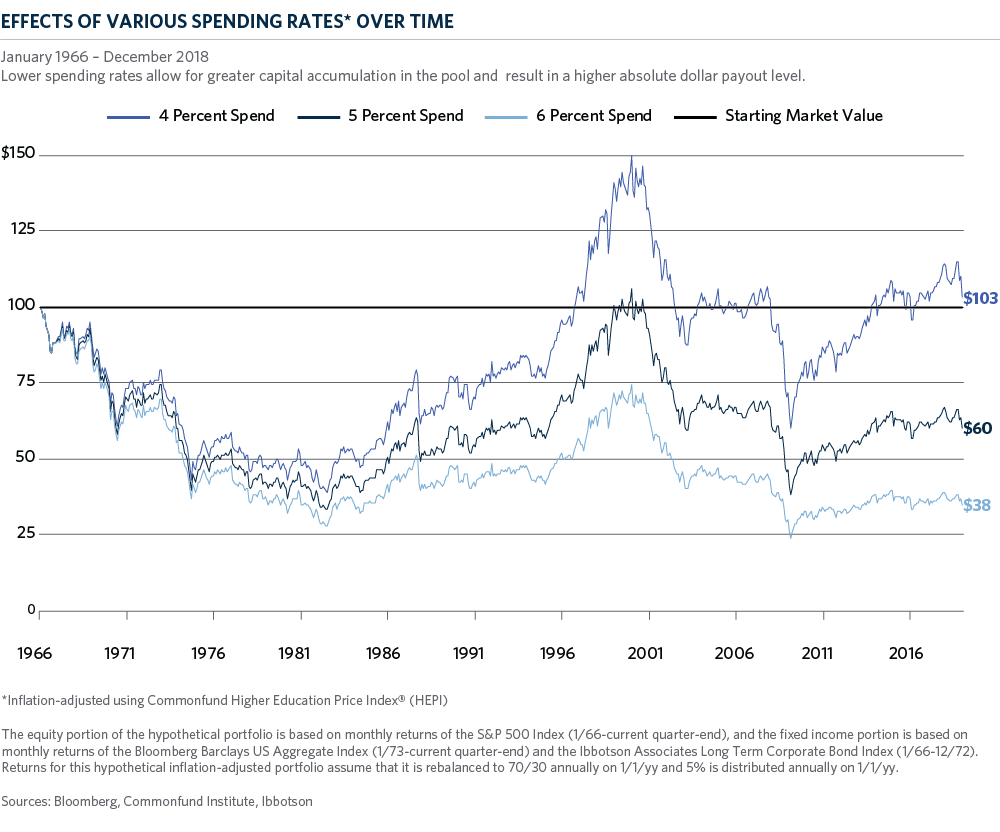
The two key components of the spending policy are the rate of spending and the formulas used to calculate it. The actual rate will vary with the methodology, spending rates typically average between 4.5 and 5.5 percent of the net asset value of the investment pool (private foundations are required to spend a minimum of 5.0 percent of their endowment’s market value each year, subject to certain adjustments). Over the long term, spending restraint increases the likelihood that the fund will be able to grow in dollar terms and is most likely to maintain or increase its purchasing power. Chart A shows how three spending rates (4, 5 and 6 percent) will impact the value of an endowment over a long period of time (50 years). All things being equal, the lower spending rate is most likely to achieve long-term purchasing power parity.
There are three types of spending formulas in wide use. (The primary spending methodologies can be referenced at the end of this blog.) The most widely used approach involves spending a percentage of the fund’s market value each year, usually calculated by using a smoothing or averaging technique that aims to reduce the variation in spending from year to year. Another group of methods relies less on the fund’s market value and seeks instead to maintain a stable level of dollar spending from year to year. Still a third group of methodologies uses a hybrid approach in which a market value-based rule is combined with an inflation-based rule.
ASSET ALLOCATION
The implementation of an asset allocation policy will be discussed in greater detail in Principle Four (“Portfolio”). But to underscore its importance, a landmark study on the subject attributed more than 90 percent of the variability of return not to manager selection or market timing but to asset allocation.1 The objective of allocating across various asset classes and strategies is to ensure the proper level of diversification within the endowment. The purpose of diversification is pursuit of the highest risk-adjusted return, or the highest expected portfolio return for a given level of risk (or the lowest expected risk for a given level of return). This is referred to as “the efficient frontier” and is expressed graphically as the efficient frontier curve because portfolios lying beneath the efficient frontier do not provide enough return for the level of risk incurred.
In the IPS, asset allocation is referred to as the “policy portfolio” or “policy allocation,” which specifies the percentage target weightings for each asset class or strategy and the ranges around those targets. The actual allocation at any point in time may vary from the policy portfolio owing to the market performance of the various allocations. It is the return on this portfolio that is measured against the benchmarks specified in the investment policy statement. Within the policy portfolio’s target asset allocation categories, the IPS may indicate percentage ranges above or below which the endowment may vary from the target. These represent opportunities to express a more tactical view on particular investment opportunities without departing from the overall allocation scheme.
As time passes, certain asset classes/strategies will have higher or lower returns than others and the portfolio will need to be rebalanced in order to restore it to the target levels. This is accomplished by proportionally selling those assets that have increased in value and using the proceeds to purchase those that have lagged or decreased—a practice that may seem counterintuitive until it is realized that buying low and selling high is the goal of every good investor.
RISK MANAGEMENT
What kind and degree of risk is the investment committee prepared to take in pursuit of its investment goals? How are risks to be defined and measured? How long would an institution be faced with a decline in endowment spending in the event of a market shock? These are the kinds of questions that are asked in the process of formulating an approach to risk management.
Indeed, the risk tolerance of a nonprofit organization with respect to its long-term investment pool is one of the most important topics to be considered when framing an IPS. Historically, many policy statements treated investment risk as a byproduct of investing rather than as an essential precondition to earning investment returns. References to risk typically spoke of it as something to be “managed” in a general sense. Now, with powerful financial models available to enable fiduciaries to estimate the probability and range of possible losses associated with given investment strategies over time, risk is no longer treated as a byproduct of investment decisions but, rather, a primary input.
While great progress has been made in risk management, it is important to emphasize that although risk can be modeled and to some degree understood, it cannot be eliminated if the portfolio’s goal is to achieve a long-term return after spending and costs that is in excess of inflation. The question for fiduciaries, then, becomes whether the risks associated with a particular investment strategy are acceptable.
LIQUIDITY
If the endowment is there for supporting the budget, its role is quite clear. But if it is also meant to support a credit rating—as in the case with hospitals—that introduces a new set
of considerations and it should be worked into the institution’s risk and return expectations. There is a strong case to be made for linking the investment policy with the institution’s balance sheet as well as its long-term strategic plan. A growing number of institutions are doing this, and are also addressing gifts and debt in their investment policy.
Spending Policy Examples |
||||
|
Assumptions |
|
|
|
|
|
Endowment |
$100,000,000 |
|
|
|
|
Spending Rate |
5% |
|
|
|
|
Prior Year Spend |
$5,000,000 |
|
|
|
|
Inflation Rate |
3% |
|
|
|
|
|
|
|
|
|
|
Spending Policy Approach |
Definition |
Spending Equation |
Spend |
|
Category I:
|
|
|
|
|
|
Income-Based |
Spend all current income. |
Endowment Income |
$4,500,000 |
|
|
Decide on an appropriate |
|
|
|
|
|
Spend a pre-specified |
|
|
|
|
|
Meet IRS minimum of |
For private foundations subject to this requirement. |
|
|
|
Category II:
|
|
|
|
|
|
Inflation-Based |
Increase spending each year based on rate of inflation. |
(Endowment x Rate) + Inflation Adjustment |
$5,150,000 |
|
|
Banded Inflation |
Last year’s spending plus an inflation rate, |
Prior Year Spend x (1 + Current Inflation Rate) |
$5,175,000 |
|
|
|
|
If calculated spending dollars are below Lower Band then default to Lower Band amount and if dollars are above Upper Band then default to Upper Band. |
|
|
Category III:
|
|
|
|
|
|
Traditional |
Pre-specified percentage of moving average of market value — typically 5% of a three-year moving average of beginning market values. |
Endowment x Rate |
$5,000,000 |
|
|
Spending Reserve |
Segregation of 5–10% of market value in separate account, invested in 90-day Treasury bills. Reserve is drawn down when endowment performance is less than policy target. |
|
|
|
|
Stabilization Fund |
A fund created from endowment returns in excess of the target spending rate which is used to control the long-run growth of the total endowment. The stabilization fund is invested alongside the endowment, but with a different (higher) spending rate. |
(Original Endowment x Spending Rate) + (Stabilization Fund Balance at end of previous fiscal period x Spending Rate) |
|
|
Category IV:
|
|
|
|
|
|
Yale Rule |
The amount released under the spending rule is based on a weighted average of prior spending adjusted for inflation (80% weight) and the amount that would have been spent using 5% of current endowment market value (20% weight). |
(Prior year Market Value x Spending Rate |
$5,120,000 |
|
|
Stanford Rule |
The amount released under the spending rule is based on a weighted average of prior spending adjusted for inflation (60% weight) and the amount that would have been spent using 5% of current endowment market value (40% weight). |
(Prior year Market Value x Spending Rate |
$5,090,000 |
Want to learn more details about the five key points of Policy and the Six Ps of Investment Stewardship? Click here to download our brochure, Principles of Investment Stewardship for Nonprofit Organizations.

1 Brinson, Gary P., L. Randolph Hood, and Gilbert L. Beebower. 1986. “Determinants of Portfolio Performance,” Financial Analyst Journal, July/August, Vol. 42, No. 4: 39-44. See also, Brinson, Singer and Beebower. 1991. “Determinants of Portfolio Performance II: An Update,” Financial Analyst Journal, May/June, Vol. 47, No. 3: 40-48.
