The Case for Using the Higher Education Price Index® (HEPI) to Define Inflation for Colleges

June 24, 2019 |
1 minute read
|

When calculating return targets for an endowment portfolio, a conventional piece of the equation is often the Consumer Price Index (CPI). CPI plus 5% is the common short-hand formula for institutions to achieve intergenerational equity, focusing on growing the endowment and maintaining purchasing power. With that said, although CPI +5% is used widely, we believe it does not best capture the expense structure for colleges and universities.

The Higher Education Price Index (HEPI) is an inflation index, calculated on a July 1 – June 30 fiscal year that matches that of most higher education institutions, that is designed specifically for higher education and may be a more accurate indicator for colleges and universities than CPI.

Compiled from data reported by governmental and industry sources, HEPI measures the average relative level in the prices of a fixed basket of goods and services purchased by colleges and universities each year through current fund educational and general expenditures, excluding research. HEPI includes eight components that cover most of the current operational costs of colleges and universities and is an essential tool enabling schools to determine increases in funding necessary to maintain purchasing power and investment. The CPI, on the other hand, measures goods and services that consumers buy day-to-day.

img - How Does Your Institution Define Inflation?

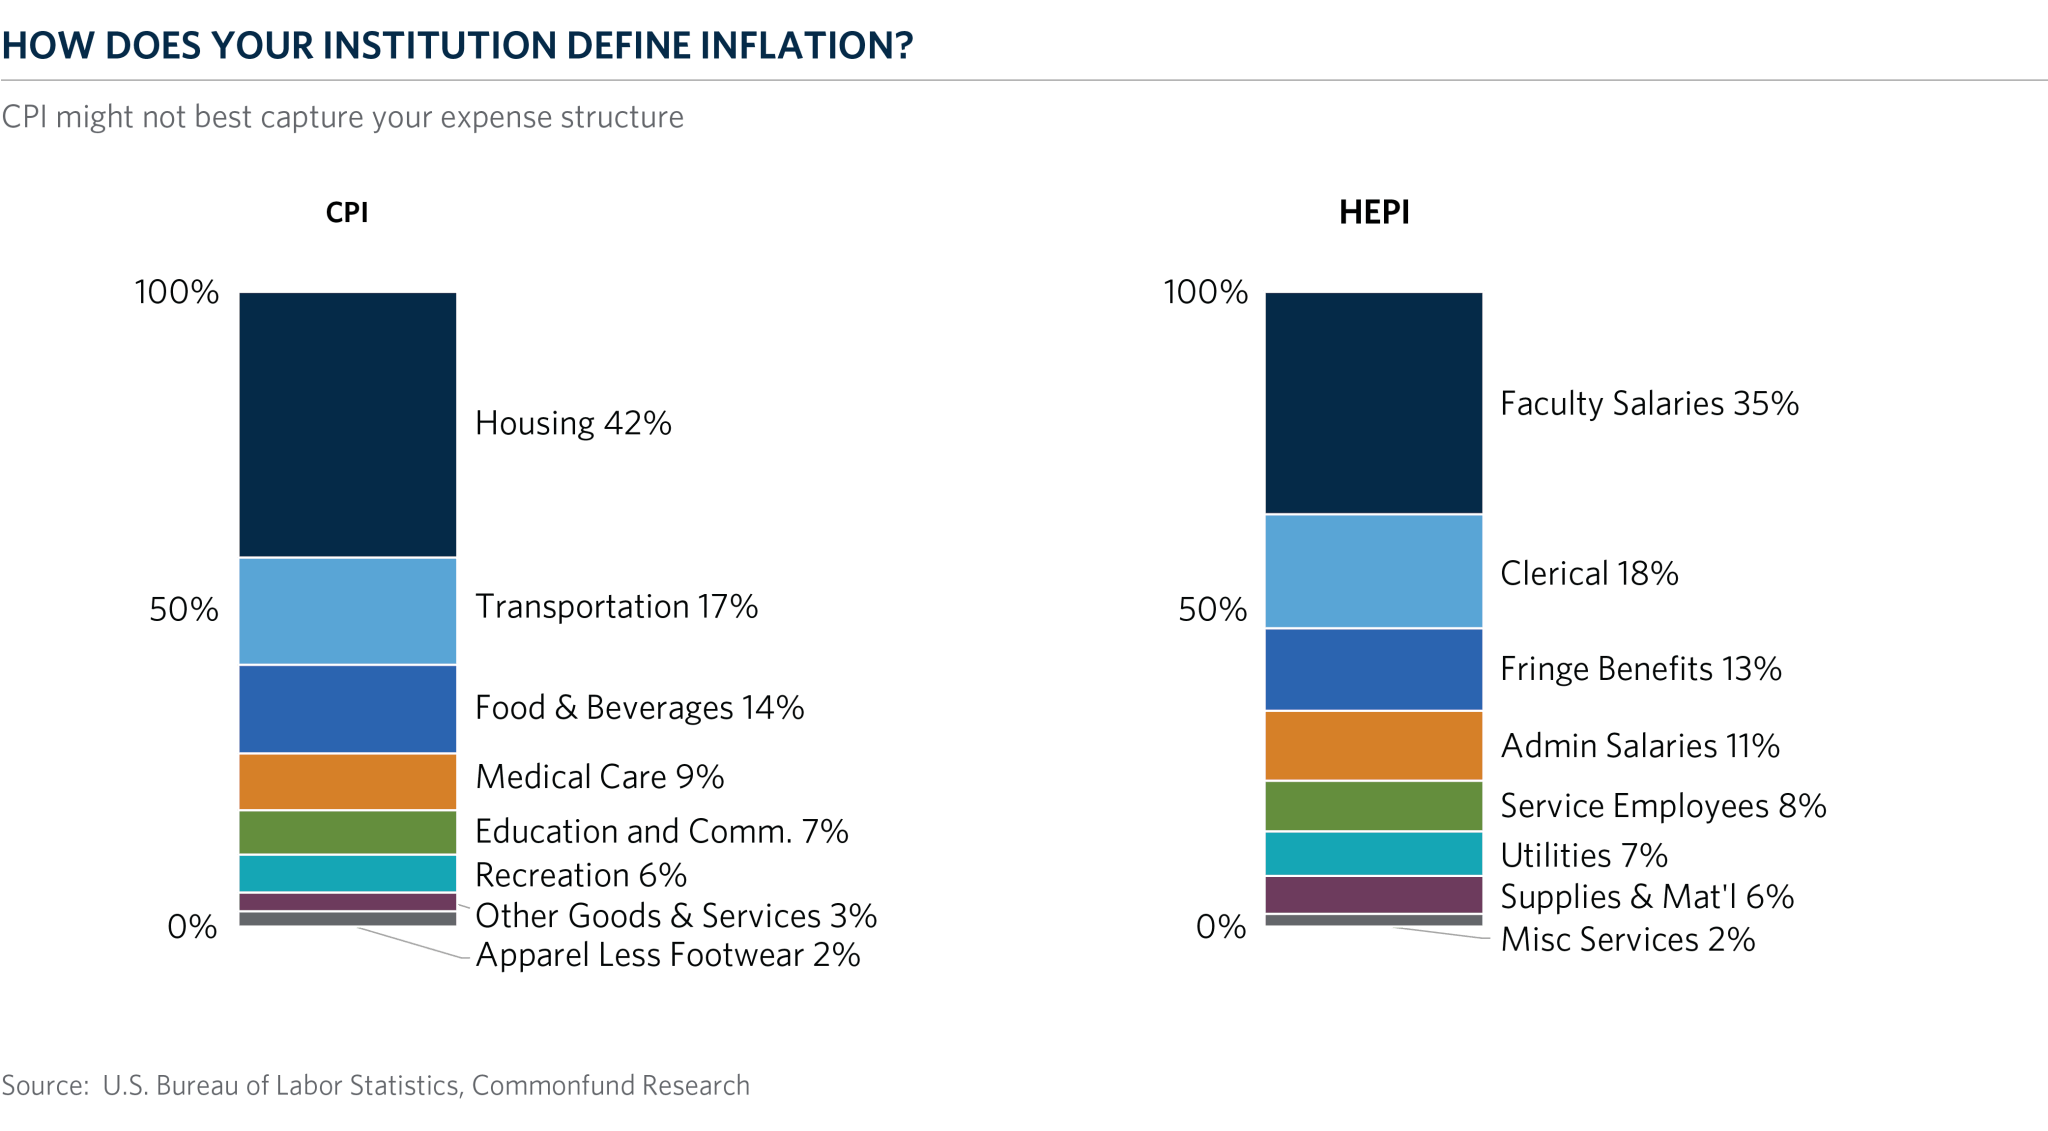
HEPI components are based on price data for 45 budget components that all schools can report, organized in eight component sub-indexes: faculty salaries; administrative salaries; clerical salaries; service employee salaries; fringe benefits; miscellaneous services; supplies & materials; and utilities.

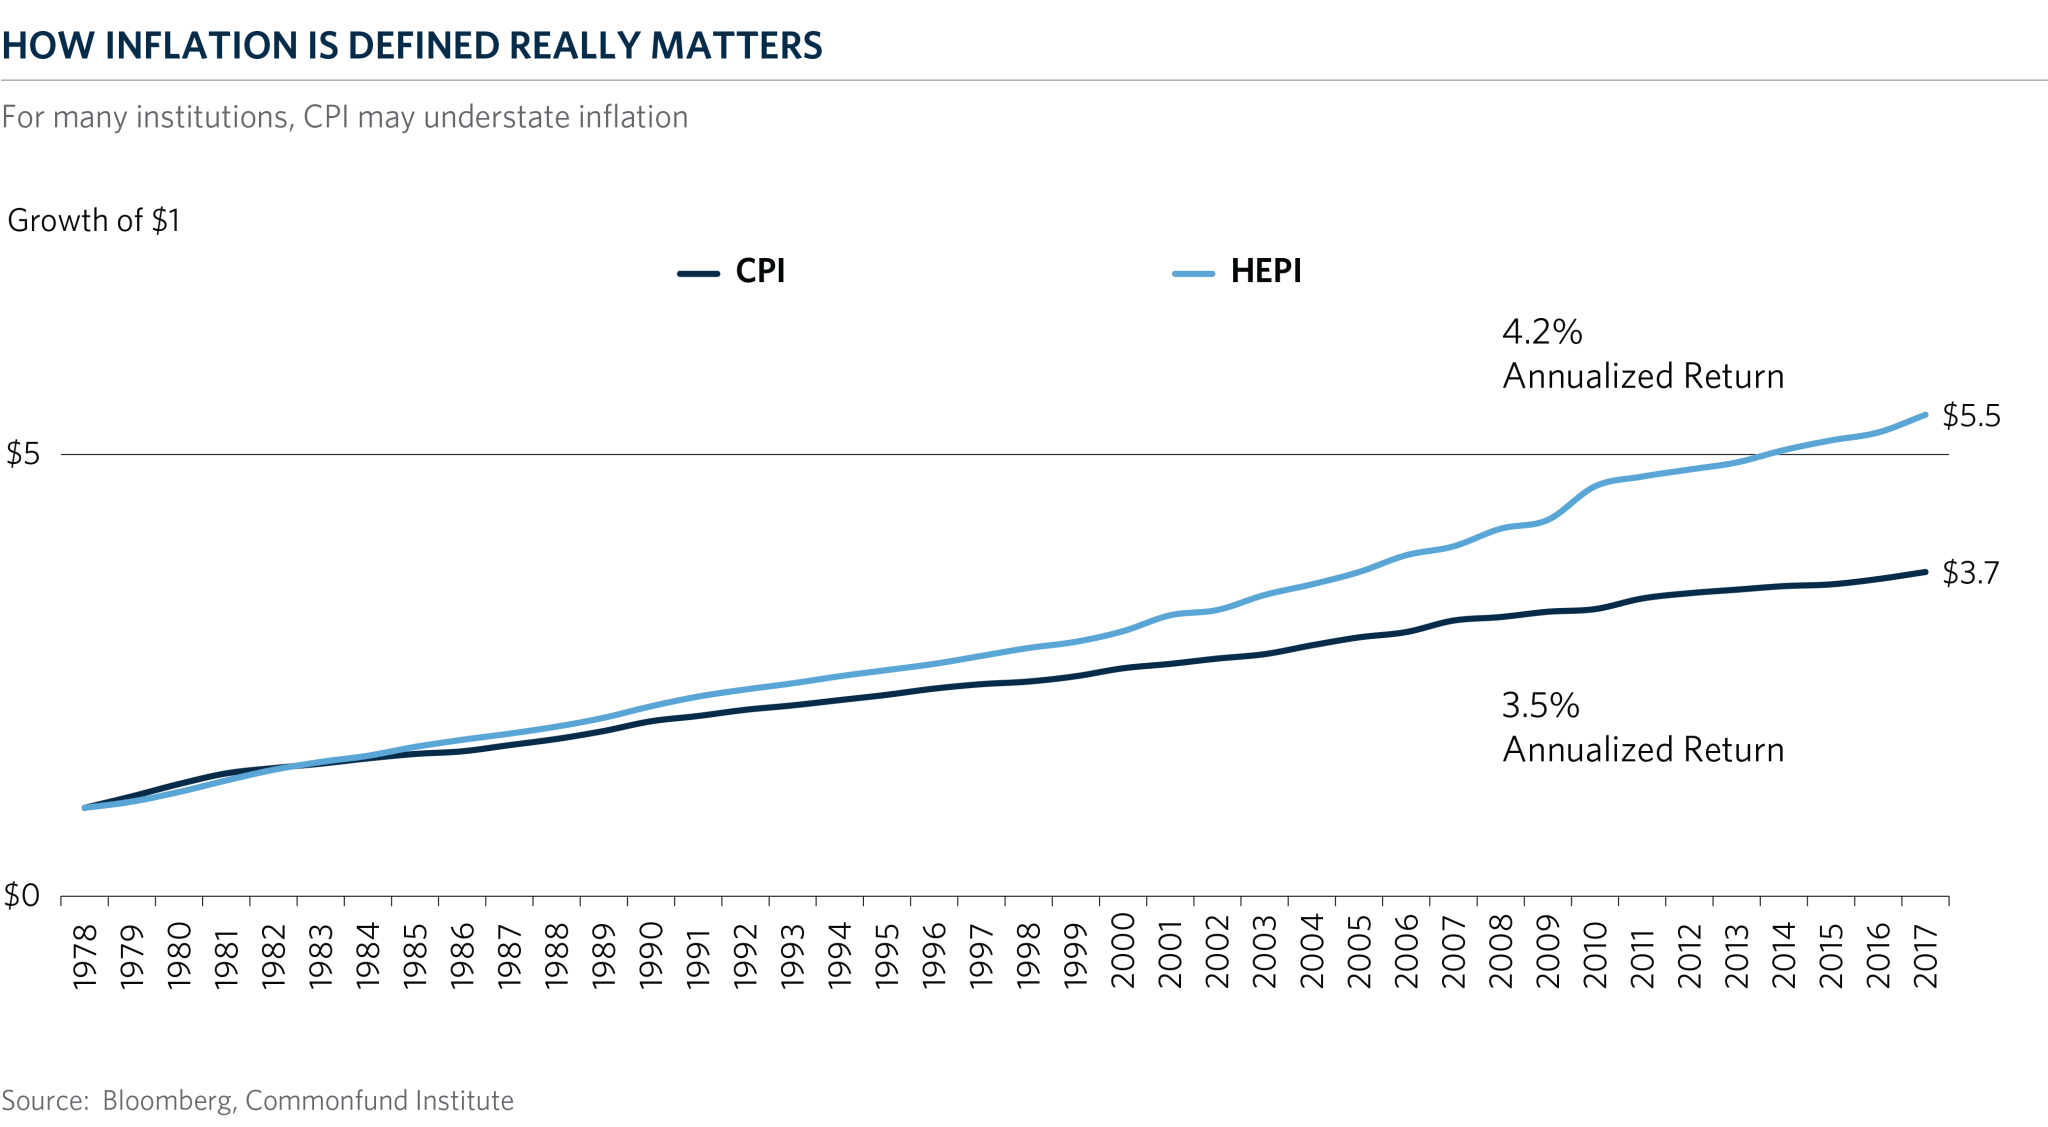
HEPI is used primarily to project future budget increases required to preserve purchasing power. It is a measure of inflation for current operations, for budget hearings to justify the minimum funding requirements to maintain purchasing power, and a guideline for trends in other expense areas such as faculty salaries. For colleges and universities, how inflation is defined really matters to their ability to meet current and future spending needs as can be seen in the chart below comparing the growth of $1 dollar inflated by CPI versus HEPI.


Download the latest HEPI Report Today.


img - How Inflation is Defined Really Matters

HEPI has been widely recognized as the only benchmark to effectively monitor changes in the purchasing power of higher educational institutions. Further, as many institutions have found HEPI to be a practical tool in the successful establishment of important policies, The Commonfund Institute will continue to produce and widely disseminate it within the higher education community.

Woman looking at report

George Suttles

Author

George Suttles

Executive Director

Disclaimer

Certain information contained herein has been obtained from or is based on third-party sources and, although believed to be reliable, has not been independently verified. Such information is as of the date indicated, if indicated, may not be complete, is subject to change and has not necessarily been updated. No representation or warranty, express or implied, is or will be given by The Common Fund for Nonprofit Organizations, any of its affiliates or any of its or their affiliates, trustees, directors, officers, employees or advisers (collectively referred to herein as “Commonfund”) or any other person as to the accuracy or completeness of the information in any third-party materials. Accordingly, Commonfund shall not be liable for any direct, indirect or consequential loss or damage suffered by any person as a result of relying on any statement in, or omission from, such third-party materials, and any such liability is expressly disclaimed.

All rights to the trademarks, copyrights, logos and other intellectual property listed herein belong to their respective owners and the use of such logos hereof does not imply an affiliation with, or endorsement by, the owners of such trademarks, copyrights, logos and other intellectual property.

To the extent views presented forecast market activity, they may be based on many factors in addition to those explicitly stated herein. Forecasts of experts inevitably differ. Views attributed to third-parties are presented to demonstrate the existence of points of view, not as a basis for recommendations or as investment advice. Market and investment views of third-parties presented herein do not necessarily reflect the views of Commonfund, any manager retained by Commonfund to manage any investments for Commonfund (each, a “Manager”) or any fund managed by any Commonfund entity (each, a “Fund”). Accordingly, the views presented herein may not be relied upon as an indication of trading intent on behalf of Commonfund, any Manager or any Fund.

Statements concerning Commonfund’s views of possible future outcomes in any investment asset class or market, or of possible future economic developments, are not intended, and should not be construed, as forecasts or predictions of the future investment performance of any Fund. Such statements are also not intended as recommendations by any Commonfund entity or any Commonfund employee to the recipient of the presentation. It is Commonfund’s policy that investment recommendations to its clients must be based on the investment objectives and risk tolerances of each individual client. All market outlook and similar statements are based upon information reasonably available as of the date of this presentation (unless an earlier date is stated with regard to particular information), and reasonably believed to be accurate by Commonfund. Commonfund disclaims any responsibility to provide the recipient of this presentation with updated or corrected information or statements. Past performance is not indicative of future results. For more information please refer to Important Disclosures.

Stay connected with the Insights Blog

Popular Blog Posts


Market Commentary | Insights Blog

Chart of the Month | U.S. Budget Deficit Hits Record Highs

In his first 100 days as President of the United States, Joe Biden has introduced three domestic funding proposals, totaling close to $6.0 Trillion, reflecting a desire to enhance the role of the...
Perspectives | Insights Blog

The Case for Using the Higher Education Price Index® (HEPI) to Define Inflation for Colleges

When calculating return targets for an endowment portfolio, a conventional piece of the equation is often the Consumer Price Index (CPI). CPI plus 5% is the common short-hand formula for institutions...
Market Commentary | Insights Blog

Chart of the Month | The Surprising Relationship Between Money Supply and Inflation

The potential for rising inflation is becoming a top concern for many investors and consumers. Many believe that inflation is already here as evidenced by price increases in commodities, homes,...

Disclaimer

Certain information contained herein has been obtained from or is based on third-party sources and, although believed to be reliable, has not been independently verified. Such information is as of the date indicated, if indicated, may not be complete, is subject to change and has not necessarily been updated. No representation or warranty, express or implied, is or will be given by The Common Fund for Nonprofit Organizations, any of its affiliates or any of its or their affiliates, trustees, directors, officers, employees or advisers (collectively referred to herein as “Commonfund”) or any other person as to the accuracy or completeness of the information in any third-party materials. Accordingly, Commonfund shall not be liable for any direct, indirect or consequential loss or damage suffered by any person as a result of relying on any statement in, or omission from, such third-party materials, and any such liability is expressly disclaimed.

All rights to the trademarks, copyrights, logos and other intellectual property listed herein belong to their respective owners and the use of such logos hereof does not imply an affiliation with, or endorsement by, the owners of such trademarks, copyrights, logos and other intellectual property.

To the extent views presented forecast market activity, they may be based on many factors in addition to those explicitly stated herein. Forecasts of experts inevitably differ. Views attributed to third-parties are presented to demonstrate the existence of points of view, not as a basis for recommendations or as investment advice. Market and investment views of third-parties presented herein do not necessarily reflect the views of Commonfund, any manager retained by Commonfund to manage any investments for Commonfund (each, a “Manager”) or any fund managed by any Commonfund entity (each, a “Fund”). Accordingly, the views presented herein may not be relied upon as an indication of trading intent on behalf of Commonfund, any Manager or any Fund.

Statements concerning Commonfund’s views of possible future outcomes in any investment asset class or market, or of possible future economic developments, are not intended, and should not be construed, as forecasts or predictions of the future investment performance of any Fund. Such statements are also not intended as recommendations by any Commonfund entity or any Commonfund employee to the recipient of the presentation. It is Commonfund’s policy that investment recommendations to its clients must be based on the investment objectives and risk tolerances of each individual client. All market outlook and similar statements are based upon information reasonably available as of the date of this presentation (unless an earlier date is stated with regard to particular information), and reasonably believed to be accurate by Commonfund. Commonfund disclaims any responsibility to provide the recipient of this presentation with updated or corrected information or statements. Past performance is not indicative of future results. For more information please refer to Important Disclosures.