In March, capital markets entered their tenth year of post-crisis recovery. For diversified portfolios, these have been some of the most profitable times, characterized by strong returns, positive correlations between equities and bonds and robust illiquidity premiums from private programs. At 1.6 percent over the last nine years, the average year-over-year headline inflation has been much lower than the average since 1992 of 2.3 percent and 6.3 percent from 1971 to 1991. However, inflationary expectations have been rising recently on the back of synchronized global growth, increasing labor tightness, stimulative fiscal and monetary policies and concerns about potential trade wars. For investors, protecting portfolios against inflation, which tends to rise in the later stages of economic cycles, becomes an important focus.
To better understand the inflation hedging characteristics of different asset classes, we compared the historical returns and characteristics of commodities, Treasury Inflation Protected Securities (TIPS), and public and private natural resources during periods of unanticipated inflation, distinct stages of the economic cycle and phases of Federal Open Market Committee (FOMC) policy tightening. To proxy each of these asset classes, we use the following:
- Commodities: Goldman Sachs Commodity Index (GSCI)
- TIPS: The Bloomberg Barclays U.S. 10-year TIPS Index
- Public Natural Resources: 60/40 combination of the energy and materials components of the S&P 500 Index
- Private Natural Resources: Burgiss pooled universe of U.S. Natural Resource managers1
Assessing Inflation Sensitivity
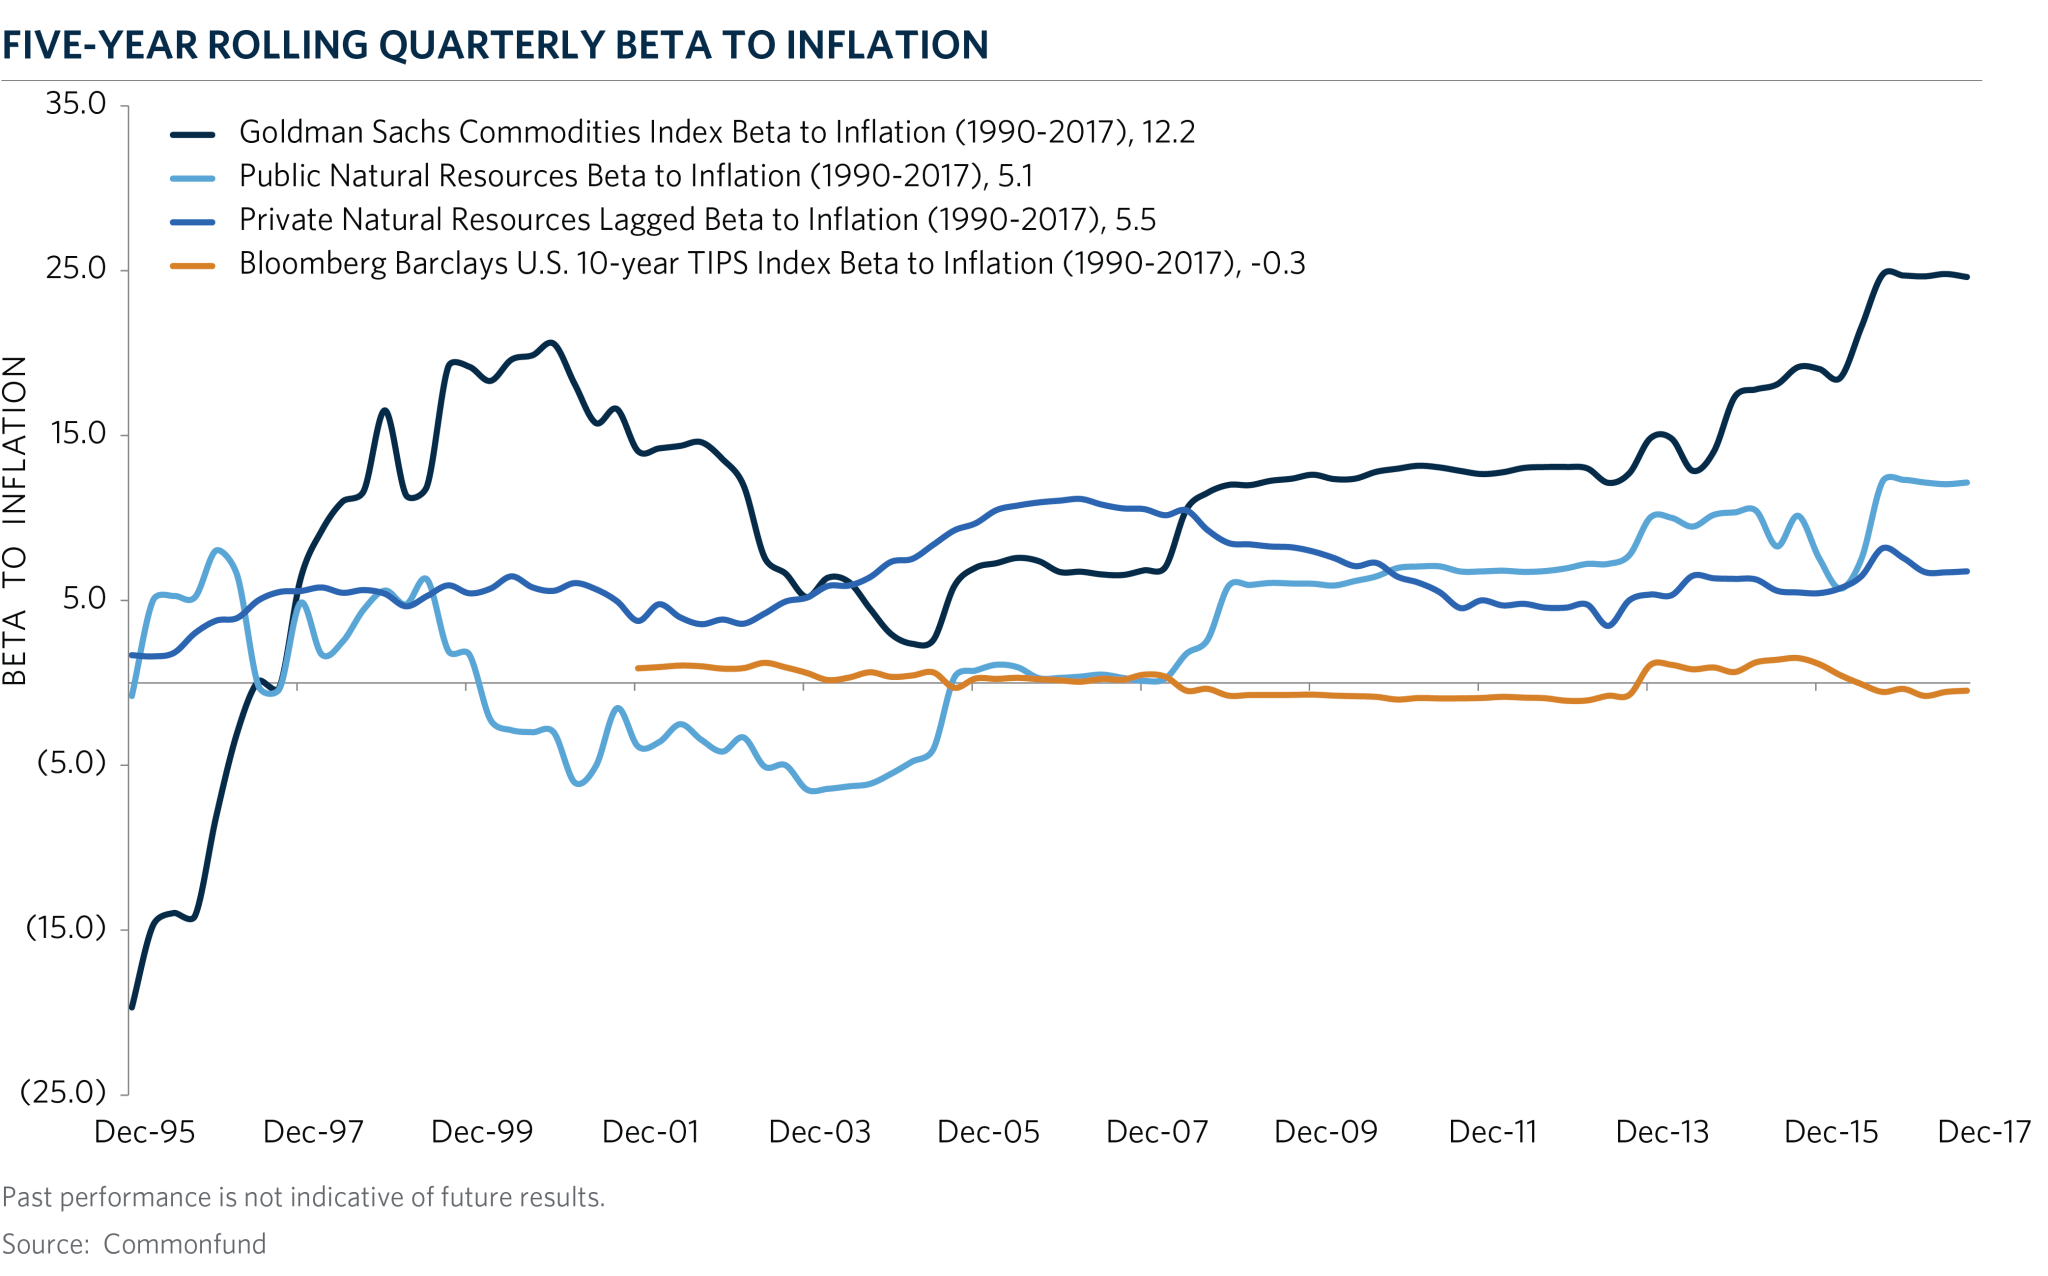
We first examine the inflation sensitivity of each asset by observing their beta to inflation over five-year rolling periods for the period of 1991 to 2017. Over this 27-year period, commodities showed the highest beta to inflation of 12.2 versus 5.1 and 5.5 for public and private natural resources. To account for the lag in valuation of private assets, we compute the cumulative response of illiquid funds over the prior four quarters. Among the individual commodity sectors, energy and industrial metals had the highest sensitivity to inflation. TIPS began trading in 1997 and since then have had negligible sensitivity to inflation of negative 0.3. While TIPS protect against inflation versus core bonds which had a negative beta of 0.7 to inflation, they generally fail to provide a significant inflation hedge in the portfolio. TIPS investors receive a fixed principal amount at maturity adjusted for realized inflation but over short periods, returns can fluctuate driven by growth and interest rate expectations. For example, from 2003 to 2013, the five-year rolling beta of TIPS to inflation weakened and eventually turned negative during the 2008-2009 crisis. As global growth slowed dramatically, so did inflation. At the same time, the Fed implemented an aggressive monetary policy which saw rates fall and TIPS returns rise.

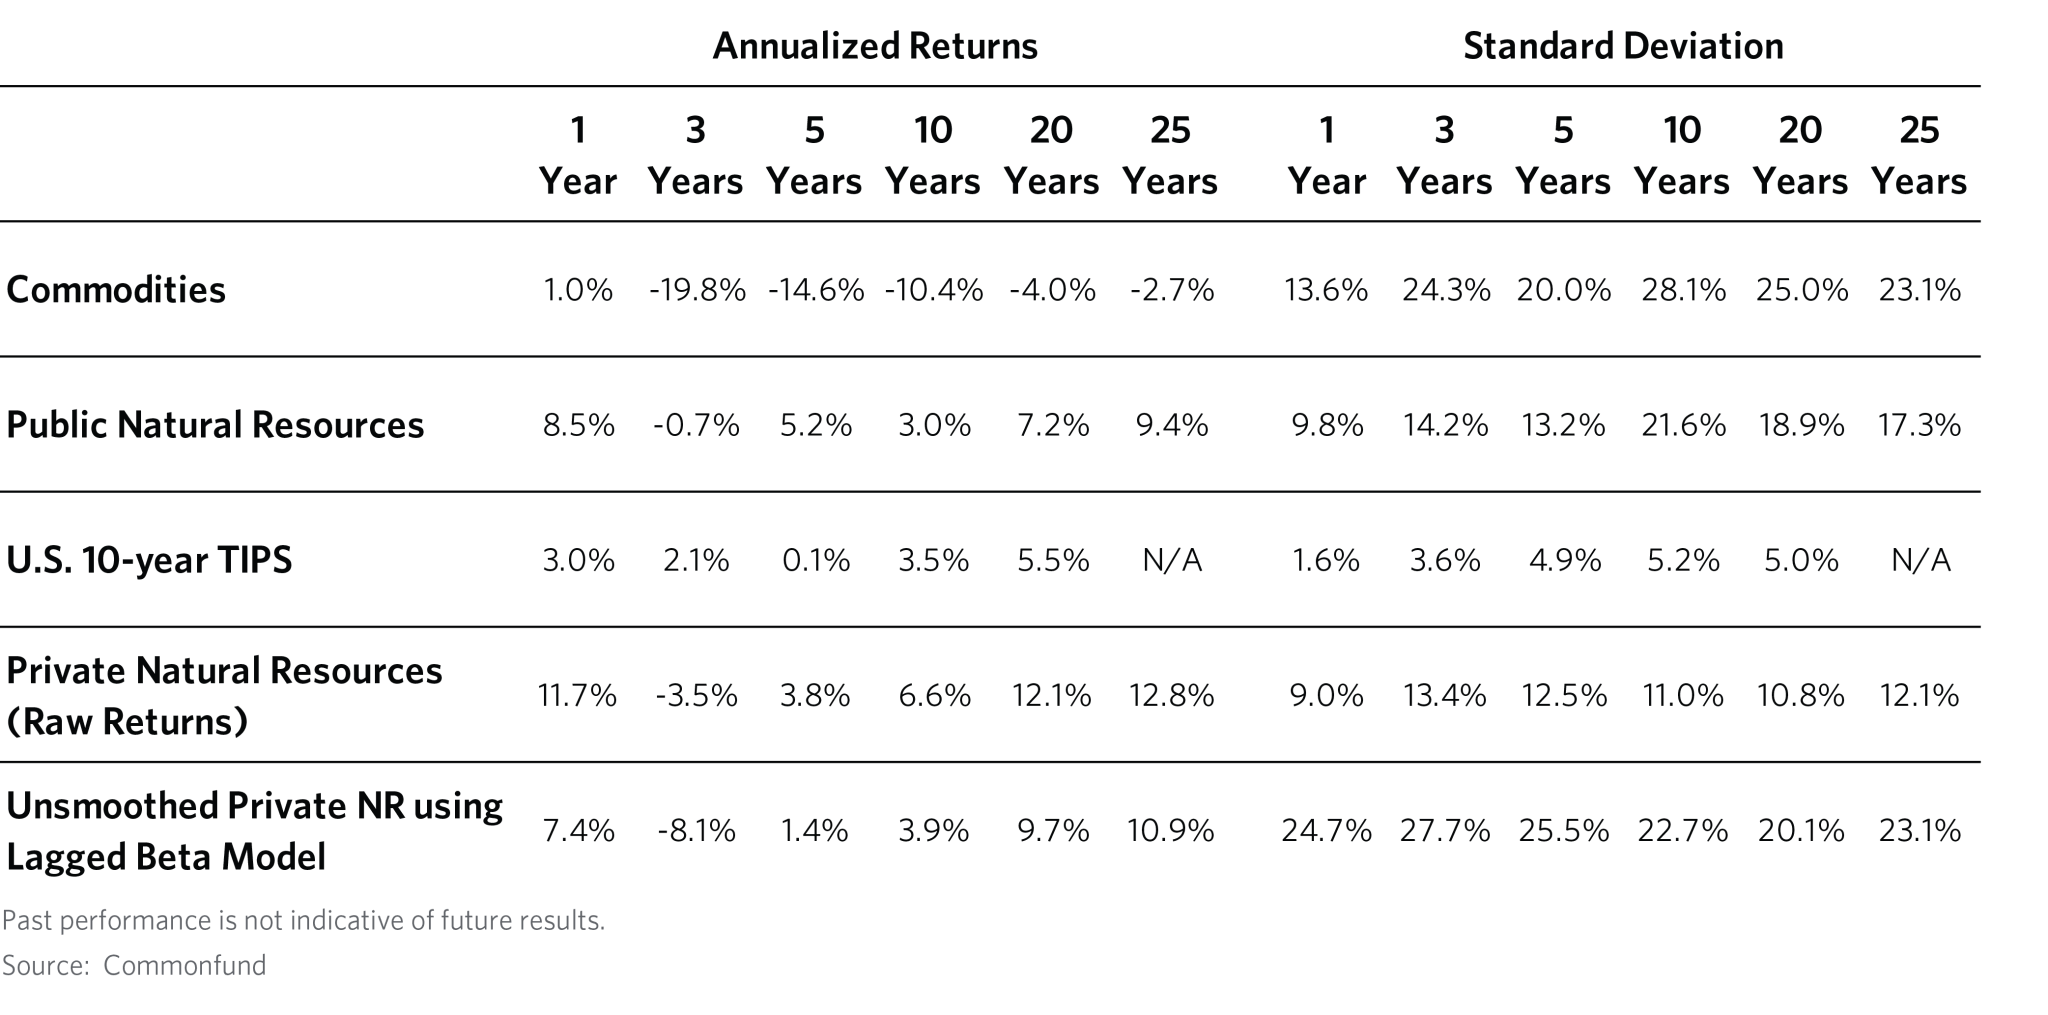
While commodities displayed the most attractive inflation hedging capabilities, they also registered the lowest returns and highest volatility for the 1990-2017 period. Over the last 20 years, commodities declined by 4 percent and exhibited annualized volatility of 25 percent. TIPS returns exhibited a stable low return/volatility profile typical of other fixed income instruments. On the other hand, private natural resources gained 12.1 percent with annual volatility of 10.8 percent, using raw smoothed returns. Private natural resources benefit from improved operational efficiencies of resource producers, appreciation of commodity prices and the illiquidity premium but managers also have discretion in marking portfolios to market and valuing investments. Due to this “stale pricing” effect, the risk characteristics of private natural resources are usually underestimated. We use a lagged beta model to unsmooth the raw data and show the true amount of systematic risk embedded in the returns.[2] For example, the long-term volatility doubled and realized returns slightly diminished when compared to the smoothed result.
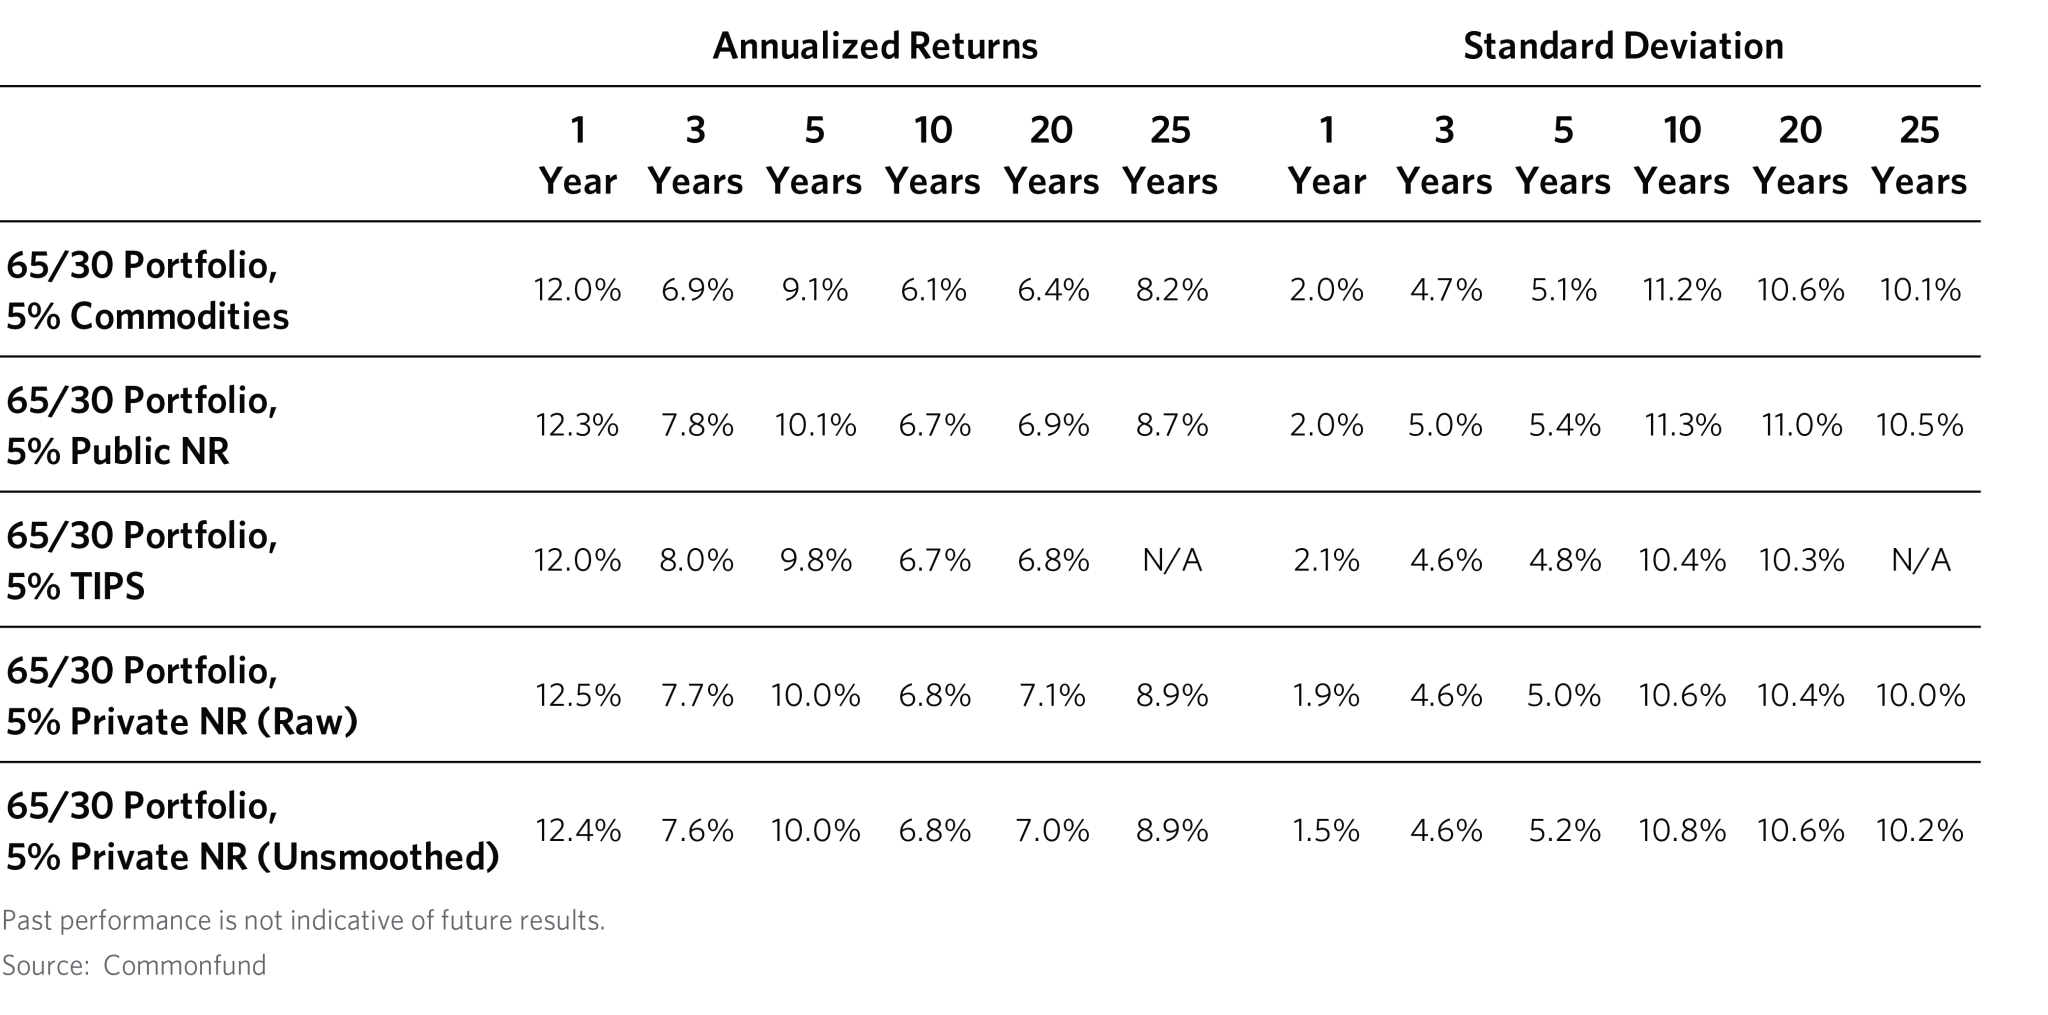
As a result, investors would have experienced better risk-adjusted returns by allocating to private natural resources as compared to commodities. For example, a 65/30 equities/bonds portfolio with a 5 percent allocation to private natural resources gained 7.1 percent on an annual basis, with lower volatility, as compared to 6.4 percent for a portfolio with a similar allocation to commodities over the last 20 years. At the same time, TIPS, while falling short on an absolute return basis have acted as effective volatility dampeners.
A Look Back at History | Impact of the Business Cycle
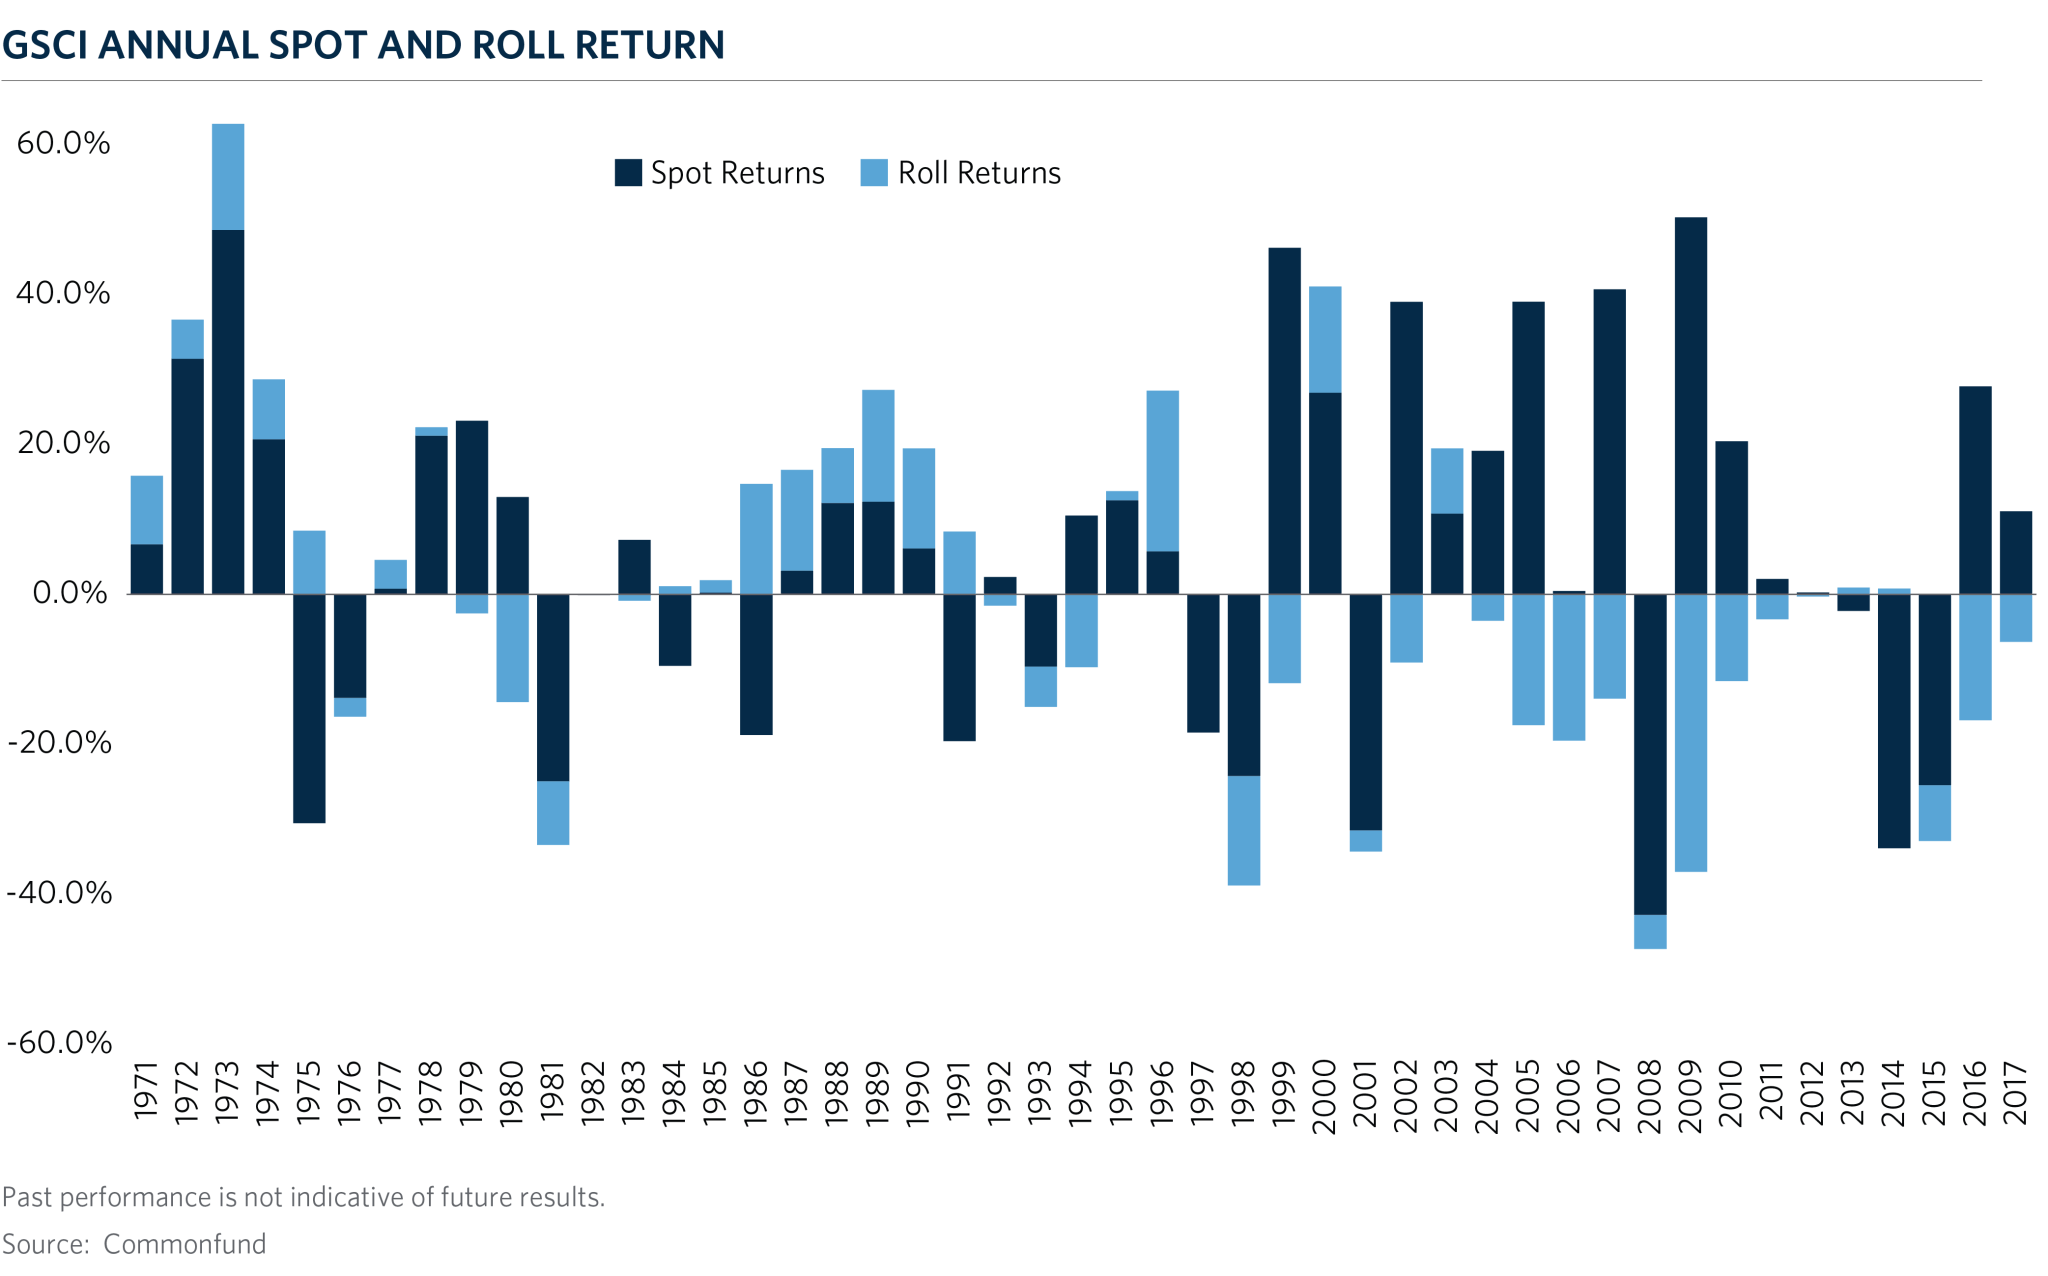
Commodity returns have been weakening over the past 47 years as world commodity markets have transitioned from the peak to the downside of the most recent “Super Cycle”. For example, the average annual return of the GSCI from 1971 to 2007 was a gain of 7.9 percent while the average return from 2008 to 2017 was a loss of 7.8 percent. Significant technological advances in production, ample commodity inventories and a slowdown in Chinese demand growth are largely responsible for the drop. Supply cycles also move between investment and exploitation phases which result in divergence in the two primary components of commodity returns, spot price changes and roll yield. Spot returns are larger during the investment phase as producers commit resources to increase production but are offset by negative roll yields[3] as inventories and storage costs grow. From 2008 to 2017, the average annual spot return was 0.8 percent while the roll return was a negative 8.5 percent. During the exploitation phase, producers cut output and capital spending while inventories dwindle as demand increases. For example, the average annual spot return from 1985 to 2000 was 3.0 percent while the roll yield return was a positive 4.2 percent. Investors also profit from the yield on securities or cash used as collateral for commodity futures. While significant prior to the FOMC quantitative easing, this source of return has been negligible in the last decade.
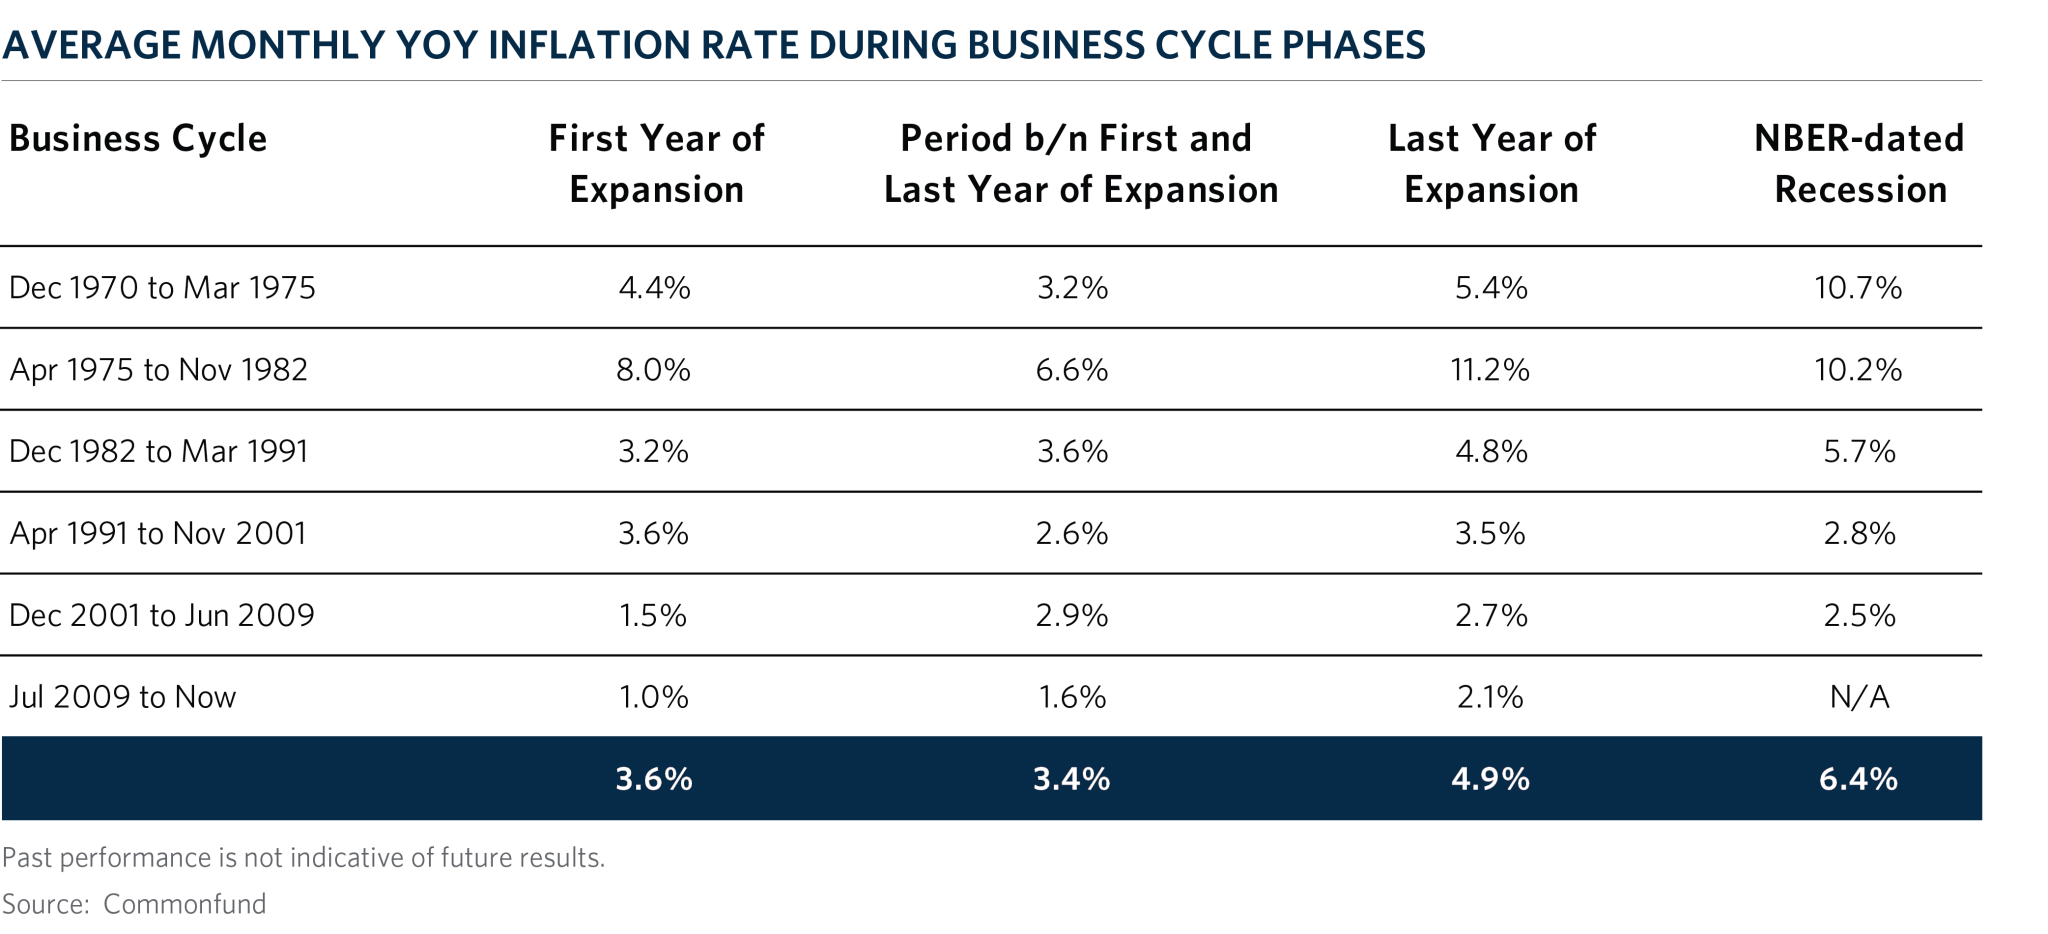
The stage of the business cycle also impacts the expected return of inflation-sensitive assets. Given the recent labor tightness, strong corporate earnings and synchronized global growth, we believe we are in the late stage of the current business cycle. That being said, since 1970, the average inflation, as measured by CPI, was 4.9 percent in the last year of an expansion versus 3.4 percent in the middle of the cycle while today inflation is only 2.3 percent – although this is coming from the significantly low levels of the Global Financial Crisis. Historically, the average inflation rate was highest during recessions, skewed by energy crises and excessive money supply in the 1970s.
During the middle of the economic cycle, public and private natural resources have generated similar return to the broad equity market of about 4 percent, while commodities underperformed by gaining 0.4 percent on average. On the other hand, during the last year of the expansion, commodities, public and private natural resources returned 3.4, 3.1 and 3.9 percent, respectively, while broad equities typically were flat. TIPS have also performed well; however, the majority of the return has mostly been driven by a generally low and declining interest rate environment since 1980.


Inflation Spikes
Our research shows that natural resources and commodities have provided important protection during periods of unanticipated inflation, defined as periods when realized inflation was higher than the rate embedded in the T-bill yield of the prior quarter. During unanticipated inflation periods from 1971 to 1990, commodities generated higher average returns than equities and bonds but underperformed when inflation was expected. High inflation periods since 1990 saw commodities gain 1.5 percent on average per quarter while public and private natural resources delivered 3.4 and 3.6 percent, respectively, beating broader equities and bonds. On the other hand, commodities declined on average during normal inflation periods since 1990, while public and private natural resources roughly matched the general equity and bond markets. It is notable that TIPS registered lower average returns during periods of unanticipated inflation compared to benign periods, as investors likely turned cautious about tighter monetary policy as a result of elevated inflation risks.


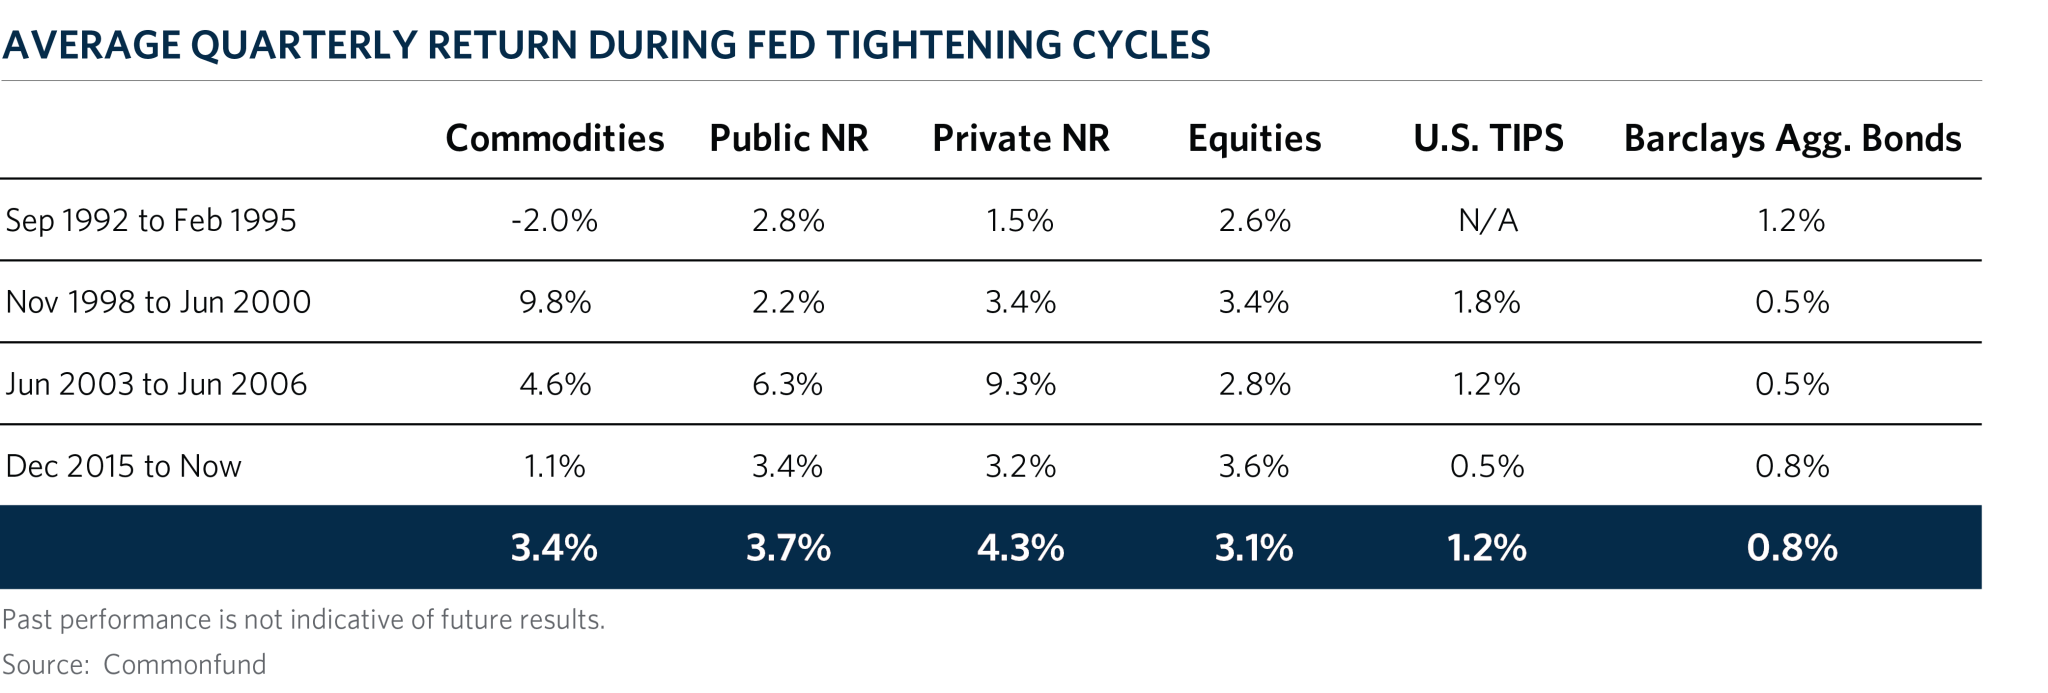
Investors are also concerned about market performance during periods of rising interest rates, as the Fed attempts to combat rising inflation. During the last four Fed tightening cycles, natural resources and commodities outperformed broad equities and bonds with private natural resources delivering the best performance.

Conclusion
Inflation sensitive assets offer important diversification to traditional stock/bond portfolios while improving the probability of achieving intergenerational equity through better risk-adjusted returns. Historically, TIPS, commodities, public and private natural resources have each offered some degree of defense against inflation. Private natural resources is our preferred choice, as it benefits from direct exposure to the price of extracted materials, managerial experience, technology and the illiquidity premium while avoiding the negative roll yield and volatility of commodities. Investors should be cautious when considering TIPS as they could fail to be a good inflation hedge in the short term. In the long term, TIPS match inflation if held to maturity but they are subject to interest rate risk which could erase the gains from inflation increases. Allocating to public natural resource equities can improve a portfolio’s ability to defend against inflation but also increases equity market risk. Thus, public natural resource equities are less efficient as an inflation hedge than private natural resources but could act as a good substitute for investors with higher illiquidity constraints. Lastly, it is important to note that capturing the attractive risk and return characteristics of private natural resources requires identifying managers that can produce excess returns and capture the illiquidity premium – this is not an asset class that can be accessed passively through an index – investors should be confident they can do so before adding an allocation to their portfolio.
- The Burgiss pooled universe of U.S. Natural Resource managers includes U.S. focused private Natural Resource managers in all vintage years. Data used includes the period from Q1:1990 when there were 5 managers with a capitalization of $185 million to Q3:2017 when there were 214 managers with a capitalization of $136.86 billion. Pooled results are calculated based on the composite transaction (cash flow and valuation) activity of underlying funds. The underlying dataset, known as the Burgiss Manager Universe, is sourced exclusively from limited partners and includes the complete transactional history for thousands of funds.
- Anson, Mark. 2016. Asset Allocation with Private Equity. The Journal of Investment Consulting 17, no. 1: 31-36
- The roll yield is the yield that a futures investor captures as their long position in a futures contract converges to the spot price; in a backwardated futures market the price rolls up to the spot price, so the roll yield is positive, whereas when the market is in contango the price rolls down to the spot price, so the roll yield is negative. The spot price can stay constant, but the investor will still earn returns from buying discounted futures contracts, which continuously roll up to the constant spot price.


