How have cultural, religious and social service institutions’ investment portfolios changed in response to the financial and market environment that has prevailed over the last several years?
While operating charities entered the financial crisis with asset allocations that reflected their priorities and preferences at the time — and that were, in many respects, remarkably similar across the three categories of institution — the ensuing seven-year period has seen continual evolution and differentiation, with the result that these organizations, while they have moved in the same general direction of increased diversification, have done so in ways that reflect their own institutional preferences and priorities.
Let’s look at the evolution of operating charities’ asset allocation over the last seven years, including the 2007–08 economic crisis and its aftermath.
In FY2006, the three types of operating charity had portfolios that, taken as a whole, had two-thirds of their assets in liquid domestic stocks and bonds (please refer to Figure 3.1 on page 11). Overall allocations to domestic equities were 40 percent and fixed income allocations were 26 percent, for a total of 66 percent allocated to these two asset classes.
Within these two major categories, allocations to domestic equities were remarkably uniform across the board, with a difference of only six percentage points from a high of 43 percent for cultural institutions to a low of 37 percent for social service organizations. Fixed income allocations, however, varied widely, with religious organizations reporting allocations of 31 percent to bonds while cultural organizations had roughly half as much, at 16 percent.
International equity allocations were essentially uniform across the three types of organization, at 18 to 19 percent.
Alternative strategy allocations in FY2006 reflected institutional approaches to these investment strategies that, in some ways, have continued to persist.
Cultural and social service organizations reported allocations to alternative strategies of 19 percent and 17 percent, respectively, while religious organizations reported allocations of only 8 percent. This lower number may have been due, at least in part, to many religious organizations’ adherence —which we have noted over the years in these Reports — to socially responsible investment (SRI) and environmental, social and governance (ESG) screens which can be challenging to impose for many alternative investment managers.
Cash allocations in FY2006 were quite low, ranging from 4 percent for cultural and social service organizations to 2 percent for religious organizations. This level of cash allocation was common among nonprofits at the time, and reflected the unspoken assumption — which would shortly be refuted in the market collapse — that liquidity was essentially free, and that appropriations for mission spending could be taken without significant disruption to the portfolio.
If, with these baselines as a starting point, we track the broad evolution of asset allocation patterns over the last seven years, several clear trends are evident. The most noticeable is that operating charities’ investment portfolios have moved steadily away from their previous domestic, highly liquid allocations and toward a higher degree of diversification.
They have done so, however, in different ways, consistent with their own institutional missions and policy preferences.
Cultural organizations
Cultural organizations have decreased their exposure to U.S. stocks and bonds and increased their allocations to international equities and alternatives. In this sense, they appear to be following — albeit at a distance — the path forged by educational endowments and foundations over the last several decades away from traditional liquid investment portfolios and toward the “endowment model” of investing characterized by a high degree of diversification and a higher tolerance for illiquidity.
The domestic equity allocations of cultural organizations have decreased or remained the same each year, dropping from a high of 43 percent in FY2006 to a low of 21 percent in FY2012. Fixed income allocations have seesawed within a six-point range over this period, from a low of 12 percent in FY2010 to a high of 18 percent in FY2008, but for the last two years they have been at 17 percent — essentially unchanged from the 16 percent allocation at the beginning of the period.
International equity allocations, in contrast, have shown an increasing trend, rising from 18 percent in FY2006 to 23 percent in FY2012, albeit with some volatility in the intervening years.
Cultural Institutions’ Asset Allocations for Fiscal Years 2006–2012
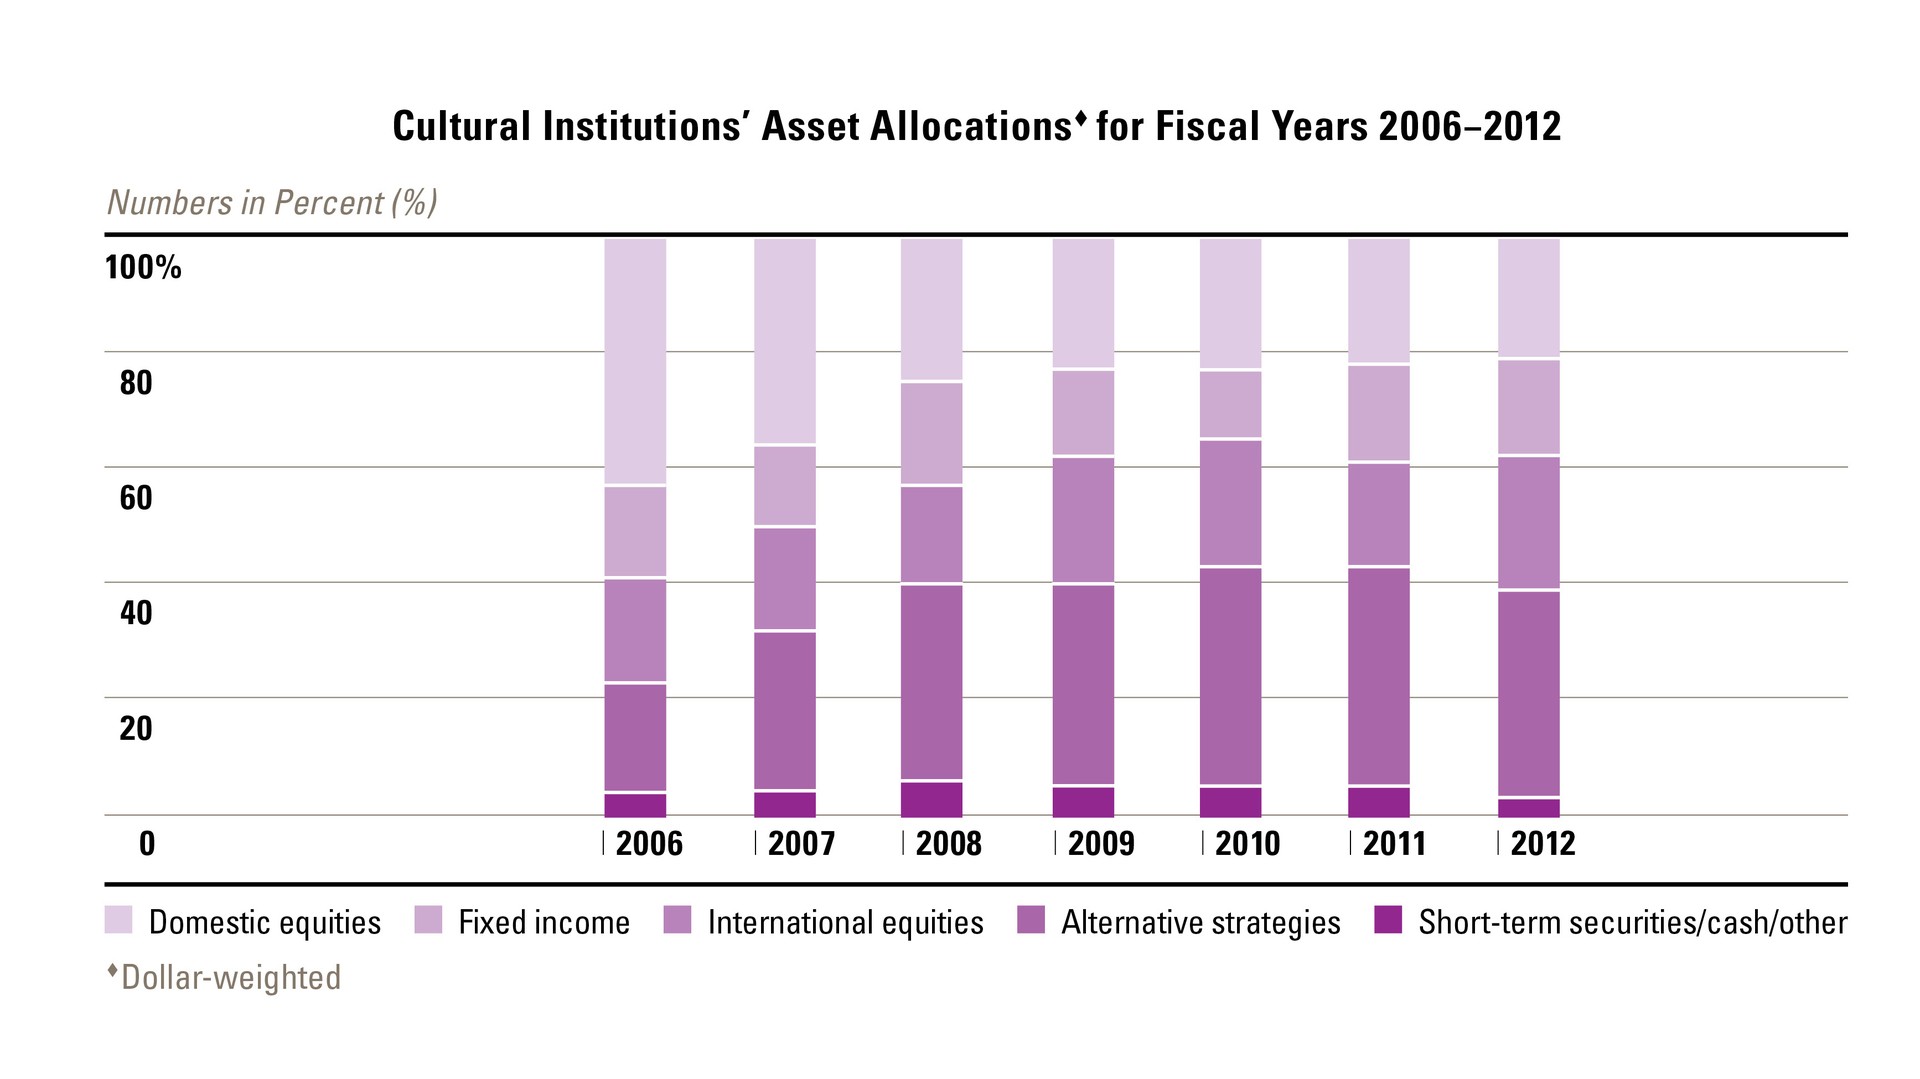
Allocations to alternative strategies have shown the clearest upward trend, doubling from 19 percent in FY2006 to 38 percent in FY2011 before decreasing slightly to 36 percent in FY2012.
While still lower than the 42 percent FY2012 alternatives allocations of independent/private foundations and the 54 percent FY2012 allocations of colleges and universities , the trend is still apparent.
Cash and other short-term investments, which increased somewhat in the aftermath of the crisis as cultural institutions deemed it prudent to be more liquid, have actually declined slightly over the full seven-year period from 4 percent to 3 percent.
Religious organizations
Religious organizations have exhibited a pattern similar to that set by cultural organizations but in a more muted fashion, reflecting their own investment policy priorities and liquidity imperatives.
Like cultural organizations, they cut their domestic equity and fixed income allocations — but not as drastically.
Domestic equity allocations declined from 41 percent in FY2006 to 30 percent in FY2012, while fixed income allocations fell from a prudential high of 41 percent in FY2008 to a low of 21 percent in FY2011 before rising slightly to 24 percent in FY2012. International equity allocations rose, coincidentally exhibiting the same beginning and ending percentages as those of cultural organizations —18 percent in FY2006 and 23 percent in FY2012 — but with a different pattern of year-to-year change in between.
Religious Institutions’ Asset Allocations for Fiscal Years 2006–2012
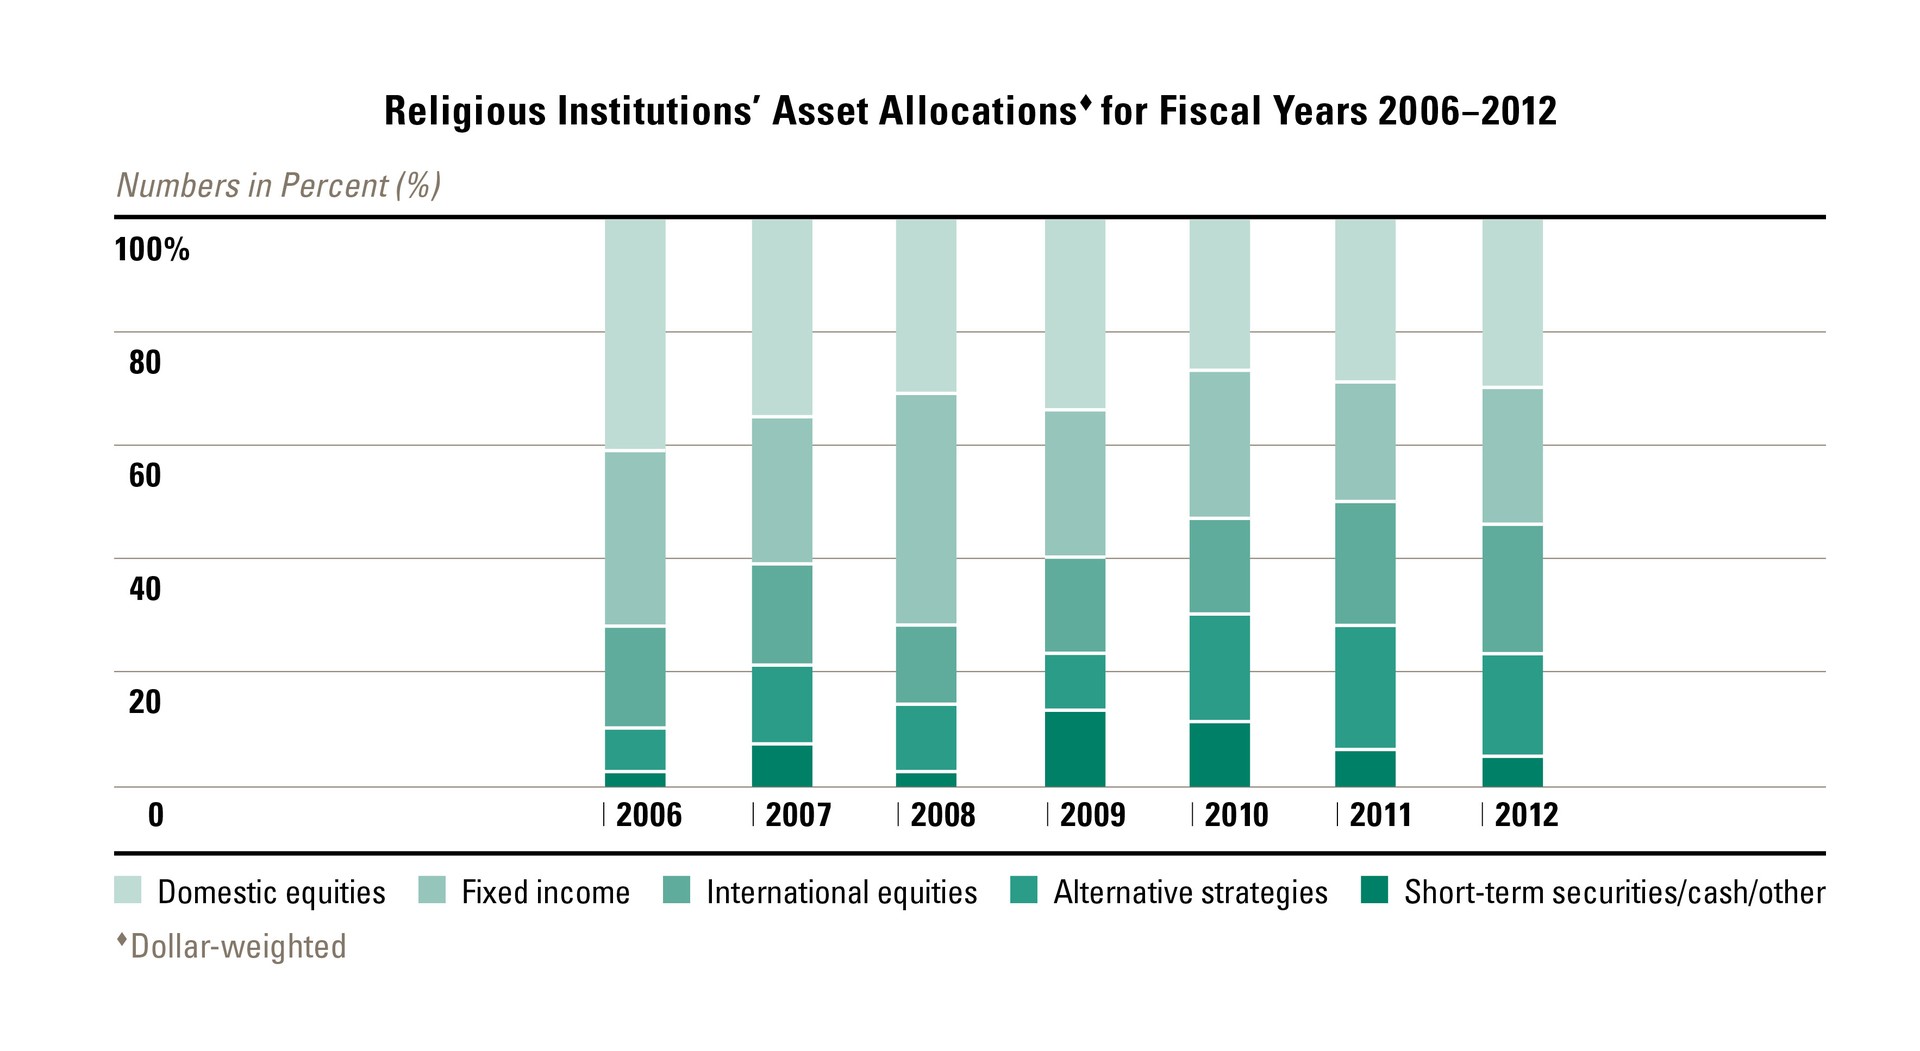
Like cultural organizations, religious organizations also increased their allocations to alternative strategies substantially — in relative terms, considering the low original base — from 8 percent in FY2006 to 22 percent in FY2011, before reducing the allocation somewhat to 18 percent in FY2012. And cash allocations, which surged from 2 percent in FY2006 to highs of 13 percent in FY2009 and 11 percent in FY2010, were reported at 5 percent in FY2012.
Religious organizations thus sought the same goals of diversification and increased return as cultural organizations but continued to exhibit a higher preference for liquidity.
Social service organizations
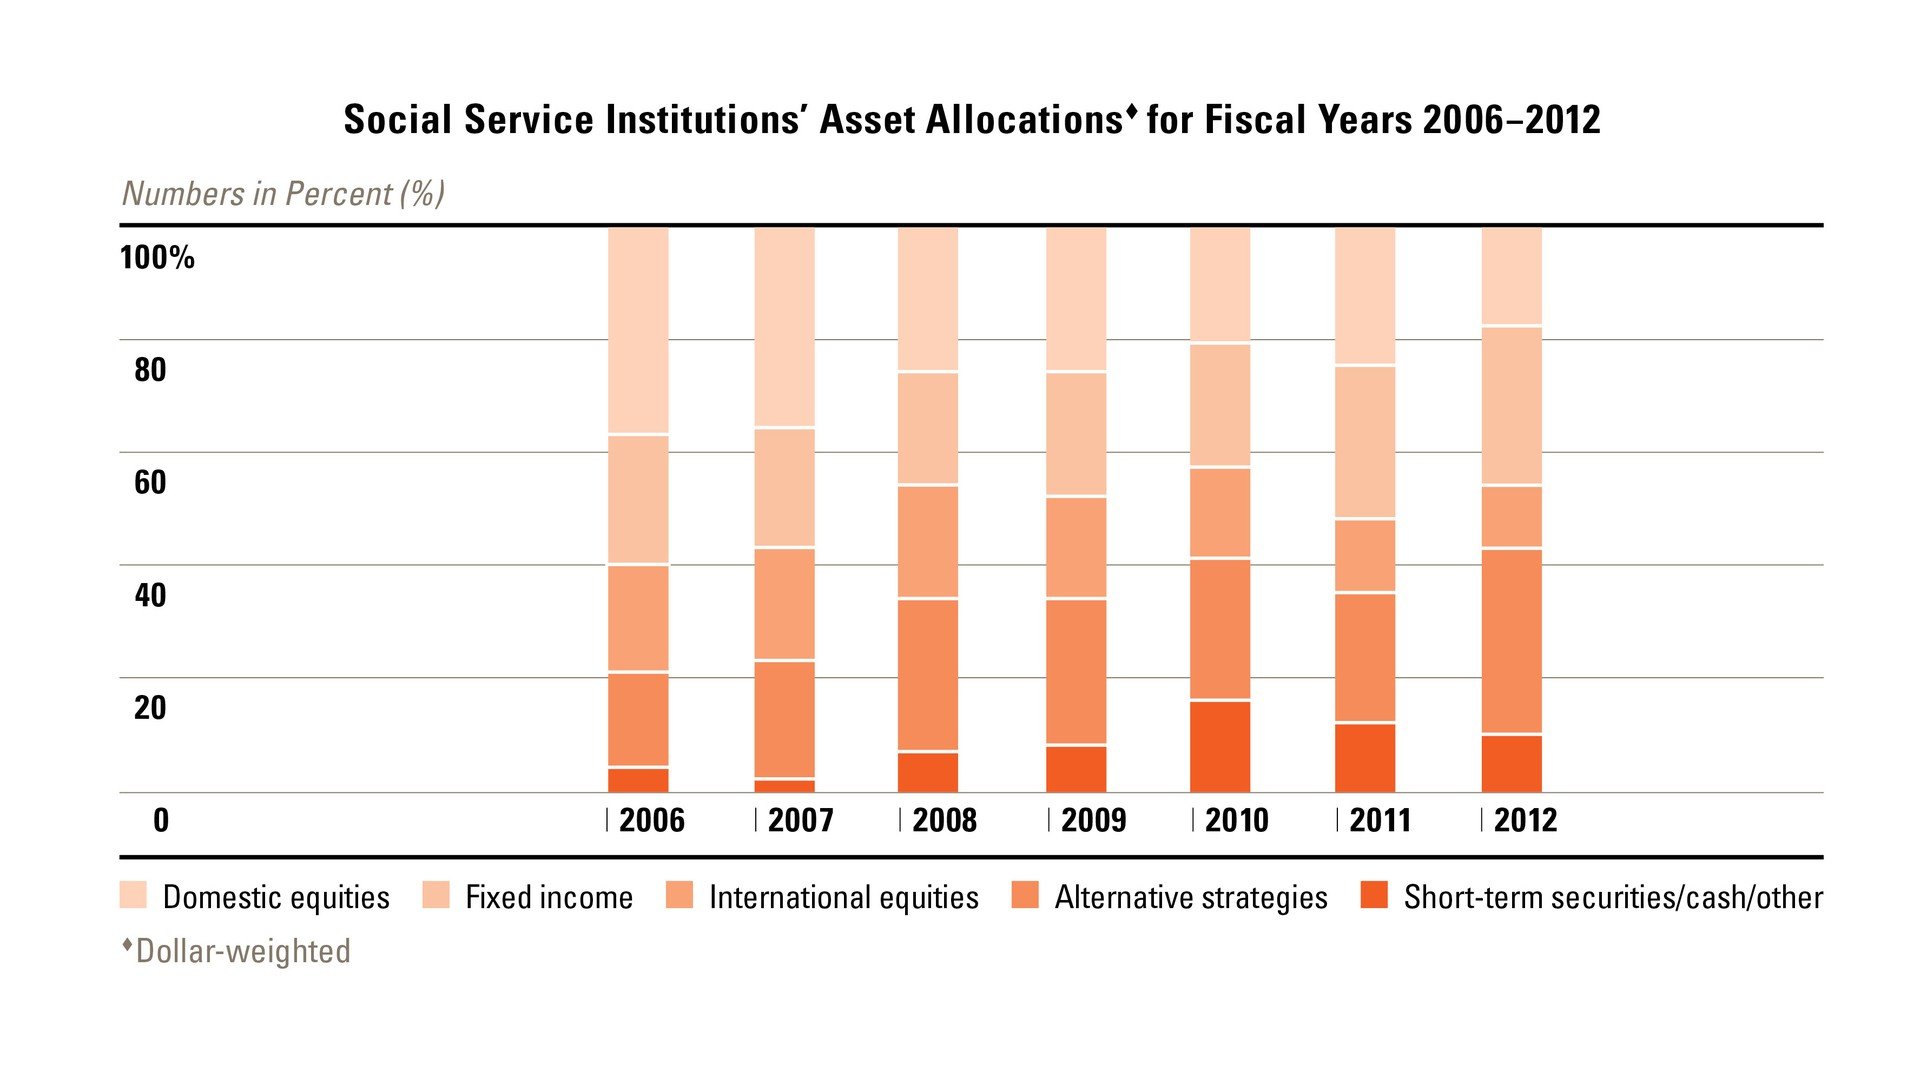
Like cultural and religious institutions, social service organizations decreased their domestic equity allocations substantially from FY2006, when they held 37 percent of their portfolios in U.S. stocks, to 18 percent in FY2012 — a cut of more than 50 percent. Unlike those institutions, however, they did not increase their investments in international equities but, in fact, cut them as well, from a high of 20 percent in FY2008 to FY2012’s low of 11 percent.
The asset classes that gained from these cuts were a counterintuitive mix, indicating the challenges facing social service organizations, which sought both increased return through diversification and a measure of principal protection and liquidity. Alternative strategy allocations nearly doubled over the period, rising from 17 percent in FY2006 to 33 percent in FY2012, albeit with some volatility along the way.
Fixed income allocations, however, also increased after a brief decline in the FY2006–2008 period, rising steadily thereafter from 20 percent in FY2008 to 28 percent in FY2012. And cash/short term allocations, which had been at 4 percent in FY2006, surged in the aftermath of the crisis to 16 percent before subsiding to FY2012’s 10 percent figure.
Social service organizations thus seem to have been working toward a compromise between growth, diversification and capital preservation.
We can thus see that each of the three types of operating charity in our Study has pursued specific asset allocation policies in response to the economic crisis. Cultural institutions have moved a long way down the road pioneered by educational endowments and private foundations, in accepting an increased degree of illiquidity in the form of larger alternative investment allocations and smaller cash allocations.
Religious organizations have maintained a more traditional and liquid allocation pattern while modestly increasing their alternative strategies allocation and putting excess cash to work in international equities. And social service organizations have sought a middle way, decreasing domestic equity exposure and reorienting the portfolio toward fixed income, alternative investments and cash.
In the troubled market environment of the last several years, no single strategy has proved immune to shocks from the markets or the global economy. The choices that these organizations have made reflect assumptions about future markets but also preferences with respect to liquidity and expenditure for mission. We will continue to follow this evolution as the global economy continues to heal and these organizations pursue their institutional goals.
Social Service Institutions’ Asset Allocations for Fiscal Years 2006–2012
This viewpoint appeared in the 2013 Commonfund Benchmarks Study of Operating Charities published July 2013. To request a copy of the most recent report fill in the details below.
