Viewpoint: The Short and Long of It

March 15, 2022 |
4 minute read
|

There’s a lot to consider in each annual Commonfund Benchmarks Study® of Independent Schools, e.g., asset allocation, spending, gifts and donations, responsible investing and more. This year is no exception, but one figure dominates all others: It’s that 25.8 percent return for fiscal year 2021—the highest in the Study’s 17-year history.

The all too familiar disclaimer in the investment industry is some variation on the statement that past results do not guarantee future performance. We would invoke that here: there is no predictive power in FY2021’s outsized gain. At this writing, the first half of FY2022 has generated good returns. But lest one forgets how quickly reversals can occur, we need only go back to FY2020. The first half ended with a 10.9 percent gain for the S&P 500 Index and 6.8 percent for the MSCI ex-U.S. Index. Both were negative in the second half and by the end of the fiscal year the domestic index was ahead 7.4 percent and the international index was down 5.4 percent—and was not alone in negative territory as a number of additional benchmarks joined it.

The Short Story

More to the point of the markets’ vagaries (albeit a case of going from poor returns to good), the two consecutive years with the lowest returns in the history of this Study were FY2008 when the return was -3.0 percent and FY2009 when the return was -18.0 percent. These two years were immediately followed by the best two consecutive years: FY2010 and its 11.4 percent gain and FY2011 when the return was 17.9 percent. Those two years touched off the best five-year period in the Study’s history. The average annual gain from FY2010 through FY2014 was just over 11.0 percent—in spite of a zero return (0.0 percent) in FY2012. The second-best five-year period was the one that ended this fiscal year, when returns averaged 10.7 percent (FY2017 – FY2021).

The five-year period with the lowest return was the one beginning with negative returns for FY2008 and FY2009. Although 2010 and 2011 produced double-digit returns, FY2012 was zero. For that five-year period the average return was 1.7 percent. The five-year period with the second-lowest return was that of FY2016 through FY2020 when the average return was 5.4 percent.

As an aside, outside of fiscal years 2008 and 2009, the only other negative return was -0.8 percent for FY2016. And aside from FY2021’s 25.8 percent, the best one-year return was the previously mentioned 17.9 percent for FY2011.

The Longer Perspective

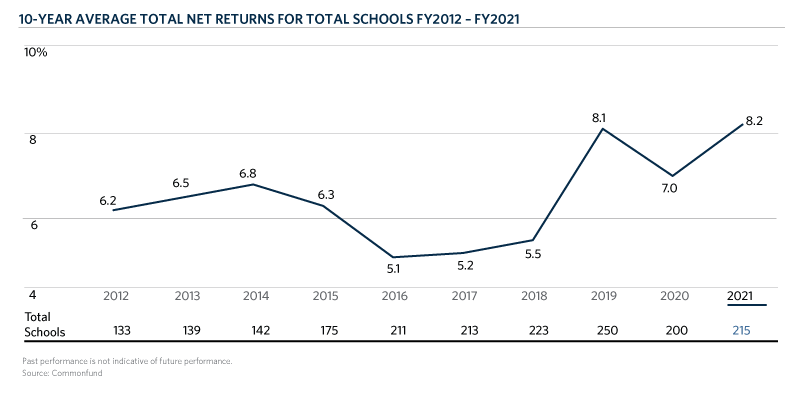
Every annual return ultimately feeds into a larger picture. This Study reports on three- and five-year returns, as do many if not most financial reports. But the one that counts the most for institutions with a long-term—even perpetual—investment horizon is the 10-year return. The graph shown here charts 10-year returns as reported in this Study since FY2012.

The trend line depicts what everyone wants to see: an upward slope. In fact, the most recent fiscal years of 2019, 2020 and 2021 show the best 10-year average annual gains of the 10 years shown. But one cannot ignore the obvious dips, for example, fiscal years 2016 to 2018 when 10-year returns averaged 5.1 percent, 5.2 percent and 5.5 percent, respectively. Had the trend continued it would have spelled real trouble, as those rates of return are well short of what is needed to cover spending, inflation and investment management costs.

The steadiest period was the five fiscal years 2011 – 2015, when sequential 10-year trailing returns were 5.4 percent, 6.2 percent, 6.5 percent, 6.8 percent and 6.3 percent. The average 10-year return for the period was 6.2 percent. The spread from the lowest to the highest average 10-year return for the period was just 140 basis points. So, yes, returns were steady but hardly robust and may have been enough to cover spending because inflation was very low and Study participants’ reported effective annual spending rates were lowered throughout the period, declining from 4.2 percent in FY2011 to 3.6 percent in FY2015.

Although the three most recent years are the best for 10-year returns, the good news is not completely unalloyed: the main reason for the 8.1 percent 10-year return in FY2019 is that FY2009’s -18.0 percent return dropped off the 10-year calculation. At the same time, it must be said that this fiscal year’s 10-year return would have been even greater than 8.2 percent had FY2011’s 17.9 percent advance not dropped out of the calculation. (The trailing 11-year return, when FY2011 is included, would have been 10.7 percent.)

CHT-VPT-1Conclusion

The many macro factors that impact portfolio returns are beyond the control of investment committees, leading to the sage advice about seeking to control only those things over which one is able to exercise control. This leads to the studies that have consistently shown that asset allocation explains more than 90 percent of the variability in portfolio returns, with only 10 percent of the variability explained by security selection or market timing. This makes determining the allocation appropriate for a particular school a decision of overriding importance. This underscores the primacy of the endowment model, whose central tenets are diversification with an equity bias, a long-term perspective and being rewarded for accepting illiquidity (the illiquidity premium).

Over the years, schools participating in this Study have maintained diversified portfolios that reflect a clear equity bias. In the Study for FY2009, equities accounted for 75 percent of participants’ asset allocations; in the current Study that figure had risen to 84 percent (this is directional as, obviously, there are year-to-year fluctuations). The greatest difference among schools is in allocations to fixed income and alternative strategies. This year, schools with assets over $50 million allocated 10 percent of their endowments to fixed income and 35 percent to less liquid alternative strategies. Schools with assets under $10 million allocated 30 percent to fixed income and 4 percent to alternative strategies. The one-year return difference was more than 800 basis points in favor of schools with assets over $50 million. Last fiscal year, one that generated only low single-digit returns, schools with assets under $10 million delivered the higher return by 60 basis points. And this year’s data show that schools in these two size categories are not very far apart on the return of much greater significance: the 10 year. The equity bias is playing out in schools’ favor.

As to the low illiquid allocation among schools with assets between $10 and $50 million and, especially, those with assets under $10 million, we recognize that they may lack the staff and resources to build out an alternatives program. (As well, the data show actual allocation; it may be that some of these schools have a larger policy allocation but are in the early stages of implementing it.) Some of these same schools often have sophisticated investment committee members who are comfortable with commitments to illiquid investments. As long as they meet accredited investors status, schools with assets between $10 and $50 million and under $10 million may want to consider moderate increases in their alternatives allocation—and round out that third leg of the investment model.

CSIS Benchmark Study Request

Commonfund Institute

Author

Commonfund Institute

Disclaimer

Certain information contained herein has been obtained from or is based on third-party sources and, although believed to be reliable, has not been independently verified. Such information is as of the date indicated, if indicated, may not be complete, is subject to change and has not necessarily been updated. No representation or warranty, express or implied, is or will be given by The Common Fund for Nonprofit Organizations, any of its affiliates or any of its or their affiliates, trustees, directors, officers, employees or advisers (collectively referred to herein as “Commonfund”) or any other person as to the accuracy or completeness of the information in any third-party materials. Accordingly, Commonfund shall not be liable for any direct, indirect or consequential loss or damage suffered by any person as a result of relying on any statement in, or omission from, such third-party materials, and any such liability is expressly disclaimed.

All rights to the trademarks, copyrights, logos and other intellectual property listed herein belong to their respective owners and the use of such logos hereof does not imply an affiliation with, or endorsement by, the owners of such trademarks, copyrights, logos and other intellectual property.

To the extent views presented forecast market activity, they may be based on many factors in addition to those explicitly stated herein. Forecasts of experts inevitably differ. Views attributed to third-parties are presented to demonstrate the existence of points of view, not as a basis for recommendations or as investment advice. Market and investment views of third-parties presented herein do not necessarily reflect the views of Commonfund, any manager retained by Commonfund to manage any investments for Commonfund (each, a “Manager”) or any fund managed by any Commonfund entity (each, a “Fund”). Accordingly, the views presented herein may not be relied upon as an indication of trading intent on behalf of Commonfund, any Manager or any Fund.

Statements concerning Commonfund’s views of possible future outcomes in any investment asset class or market, or of possible future economic developments, are not intended, and should not be construed, as forecasts or predictions of the future investment performance of any Fund. Such statements are also not intended as recommendations by any Commonfund entity or any Commonfund employee to the recipient of the presentation. It is Commonfund’s policy that investment recommendations to its clients must be based on the investment objectives and risk tolerances of each individual client. All market outlook and similar statements are based upon information reasonably available as of the date of this presentation (unless an earlier date is stated with regard to particular information), and reasonably believed to be accurate by Commonfund. Commonfund disclaims any responsibility to provide the recipient of this presentation with updated or corrected information or statements. Past performance is not indicative of future results. For more information please refer to Important Disclosures.

Stay connected with the Insights Blog

Popular Articles


Diversity | Articles

Affirmative Action: Implications for Endowments, Foundations, and the Broader Industry

Affirmative action, a practice used since the 1960s to edge toward equity and address historical and ongoing injustice through higher education attainment, was struck down last month by the Supreme...
Investment Strategy | Articles

6 Keys to Choosing the Right Outsourced CIO

Today, few OCIOs that serve nonprofits are total institutional partners. Six questions can help you find one who takes a holistic approach. Not long ago, the definition and scope of an “Outsourced...
Investment Strategy | Articles

Challenges of Nonprofit Healthcare Organizations and Endowment Management

Facing cost pressures and a new regulatory regime, healthcare organizations — especially those in the small and mid-sized range — should consider adopting the principles of the endowment model....

Disclaimer

Certain information contained herein has been obtained from or is based on third-party sources and, although believed to be reliable, has not been independently verified. Such information is as of the date indicated, if indicated, may not be complete, is subject to change and has not necessarily been updated. No representation or warranty, express or implied, is or will be given by The Common Fund for Nonprofit Organizations, any of its affiliates or any of its or their affiliates, trustees, directors, officers, employees or advisers (collectively referred to herein as “Commonfund”) or any other person as to the accuracy or completeness of the information in any third-party materials. Accordingly, Commonfund shall not be liable for any direct, indirect or consequential loss or damage suffered by any person as a result of relying on any statement in, or omission from, such third-party materials, and any such liability is expressly disclaimed.

All rights to the trademarks, copyrights, logos and other intellectual property listed herein belong to their respective owners and the use of such logos hereof does not imply an affiliation with, or endorsement by, the owners of such trademarks, copyrights, logos and other intellectual property.

To the extent views presented forecast market activity, they may be based on many factors in addition to those explicitly stated herein. Forecasts of experts inevitably differ. Views attributed to third-parties are presented to demonstrate the existence of points of view, not as a basis for recommendations or as investment advice. Market and investment views of third-parties presented herein do not necessarily reflect the views of Commonfund, any manager retained by Commonfund to manage any investments for Commonfund (each, a “Manager”) or any fund managed by any Commonfund entity (each, a “Fund”). Accordingly, the views presented herein may not be relied upon as an indication of trading intent on behalf of Commonfund, any Manager or any Fund.

Statements concerning Commonfund’s views of possible future outcomes in any investment asset class or market, or of possible future economic developments, are not intended, and should not be construed, as forecasts or predictions of the future investment performance of any Fund. Such statements are also not intended as recommendations by any Commonfund entity or any Commonfund employee to the recipient of the presentation. It is Commonfund’s policy that investment recommendations to its clients must be based on the investment objectives and risk tolerances of each individual client. All market outlook and similar statements are based upon information reasonably available as of the date of this presentation (unless an earlier date is stated with regard to particular information), and reasonably believed to be accurate by Commonfund. Commonfund disclaims any responsibility to provide the recipient of this presentation with updated or corrected information or statements. Past performance is not indicative of future results. For more information please refer to Important Disclosures.