Beyond the Benchmark: A Decade of Endowment Spending Rate Trends

November 3, 2026 |
3 minute read
|
Beyond the Benchmark: A Decade of Endowment Spending Rate Trends
6:26

Rising inflation, falling enrollment, fundraising challenges, and changes in federal funding have left institutions seeking increasing support from their source of perpetual capital: their endowment. The latest NACUBO-Commonfund Study of Endowments (NCSE), covering fiscal year 2025, shows that higher education institutions increasingly rely on their endowments to cover costs. Digging deeper into Commonfund’s proprietary benchmarking database, which covers 10+ years of data across Commonfund’s benchmark studies of higher education, independent schools, and private and community foundations, offers further insight into how institutions are drawing from their endowments.

This Commonfund Insights blog is the first in our Beyond the Benchmark series. It examines the effective spending rate, or the actual draw on endowment market value over the course of the fiscal year. More than 650 higher education institutions report these data each year and they are aggregated in the annual NCSE study. Future editions will cover trends across other market segments and longitudinal analysis of additional topics and questions covered in the studies.

Effective Spending Rates at Higher Education Institutions Have Risen Over Time

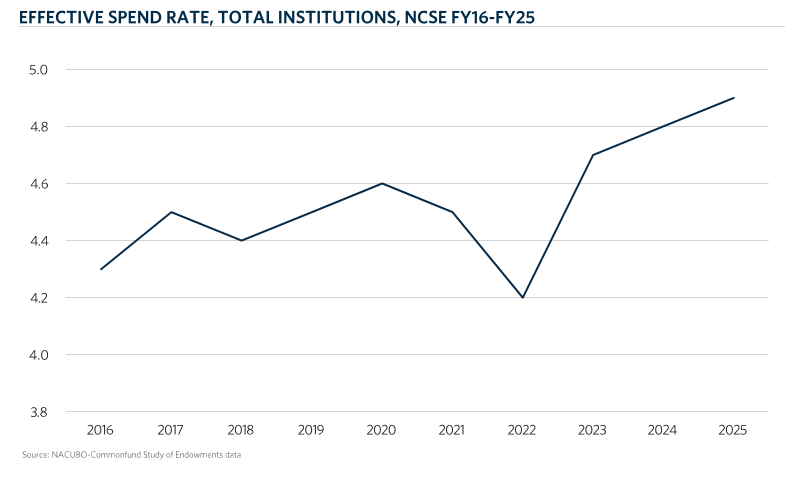
Spending policy, which sets how much an institution plans to draw from its endowment, is a critical topic for boards and investment committees and is covered extensively in the NCSE and in various Commonfund resources.1 Effective spending, by contrast, is the actual draw from the endowment over the year. The chart below shows effective spend rates for all institutions in the NCSE rising over the past decade, with the average across participants growing from 4.3 percent in FY16 to 4.9 percent in FY25 – a new all-time high.

This matters because endowment spending funds institutions’ core missions. In FY25, nearly half of spending policy distributions (47.4 percent) supported student financial aid, followed by academic programs and research (17.7 percent). To achieve intergenerational equity and continue funding these mission-critical needs over time, an investment committee typically aims to earn real returns that cover the spending rate plus the cost of managing the endowment, such as fees. The increase of more than 60 basis points in effective spending over the past decade raises that hypothetical real return target by a similar amount, and the nominal return needed is higher still once inflation – measured by CPI or the Higher Education Price Index (HEPI) – is included. This underscores the importance of tracking these data over time to assess whether current policies, practices, and investment strategies remain effective or warrant revision.
CHT-Effective-Spend-Rate-Total-Institutions

Key Insights about Data by Endowment Size and Type

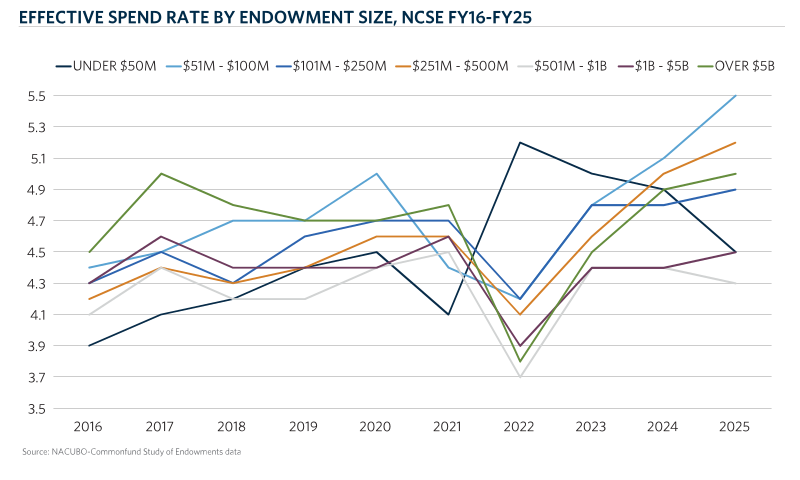
  • Despite the sharp dip in FY22, average effective spend rates have trended upward across endowment size cohorts, though to varying degrees. This mirrors the trend seen for total institutions.
  • The largest point-to-point increase in average effective spend rates from FY16 to FY25 occurred among institutions with assets between $51million and $100 million, increasing from 4.4 percent in FY16 to 5.5 percent in FY25; followed closely by those with assets between $ 251 million and $500 million, whose average rates rose from 4.2 percent to 5.0 percent during that time. Cohorts with the most consistent rates over time were those with assets between $501 million and $1 billion and between $1 billion and $5 billion (each increasing by only 20 basis points on average).
  • The relationship between endowment size and average spending rates has shifted over time. From FY16 through FY21, endowment size and effective spend rate showed a slight positive correlation, meaning the largest endowments spent at a higher rate than the smallest. That flipped in FY22 when the smallest endowments spent at the highest rate (5.2 percent) while the largest spent at one of the lowest (3.8 percent), on average. This correlation has remained slightly negative from FY23 through FY25.
CHT-Effective-Spend-Rate-Endowment-Size
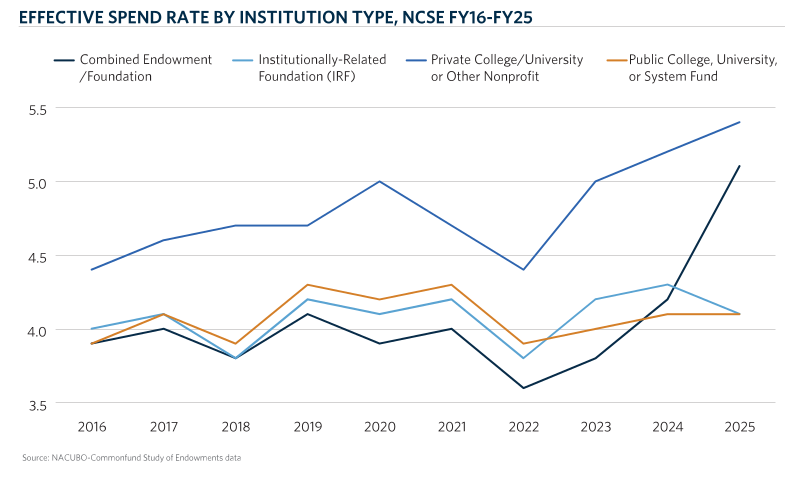
  • When looking at data by institution type, private college and university endowments have spent at higher rates than other institution types in every year of data collected. This likely reflects private institutions’ heavier reliance on endowment income to fund operations and financial aid, since they lack the state appropriations that cover some of public institutions’ costs.
  • Private college and university endowments have also increased their effective spend rates over time more than any other type, except combined endowments/foundations. This group is typically the smallest cohort among respondents: in FY25, there were 375 private college or university respondents but only 31 combined endowments/foundations.
  • Institutionally-related foundations (IRFs) and public colleges and universities have had relatively steady effective spending practices, staying within a range between 3.8 percent and 4.3 percent, on average, throughout the decade.
CHT-Effective-Spend-Rate-Institution-Type

Conclusion

The past decade of NCSE data shows a clear trend: institutions are drawing more from their endowments. The increase is broad-based across cohorts, though its pace and pattern differ by endowment size and institution type. For boards and investment committees, the implication is material: a higher effective spend rate raises the return needed to preserve purchasing power and maintain intergenerational equity, particularly when inflation is elevated. Boards should consider benchmarking their actual effective spend rate, not just their policy rate, against peers of similar size and type, and test whether their return assumptions can sustain the level of draw required. Future editions of this series will explore these dynamics across other market segments.


 

  1. E.g. Is your Spending Policy Getting the Attention it Needs?, Aligning Spending Policy with Your Institution’s Goals | Commonfund, Investment Policy Statement: The Document Behind Every Decision

Amanda Novello

Author

Amanda Novello

Associate Director

Disclaimer

Certain information contained herein has been obtained from or is based on third-party sources and, although believed to be reliable, has not been independently verified. Such information is as of the date indicated, if indicated, may not be complete, is subject to change and has not necessarily been updated. No representation or warranty, express or implied, is or will be given by The Common Fund for Nonprofit Organizations, any of its affiliates or any of its or their affiliates, trustees, directors, officers, employees or advisers (collectively referred to herein as “Commonfund”) or any other person as to the accuracy or completeness of the information in any third-party materials. Accordingly, Commonfund shall not be liable for any direct, indirect or consequential loss or damage suffered by any person as a result of relying on any statement in, or omission from, such third-party materials, and any such liability is expressly disclaimed.

All rights to the trademarks, copyrights, logos and other intellectual property listed herein belong to their respective owners and the use of such logos hereof does not imply an affiliation with, or endorsement by, the owners of such trademarks, copyrights, logos and other intellectual property.

To the extent views presented forecast market activity, they may be based on many factors in addition to those explicitly stated herein. Forecasts of experts inevitably differ. Views attributed to third-parties are presented to demonstrate the existence of points of view, not as a basis for recommendations or as investment advice. Market and investment views of third-parties presented herein do not necessarily reflect the views of Commonfund, any manager retained by Commonfund to manage any investments for Commonfund (each, a “Manager”) or any fund managed by any Commonfund entity (each, a “Fund”). Accordingly, the views presented herein may not be relied upon as an indication of trading intent on behalf of Commonfund, any Manager or any Fund.

Statements concerning Commonfund’s views of possible future outcomes in any investment asset class or market, or of possible future economic developments, are not intended, and should not be construed, as forecasts or predictions of the future investment performance of any Fund. Such statements are also not intended as recommendations by any Commonfund entity or any Commonfund employee to the recipient of the presentation. It is Commonfund’s policy that investment recommendations to its clients must be based on the investment objectives and risk tolerances of each individual client. All market outlook and similar statements are based upon information reasonably available as of the date of this presentation (unless an earlier date is stated with regard to particular information), and reasonably believed to be accurate by Commonfund. Commonfund disclaims any responsibility to provide the recipient of this presentation with updated or corrected information or statements. Past performance is not indicative of future results. For more information please refer to Important Disclosures.

Stay connected with the Insights Blog

Popular Blog Posts


Investment Strategy | Insights Blog

Determinants of Portfolio Returns – It Depends…

Asset allocation decisions have traditionally been associated with being the major determinant of portfolio returns. The Brinson, Hood, Beebower study of 19861 estimated that nearly 90 percent of...
Governance And Policy | Insights Blog

Three Fundamental Duties of Nonprofit Boards

It is essential that trustees of endowed portfolios hold themselves accountable to a set of standards in order to maintain sound governance practices. Fiduciary duty is an important part of the...
Market Commentary | Insights Blog

The New Era of Market Concentration

Market concentration has become a key theme, with the top 10 companies constituting more than 40 percent of the S&P 500 Index by market capitalization. This comfortably surpasses market concentration...

Disclaimer

Certain information contained herein has been obtained from or is based on third-party sources and, although believed to be reliable, has not been independently verified. Such information is as of the date indicated, if indicated, may not be complete, is subject to change and has not necessarily been updated. No representation or warranty, express or implied, is or will be given by The Common Fund for Nonprofit Organizations, any of its affiliates or any of its or their affiliates, trustees, directors, officers, employees or advisers (collectively referred to herein as “Commonfund”) or any other person as to the accuracy or completeness of the information in any third-party materials. Accordingly, Commonfund shall not be liable for any direct, indirect or consequential loss or damage suffered by any person as a result of relying on any statement in, or omission from, such third-party materials, and any such liability is expressly disclaimed.

All rights to the trademarks, copyrights, logos and other intellectual property listed herein belong to their respective owners and the use of such logos hereof does not imply an affiliation with, or endorsement by, the owners of such trademarks, copyrights, logos and other intellectual property.

To the extent views presented forecast market activity, they may be based on many factors in addition to those explicitly stated herein. Forecasts of experts inevitably differ. Views attributed to third-parties are presented to demonstrate the existence of points of view, not as a basis for recommendations or as investment advice. Market and investment views of third-parties presented herein do not necessarily reflect the views of Commonfund, any manager retained by Commonfund to manage any investments for Commonfund (each, a “Manager”) or any fund managed by any Commonfund entity (each, a “Fund”). Accordingly, the views presented herein may not be relied upon as an indication of trading intent on behalf of Commonfund, any Manager or any Fund.

Statements concerning Commonfund’s views of possible future outcomes in any investment asset class or market, or of possible future economic developments, are not intended, and should not be construed, as forecasts or predictions of the future investment performance of any Fund. Such statements are also not intended as recommendations by any Commonfund entity or any Commonfund employee to the recipient of the presentation. It is Commonfund’s policy that investment recommendations to its clients must be based on the investment objectives and risk tolerances of each individual client. All market outlook and similar statements are based upon information reasonably available as of the date of this presentation (unless an earlier date is stated with regard to particular information), and reasonably believed to be accurate by Commonfund. Commonfund disclaims any responsibility to provide the recipient of this presentation with updated or corrected information or statements. Past performance is not indicative of future results. For more information please refer to Important Disclosures.