Markets Rally to Close 2022, but Sentiment Remains Dismal

January 17, 2023 |
2 minute read
|

Strong Fourth Quarter for Global Markets

Following three quarters of bleak performance, global markets staged a rally to close what was a tumultuous 2022.

In the fourth quarter, the MSCI ACWI returned 9.8 percent and the Bloomberg Aggregate Bond Index returned 1.9 percent, reversing the prior quarter’s performance of -6.8 and -4.8 percent, respectively. Much of this strong performance occurred in October and November, as moderating inflation drove yields lower and served as the catalyst for a rally in stocks. The market response to the October CPI report on November 10th was most notable, as the S&P 500 gained 5.5 percent, its biggest one-day rally since April 2020, when risk markets were recovering from the pandemic shock. In December, investor sentiment worsened because of stronger than expected employment data and the markets weakened into year-end.

Sentiment and Positioning have yet to Bottom

Despite the strong performance, investor sentiment remains broadly negative. This Chart of the Month depicts the S&P 500 Put/Call ratio1, along with its 30-day moving average dating back to 2001. Although the daily ratio is clearly noisy and subject to significant volatility, it reached multi-decade highs of 2.0 and 2.4 during the waning days of 2022. Fundamentally, part of the reason for such a high number can be traced to an overall shift in investor derivatives appetites. During the fourth quarter, Goldman Sachs reported that 45 percent of listed S&P 500 options volume have less than one day to expiry, as traders sought to capitalize on daily moves. This level trended between 5 and 10 percent through the 2010s but spiked to 20 percent amid a volatile 2020 and has continued an upward trend above 40 percent in 2022.

Chart1-2023-January-COM

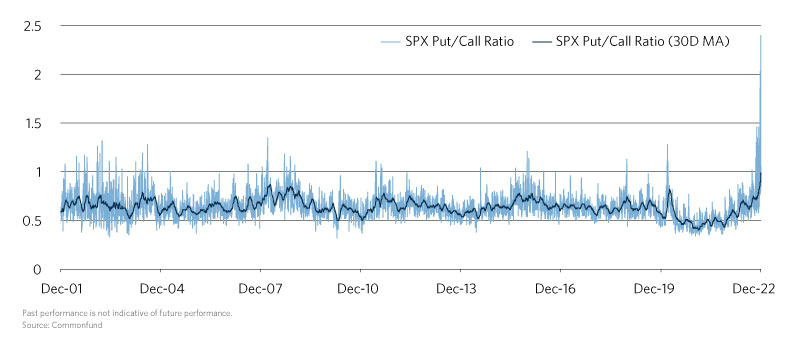
The 30-day moving average smooths out the daily spikes but has nonetheless been trending upward throughout 2022, a reflection of the overall bearish sentiment. As of December 30, 2022, the 30-day moving average was approximately 0.97. Strikingly, these levels are higher than the ratios seen during the depths of the 2002 tech selloff, 2008 Financial Crisis, and the March 2020 dislocation.

Other metrics help illustrate the dismal investor sentiment at present. The American Association of Individual Investors Survey indicates that institutional investors total stock allocations have declined from just north of 70 percent to nearly 60 percent over the last year. Additionally, according to Bank of America’s Global Fund Manager Survey, the net percentage of allocators that are overweight equities versus bonds has reached the lowest point since March 2009. Each of these indicators show that the fourth quarter rally was not embraced by many investors. As investors remain hyper-focused on macroeconomic data in the new year, it will be key to keep track of an overall sentiment shift that has not yet reflected in the data.

Visit our investment strategy page to learn more

  1. The Put/Call Ratio represents the ratio between the total volume of equity put options over call options, reported at the end of each trading day

Cameron Dyer

Author

Cameron Dyer

Disclaimer

Certain information contained herein has been obtained from or is based on third-party sources and, although believed to be reliable, has not been independently verified. Such information is as of the date indicated, if indicated, may not be complete, is subject to change and has not necessarily been updated. No representation or warranty, express or implied, is or will be given by The Common Fund for Nonprofit Organizations, any of its affiliates or any of its or their affiliates, trustees, directors, officers, employees or advisers (collectively referred to herein as “Commonfund”) or any other person as to the accuracy or completeness of the information in any third-party materials. Accordingly, Commonfund shall not be liable for any direct, indirect or consequential loss or damage suffered by any person as a result of relying on any statement in, or omission from, such third-party materials, and any such liability is expressly disclaimed.

All rights to the trademarks, copyrights, logos and other intellectual property listed herein belong to their respective owners and the use of such logos hereof does not imply an affiliation with, or endorsement by, the owners of such trademarks, copyrights, logos and other intellectual property.

To the extent views presented forecast market activity, they may be based on many factors in addition to those explicitly stated herein. Forecasts of experts inevitably differ. Views attributed to third-parties are presented to demonstrate the existence of points of view, not as a basis for recommendations or as investment advice. Market and investment views of third-parties presented herein do not necessarily reflect the views of Commonfund, any manager retained by Commonfund to manage any investments for Commonfund (each, a “Manager”) or any fund managed by any Commonfund entity (each, a “Fund”). Accordingly, the views presented herein may not be relied upon as an indication of trading intent on behalf of Commonfund, any Manager or any Fund.

Statements concerning Commonfund’s views of possible future outcomes in any investment asset class or market, or of possible future economic developments, are not intended, and should not be construed, as forecasts or predictions of the future investment performance of any Fund. Such statements are also not intended as recommendations by any Commonfund entity or any Commonfund employee to the recipient of the presentation. It is Commonfund’s policy that investment recommendations to its clients must be based on the investment objectives and risk tolerances of each individual client. All market outlook and similar statements are based upon information reasonably available as of the date of this presentation (unless an earlier date is stated with regard to particular information), and reasonably believed to be accurate by Commonfund. Commonfund disclaims any responsibility to provide the recipient of this presentation with updated or corrected information or statements. Past performance is not indicative of future results. For more information please refer to Important Disclosures.

Stay connected with the Insights Blog

Popular Blog Posts


Market Commentary | Insights Blog

Chart of the Month | U.S. Budget Deficit Hits Record Highs

In his first 100 days as President of the United States, Joe Biden has introduced three domestic funding proposals, totaling close to $6.0 Trillion, reflecting a desire to enhance the role of the...
Perspectives | Insights Blog

The Case for Using the Higher Education Price Index® (HEPI) to Define Inflation for Colleges

When calculating return targets for an endowment portfolio, a conventional piece of the equation is often the Consumer Price Index (CPI). CPI plus 5% is the common short-hand formula for institutions...
Market Commentary | Insights Blog

Chart of the Month | The Surprising Relationship Between Money Supply and Inflation

The potential for rising inflation is becoming a top concern for many investors and consumers. Many believe that inflation is already here as evidenced by price increases in commodities, homes,...

Disclaimer

Certain information contained herein has been obtained from or is based on third-party sources and, although believed to be reliable, has not been independently verified. Such information is as of the date indicated, if indicated, may not be complete, is subject to change and has not necessarily been updated. No representation or warranty, express or implied, is or will be given by The Common Fund for Nonprofit Organizations, any of its affiliates or any of its or their affiliates, trustees, directors, officers, employees or advisers (collectively referred to herein as “Commonfund”) or any other person as to the accuracy or completeness of the information in any third-party materials. Accordingly, Commonfund shall not be liable for any direct, indirect or consequential loss or damage suffered by any person as a result of relying on any statement in, or omission from, such third-party materials, and any such liability is expressly disclaimed.

All rights to the trademarks, copyrights, logos and other intellectual property listed herein belong to their respective owners and the use of such logos hereof does not imply an affiliation with, or endorsement by, the owners of such trademarks, copyrights, logos and other intellectual property.

To the extent views presented forecast market activity, they may be based on many factors in addition to those explicitly stated herein. Forecasts of experts inevitably differ. Views attributed to third-parties are presented to demonstrate the existence of points of view, not as a basis for recommendations or as investment advice. Market and investment views of third-parties presented herein do not necessarily reflect the views of Commonfund, any manager retained by Commonfund to manage any investments for Commonfund (each, a “Manager”) or any fund managed by any Commonfund entity (each, a “Fund”). Accordingly, the views presented herein may not be relied upon as an indication of trading intent on behalf of Commonfund, any Manager or any Fund.

Statements concerning Commonfund’s views of possible future outcomes in any investment asset class or market, or of possible future economic developments, are not intended, and should not be construed, as forecasts or predictions of the future investment performance of any Fund. Such statements are also not intended as recommendations by any Commonfund entity or any Commonfund employee to the recipient of the presentation. It is Commonfund’s policy that investment recommendations to its clients must be based on the investment objectives and risk tolerances of each individual client. All market outlook and similar statements are based upon information reasonably available as of the date of this presentation (unless an earlier date is stated with regard to particular information), and reasonably believed to be accurate by Commonfund. Commonfund disclaims any responsibility to provide the recipient of this presentation with updated or corrected information or statements. Past performance is not indicative of future results. For more information please refer to Important Disclosures.