With the release of the annual NACUBO-Commonfund Study of Endowments (NCSE) comes the obligatory comparison of 1-year returns. “How did we do relative to the 12.2 percent average return” is a question frequently asked at many committee meetings and while it is certainly important to understand what peers are doing, the most recent 1-year return may be the most overrated number in the 127 page study. If readers of the study can overcome the admittedly strong animal spirits of short term competition, they may find other data points that prove more relevant to their missions.
For example two such data points are the gaps between required returns, expected returns, and historical returns. As we explain below, the gap between these three measures is the widest it has been in a decade, which suggests that at some point colleges and universities will have to face reality.
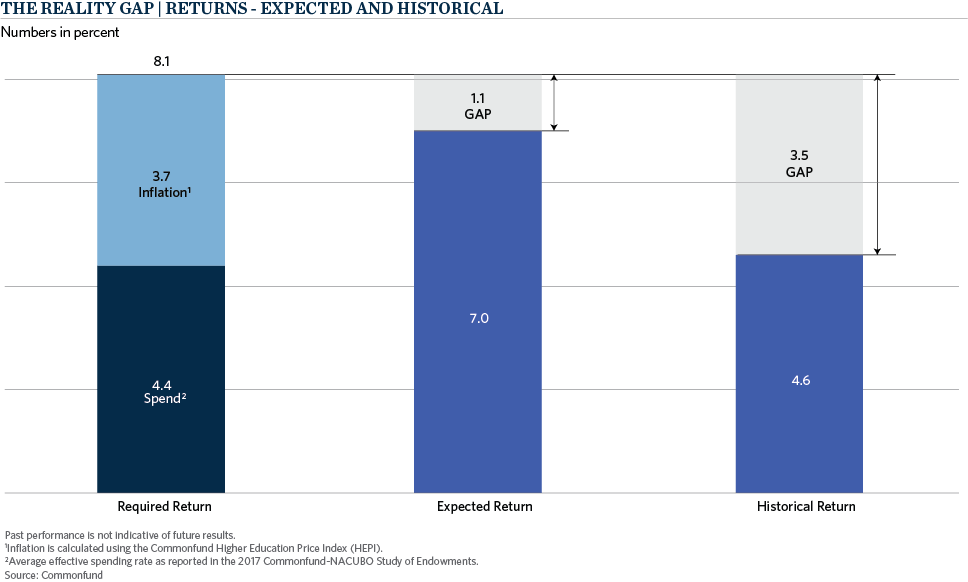
Most educational institutions have a “required return” that they need to achieve in order to maintain intergenerational equity, or purchasing power, in perpetuity. That required return can be calculated with three fundamental inputs: spending, inflation and costs. For the purposes of this discussion, we exclude costs as they presumably net out in the reported performance numbers. Our CEO, Catherine Keating, has used the “CPI +5” mantra to define the long term return objective for many non-profits. CPI +5 is a great big-picture way to think about spending plus inflation, but we can get even more granular using NCSE data. The average effective spend rate reported for FY 2017 was 4.4 percent. We also know that the inflation experienced by colleges and universities is better captured by HEPI, or the Commonfund Higher Education Price Index, which measures a basket of goods and services consumed by higher education institutions. HEPI has historically run higher than CPI and, in fact, was most recently 3.7 percent. So a 4.4 percent effective spend plus inflation of 3.7 percent leads to a “required” return of 8.1 percent. And yet, when asked what their “expected” return is for the next ten years, the median response was 7.0 percent. This 110 basis point (1.1 percent) differential is the first “gap” that must be addressed.
The picture becomes even more complicated when actual historical returns are considered. While the average reported 1-year return was significantly higher in FY 2017 (12.2 percent vs. -1.9% in FY 2016), the 10-year historical return dropped to 4.6 percent from 5.0 percent. If colleges and universities have a “required” return of 8.1 percent and actual historical experience has been 4.6 percent, the implied gap is now 3.5 percent. At 350bps between historical actual returns and required returns, the spread, or gap, is the widest it has been in at least a decade using the same data and calculations.

The most recent 10-year return is definitely time point sensitive as the decline from 5.0 percent to 4.6 percent in FY 2017 was impacted by dropping a strong return in 2007 (17.2 percent) from the calculation. If we look back at the recent past, the average of 10-year returns since FY 2010 was 5.7 percent. The average required return over that same time period was 6.5 percent resulting in a gap of 85 basis points.
Whether the gap between what higher education institutions need to earn and what they have actually earned (or what they expect to earn) widens or narrows depends on myriad factors including, but not limited to, what institutions choose to spend and what future returns will be. Reducing the effective spend rate is one lever that will help to close the gap. Unfortunately this doesn’t appear to be the trend, as 65 percent of survey respondents reported increasing their spending and the average increase for those who did was 6.5 percent, higher than CPI and HEPI combined. Sophisticated models are not needed to illustrate the challenge with sustaining 6.5 percent increases in spending year-over-year. We have long argued for careful evaluation and review of spending policies, most recently with a blog on how susceptible spending policies will be to the next downturn. Many institutions are beginning to ask if their spending rates are too high for what they expect to be a lower return environment going forward.
At Commonfund we agree with the survey respondents that reported expected returns that are 100 basis points lower than they were five years ago (7.0 percent vs. 8.0 percent in FY 2013). Moreover, we believe that a passive portfolio of traditional stocks and bonds may not be able to deliver the 8.1 percent required return for the average college or university and as such encourage institutions to review their investment policies, evaluate their equity exposure, understand how diversified they are, develop and execute an illiquidity budget, and understand the risks they are taking to generate what is hopefully a level of return that can close the gap.


