Chart of the Month | The Shape of Inflation

October 24, 2022 |
2 minute read
|

The Consumer Price Index continues to surprise central bankers, commentators, and market participants alike.  The latest headline reading of 8.2 percent, which reflects year-over-year price increases for the month of September, confirmed what many had feared: Inflation is not falling as swiftly as predicted or hoped.

While the headline number decreased, core inflation (which strips out the volatile food and energy components) increased year-over-year and month-over-month. This suggests an increase in the rate of change of today’s inflationary pressures. This recent data has all but confirmed another 75-basis point increase of the key Fed Funds rate at the upcoming November FOMC meeting and has led market participants to begin to price in another 75-basis point hike in December.

Drivers have broadened across many components

A key takeaway from the recent inflation prints is that the drivers have shifted significantly throughout 2022. In 2021, many were quick to label inflation a story of post pandemic reopening and supply chain disruption. This brought considerable focus on categories such as airfares, hotels, and used cars & trucks. Also, the Russian Invasion of Ukraine caused turmoil in energy markets, which severely impacted the energy component of inflation. While those pressures have subsided over the past few months, the August and September inflation readings have shown increasing prices in services. It is now evident that price increases have become more broad-based amongst “stickier” categories that do not reprice as often as food or commodities, namely shelter and wages. The shelter component of CPI, Owner’s Equivalent Rent1 (OER), has increased by 6.7 percent since last September; the highest year-over-year reading since the inception of the component in January 1984. While house prices have begun to fall nationally, this will take time to reflect in the CPI, and a higher OER component will underpin high inflation in the coming months. As for the wage’s component, the Bureau of Labor Statistics recently reported that the average hourly earnings paid to employees has risen well above its long-term average of approximately 3 percent; currently hovering at the 5 percent level.
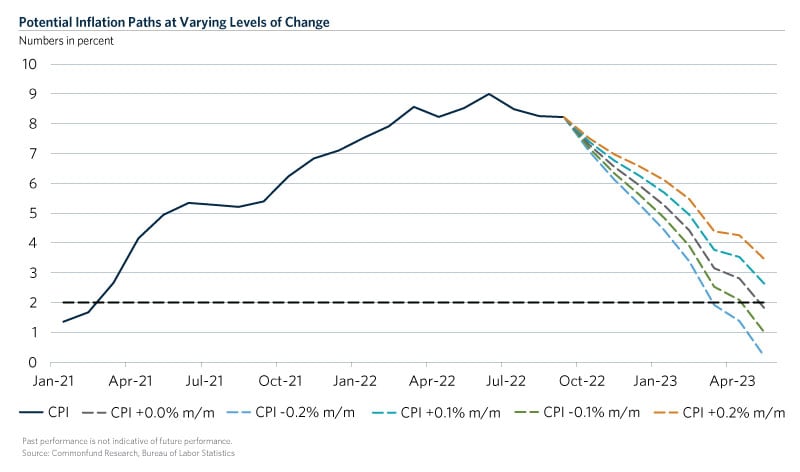
Near-term pathways

To examine some of the potential outcomes of inflation into 2023, we forecasted CPI readings until mid-year assuming constant month-over-month growth of -0.2 percent, -0.1 percent, a flat 0 percent, 0.1 percent, and 0.2 percent. For context, the month-over-month readings for July, August, and September were 0.1 percent, 0.0 percent, and 0.4 percent, respectively. Most strikingly, inflation will take some months to slow to a tolerable level – around 2 percent – for consumers and the FOMC. Even if we have 0 percent month-over-month inflation through year-end (likely a best case-scenario), 2022 inflation will still be just under 6 percent and only break 2 percent by May of 2023 given the same assumption. A worse scenario would be 0.2 percent month-over-month growth, keeping inflation well above 2 percent midway through 2023. While we expect price pressures to slow throughout 2023, the process could be a lengthy one, especially if shelter and wage inflation continues. Resilient employment data has given FOMC officials the green light for aggressive contractionary rate policy, however, the speed at which the rate hikes can lead to a tolerable rate of inflation remains in question.

Chart-The-Shape-of-Inflation

  1. Owner’s equivalent rent (OER), which seeks to quantify shelter as a unit of consumption, rather than a unit of investment. This is one of the reasons why OER tends to lag broader housing market movements and why booming house prices in 2021 did not reflect in the calculation at the time.
Cameron Dyer

Author

Cameron Dyer

Disclaimer

Certain information contained herein has been obtained from or is based on third-party sources and, although believed to be reliable, has not been independently verified. Such information is as of the date indicated, if indicated, may not be complete, is subject to change and has not necessarily been updated. No representation or warranty, express or implied, is or will be given by The Common Fund for Nonprofit Organizations, any of its affiliates or any of its or their affiliates, trustees, directors, officers, employees or advisers (collectively referred to herein as “Commonfund”) or any other person as to the accuracy or completeness of the information in any third-party materials. Accordingly, Commonfund shall not be liable for any direct, indirect or consequential loss or damage suffered by any person as a result of relying on any statement in, or omission from, such third-party materials, and any such liability is expressly disclaimed.

All rights to the trademarks, copyrights, logos and other intellectual property listed herein belong to their respective owners and the use of such logos hereof does not imply an affiliation with, or endorsement by, the owners of such trademarks, copyrights, logos and other intellectual property.

To the extent views presented forecast market activity, they may be based on many factors in addition to those explicitly stated herein. Forecasts of experts inevitably differ. Views attributed to third-parties are presented to demonstrate the existence of points of view, not as a basis for recommendations or as investment advice. Market and investment views of third-parties presented herein do not necessarily reflect the views of Commonfund, any manager retained by Commonfund to manage any investments for Commonfund (each, a “Manager”) or any fund managed by any Commonfund entity (each, a “Fund”). Accordingly, the views presented herein may not be relied upon as an indication of trading intent on behalf of Commonfund, any Manager or any Fund.

Statements concerning Commonfund’s views of possible future outcomes in any investment asset class or market, or of possible future economic developments, are not intended, and should not be construed, as forecasts or predictions of the future investment performance of any Fund. Such statements are also not intended as recommendations by any Commonfund entity or any Commonfund employee to the recipient of the presentation. It is Commonfund’s policy that investment recommendations to its clients must be based on the investment objectives and risk tolerances of each individual client. All market outlook and similar statements are based upon information reasonably available as of the date of this presentation (unless an earlier date is stated with regard to particular information), and reasonably believed to be accurate by Commonfund. Commonfund disclaims any responsibility to provide the recipient of this presentation with updated or corrected information or statements. Past performance is not indicative of future results. For more information please refer to Important Disclosures.

Stay connected with the Insights Blog

Popular Blog Posts


Market Commentary | Insights Blog

Chart of the Month | U.S. Budget Deficit Hits Record Highs

In his first 100 days as President of the United States, Joe Biden has introduced three domestic funding proposals, totaling close to $6.0 Trillion, reflecting a desire to enhance the role of the...
Perspectives | Insights Blog

The Case for Using the Higher Education Price Index® (HEPI) to Define Inflation for Colleges

When calculating return targets for an endowment portfolio, a conventional piece of the equation is often the Consumer Price Index (CPI). CPI plus 5% is the common short-hand formula for institutions...
Investment Strategy | Insights Blog

Key Factors in Asset Allocation Decisions for Endowments

There are several broad subjects that an effective investment policy statement (IPS) should include in its contents and address clearly and specifically as they relate to an endowed institution. This...

Disclaimer

Certain information contained herein has been obtained from or is based on third-party sources and, although believed to be reliable, has not been independently verified. Such information is as of the date indicated, if indicated, may not be complete, is subject to change and has not necessarily been updated. No representation or warranty, express or implied, is or will be given by The Common Fund for Nonprofit Organizations, any of its affiliates or any of its or their affiliates, trustees, directors, officers, employees or advisers (collectively referred to herein as “Commonfund”) or any other person as to the accuracy or completeness of the information in any third-party materials. Accordingly, Commonfund shall not be liable for any direct, indirect or consequential loss or damage suffered by any person as a result of relying on any statement in, or omission from, such third-party materials, and any such liability is expressly disclaimed.

All rights to the trademarks, copyrights, logos and other intellectual property listed herein belong to their respective owners and the use of such logos hereof does not imply an affiliation with, or endorsement by, the owners of such trademarks, copyrights, logos and other intellectual property.

To the extent views presented forecast market activity, they may be based on many factors in addition to those explicitly stated herein. Forecasts of experts inevitably differ. Views attributed to third-parties are presented to demonstrate the existence of points of view, not as a basis for recommendations or as investment advice. Market and investment views of third-parties presented herein do not necessarily reflect the views of Commonfund, any manager retained by Commonfund to manage any investments for Commonfund (each, a “Manager”) or any fund managed by any Commonfund entity (each, a “Fund”). Accordingly, the views presented herein may not be relied upon as an indication of trading intent on behalf of Commonfund, any Manager or any Fund.

Statements concerning Commonfund’s views of possible future outcomes in any investment asset class or market, or of possible future economic developments, are not intended, and should not be construed, as forecasts or predictions of the future investment performance of any Fund. Such statements are also not intended as recommendations by any Commonfund entity or any Commonfund employee to the recipient of the presentation. It is Commonfund’s policy that investment recommendations to its clients must be based on the investment objectives and risk tolerances of each individual client. All market outlook and similar statements are based upon information reasonably available as of the date of this presentation (unless an earlier date is stated with regard to particular information), and reasonably believed to be accurate by Commonfund. Commonfund disclaims any responsibility to provide the recipient of this presentation with updated or corrected information or statements. Past performance is not indicative of future results. For more information please refer to Important Disclosures.