Flexing Your Global Portfolio Can Lead to ACWI Fatigue, but Don't Throw in the Towel Yet

June 6, 2017 |
3 minute read
|

Like the build-up of lactic acid in your muscles after a strenuous workout, the underperformance of Morgan Stanley Capital International All Country World index (MSCI ACWI) vs. the Standard & Poor’s 500 (S&P 500) – or any U.S. equity benchmark, for that matter – for the last several years has been building up to a painful point. This pain threshold has pushed investors to the limits of their global endurance resulting in what we call “ACWI Fatigue.” ACWI Fatigue is most acute with institutional investors who use the MSCI ACWI as their equity benchmark and, as a result, have a globally-oriented equity portfolio.

Exhibit 1 demonstrates this Fatigue. Since the Great Recession, ACWI has underperformed the S&P 500 in six out of eight years. The natural query that investors make is why construct their portfolios to match a global benchmark when the U.S. stock market performs so much better? The question seems all the more relevant in light of the extended underperformance of ACWI compared to the S&P 500.

Geographical Performance Leadership is Cyclical

However, before we throw out our global training regimen, let’s take a closer look at the longer term track record of ACWI ex-U.S. versus the S&P 500. Exhibit 1 presents a clear cyclical pattern. There are long stretches of time when ACWI ex-U.S. outperforms the U.S. equity markets and vice versa. Trying to time these markets is not an easy task but it is clear that the performance of ACWI ex-U.S. and the S&P 500 do complement one another.

Exhibit 1
EX1-SP500vsACWI

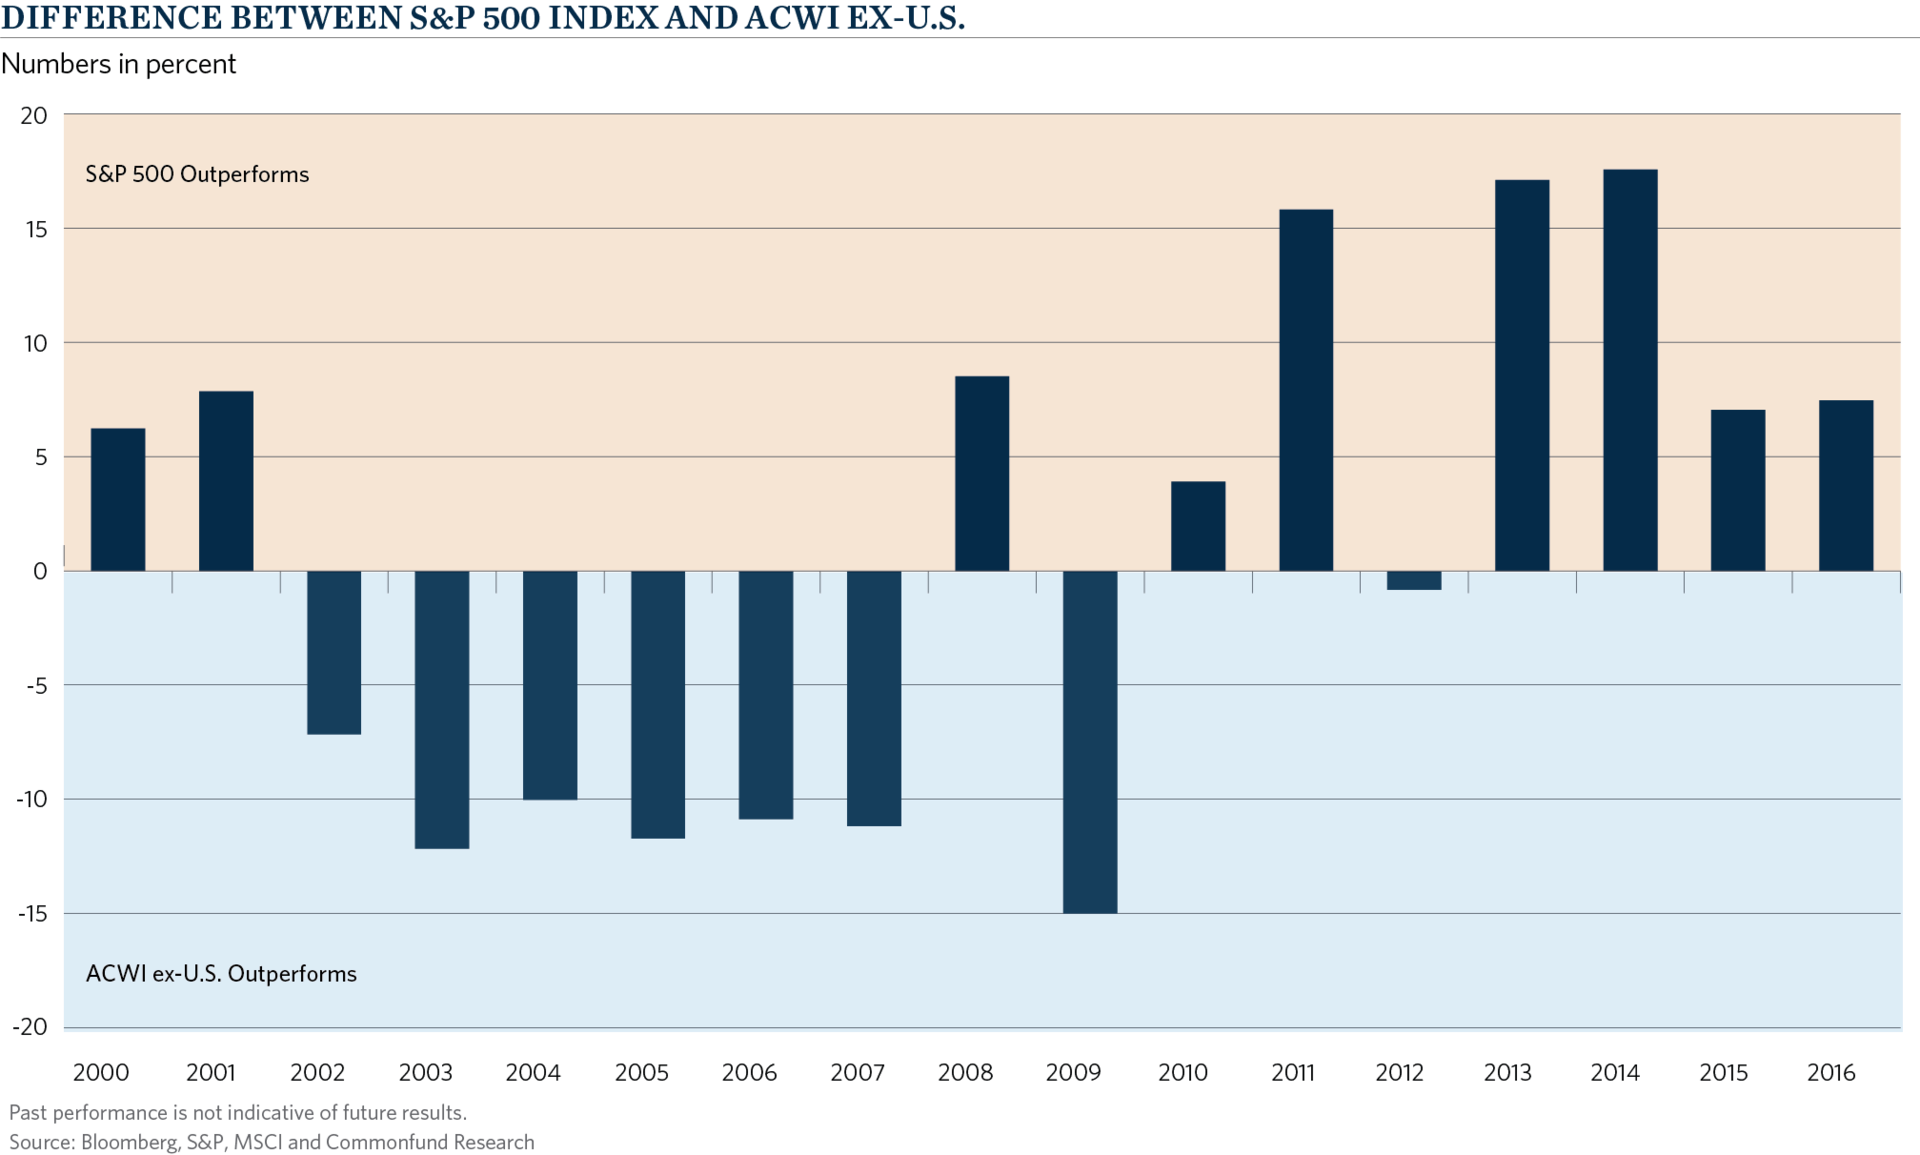
Another part of the Fatigue is the increasing globalization of economic fundamentals. Going back 20 years, economists referred to the “G7”—the seven largest industrialized nations that ruled much of the world’s economic output. Then this group expanded to the G10, then the G15 and, today, the G20. Simply put, the world has become a smaller place. Macroeconomic policies—both fiscal and monetary—are synchronized to a much greater extent than they were just 10 years ago. This means that diversification on a global scale has less of an impact today than in the past.

Global Correlations are Up – But That Might Not Tell the Whole Story

Exhibit 2 demonstrates this point. We chart the rolling correlation of ACWI with the S&P 500. Exhibit 2 indicates that going back to the early and mid-1990s, the correlation between ACWI and the S&P 500 was about 0.5. However over the last 15 years, this correlation has climbed to 0.95.

Another reason for this increased correlation across global equity markets is that corporations now sell to the global market place. Coca-Cola earns the majority of its revenue from outside the United States. Mercedes, Audi, and BMW sell more cars in the United States than in Germany. Large corporations now operate on a multinational scale—geographic borders do not define the limits of their marketplace.

Exhibit 2
EX2-3YRCorrACWI+S&P

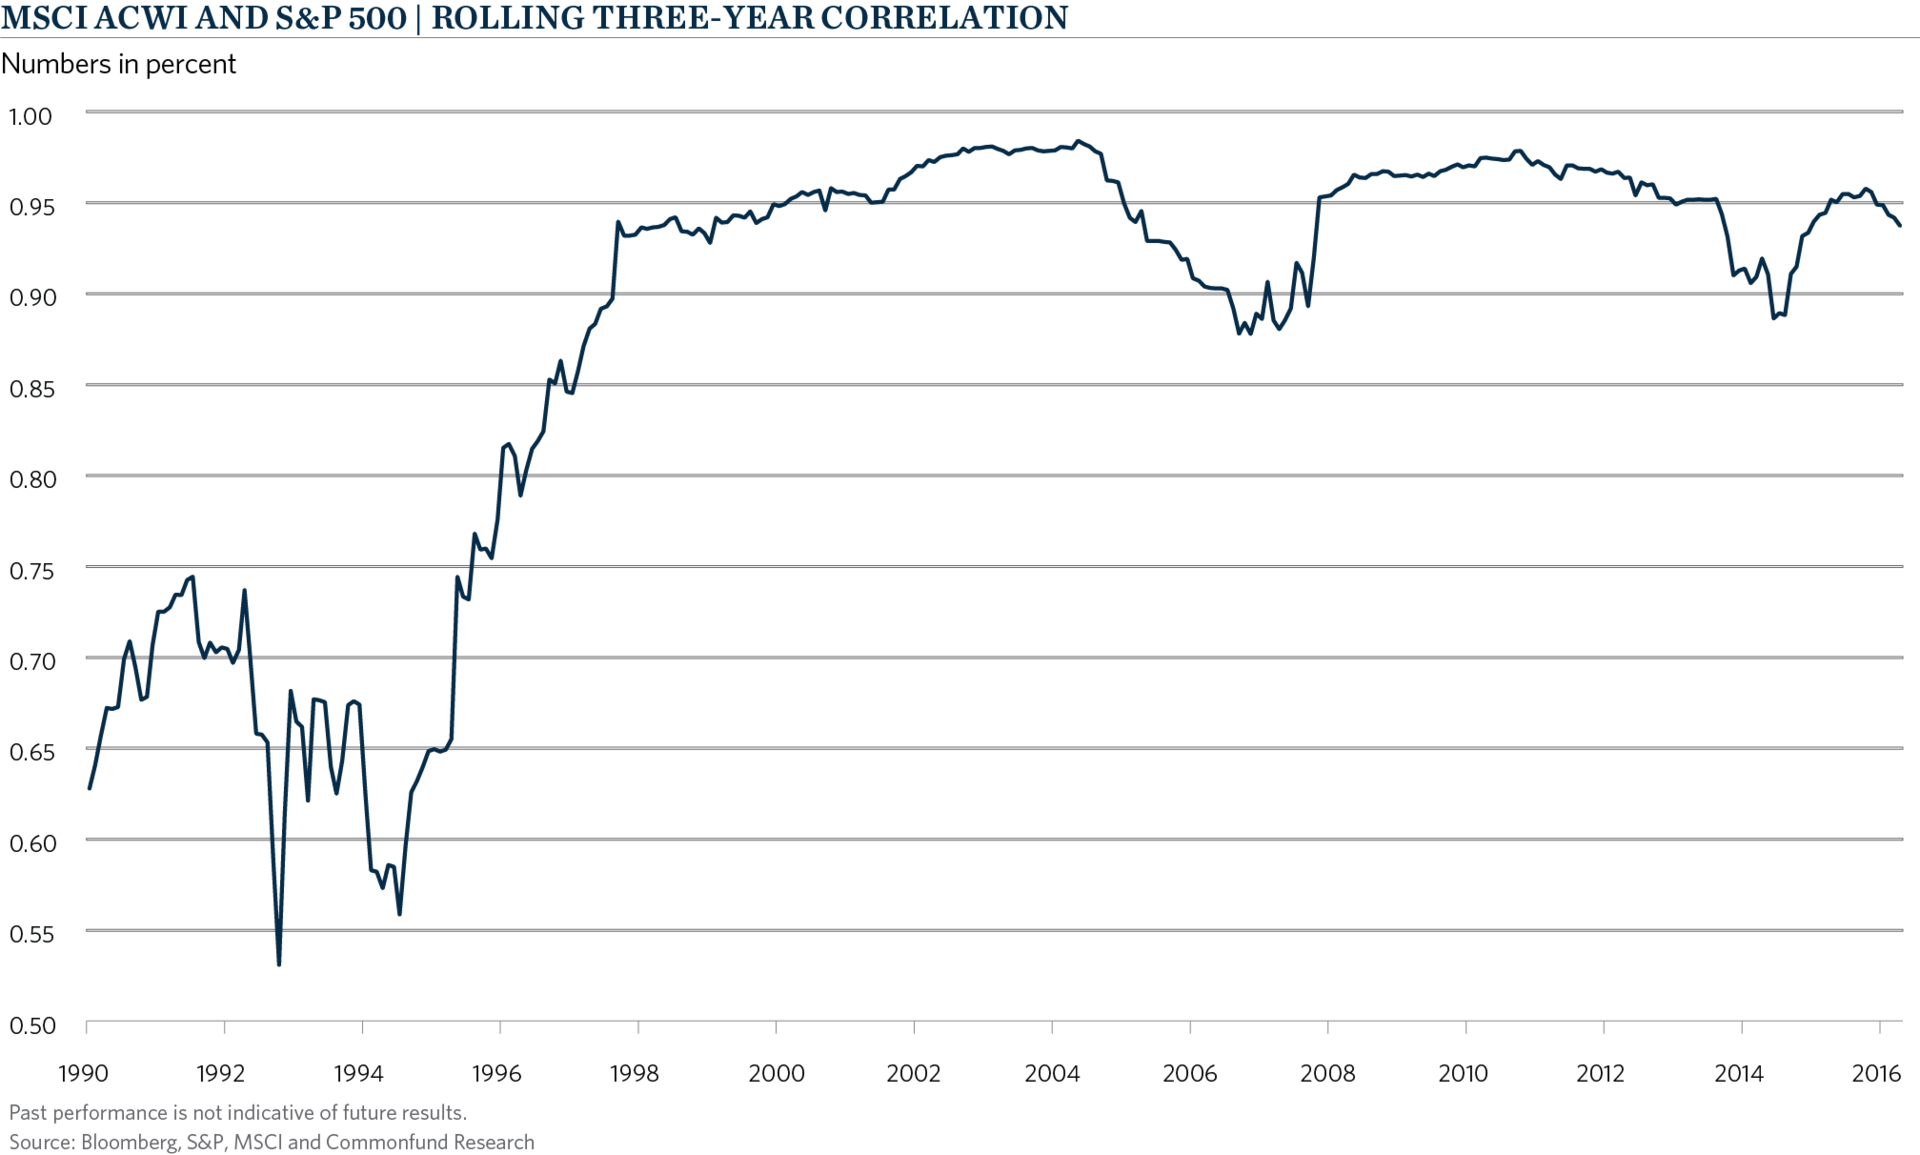
Yet, despite this increased synchronization across economic borders there are still benefits with respect to a global equity benchmark. First, modern portfolio theory teaches us that the more you constrain your portfolio, the less efficient it becomes. Simply, you shrink your economic sandbox by committing to a domestic equity benchmark. Conversely, committing to a global benchmark like ACWI does not mean that you must follow the precise geographic weights contained within the global benchmark (roughly 55% U.S., 30% Development Markets ex-U.S., and 15% Emerging Markets). Instead, an investor can still retain the freedom to overweight the U.S. relative to international markets, while maintaining the largest sandbox available.

An Expanded Global Opportunity Set is Still Good Investment Practice

Think back to our example of Mercedes, Audi and BMW selling more cars in the U.S. than in Germany. If a U.S. investor were to limit his or her portfolio construction to only the U.S. equity market, there are only three independent car manufacturers remaining in the United States: Tesla, Ford and General Motors. That is a very limited bet on the auto industry. Conversely, outside the U.S., the auto industry is much larger—from Mercedes to Toyota to Hyundai. The larger the sandbox, the more cars you can play with in it. Further, if you commit only to the U.S., you only access about one third of Global GDP Growth, as seen in Exhibit 3. Even if correlations remain high, gaining access to other economic drivers of global GDP is a sensible (and economic) thing to do.

Exhibit 3
EX3-GDPGrowth

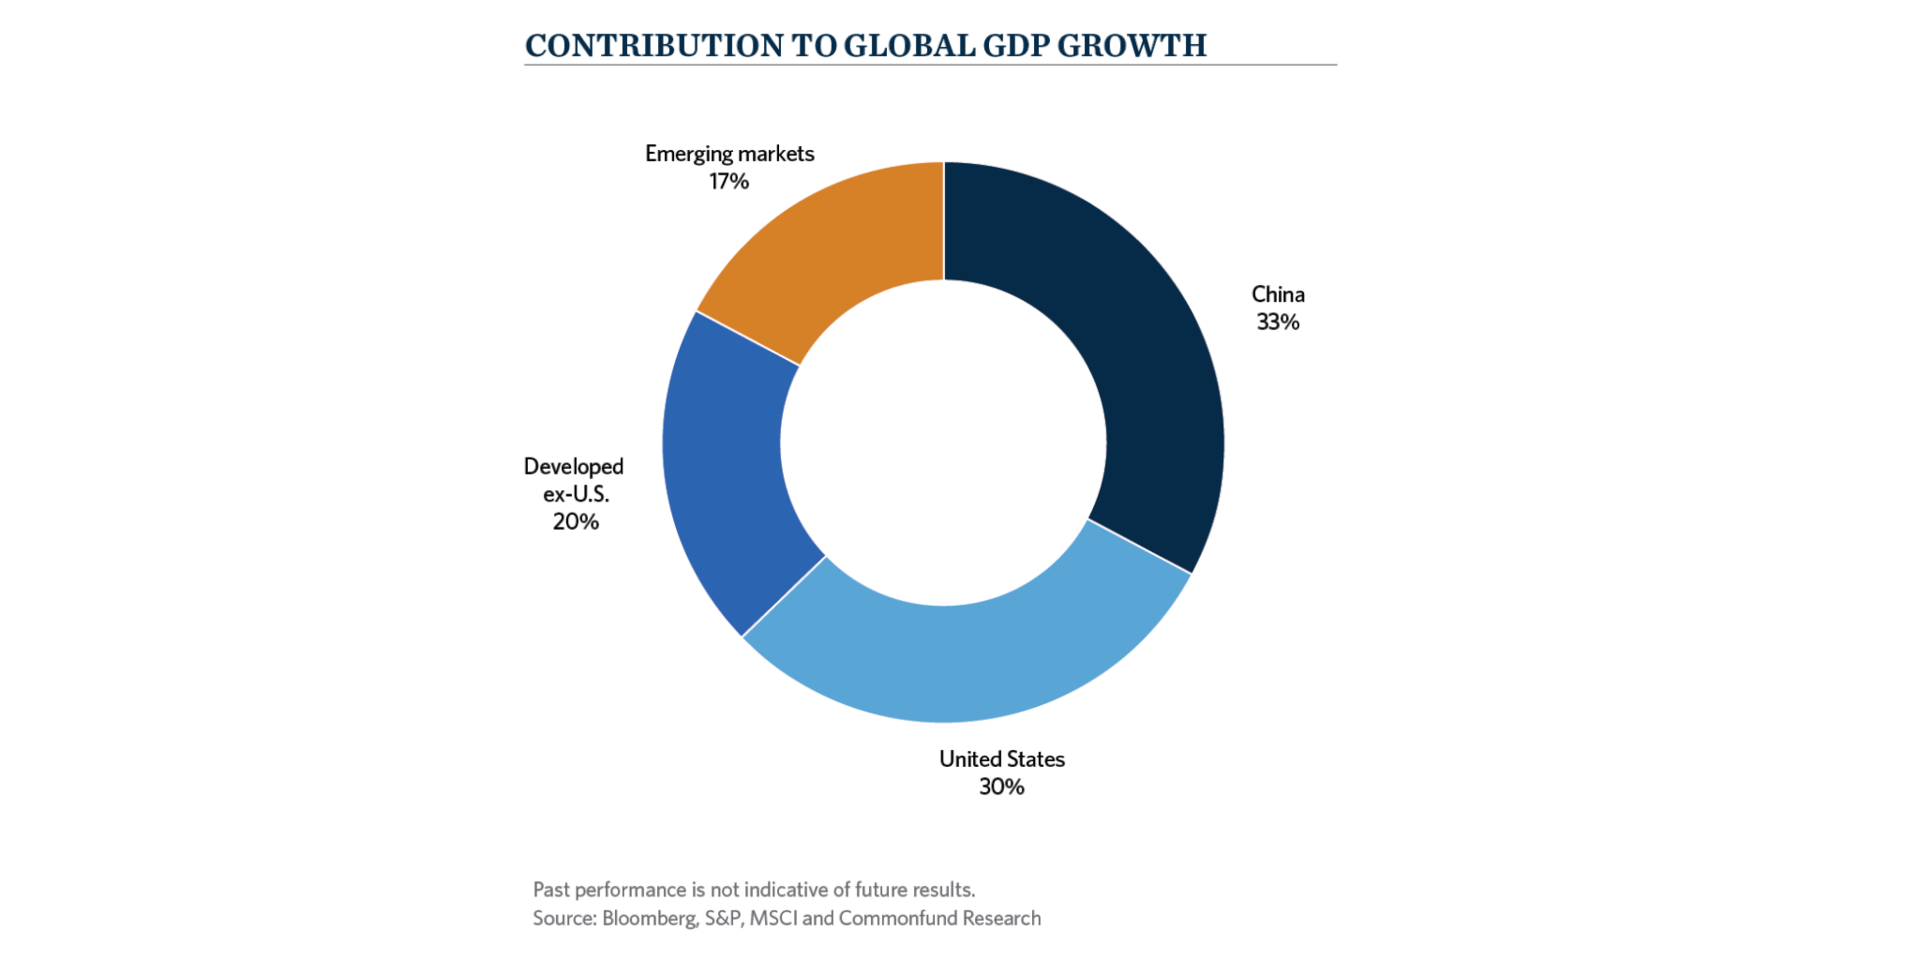
Lastly, this larger sandbox is even more important for institutions that choose to use active management for all or significant portions of their equity allocations. In the quest for alpha, we have found that providing active managers the freedom to search out and act on their best ideas globally is an important contributor to long-term performance success. This is all the more important in less efficient markets, like emerging markets that are a significant growth engine for global GDP, as well as for developed markets like Japan that might follow different fiscal & monetary policies than the United States.

This article was originally published in Pensions&Investments on June 2, 2017.

Mark J.P. Anson

Author

Mark J.P. Anson

Chief Executive Officer and Chief Investment Officer, Commonfund

Disclaimer

Certain information contained herein has been obtained from or is based on third-party sources and, although believed to be reliable, has not been independently verified. Such information is as of the date indicated, if indicated, may not be complete, is subject to change and has not necessarily been updated. No representation or warranty, express or implied, is or will be given by The Common Fund for Nonprofit Organizations, any of its affiliates or any of its or their affiliates, trustees, directors, officers, employees or advisers (collectively referred to herein as “Commonfund”) or any other person as to the accuracy or completeness of the information in any third-party materials. Accordingly, Commonfund shall not be liable for any direct, indirect or consequential loss or damage suffered by any person as a result of relying on any statement in, or omission from, such third-party materials, and any such liability is expressly disclaimed.

All rights to the trademarks, copyrights, logos and other intellectual property listed herein belong to their respective owners and the use of such logos hereof does not imply an affiliation with, or endorsement by, the owners of such trademarks, copyrights, logos and other intellectual property.

To the extent views presented forecast market activity, they may be based on many factors in addition to those explicitly stated herein. Forecasts of experts inevitably differ. Views attributed to third-parties are presented to demonstrate the existence of points of view, not as a basis for recommendations or as investment advice. Market and investment views of third-parties presented herein do not necessarily reflect the views of Commonfund, any manager retained by Commonfund to manage any investments for Commonfund (each, a “Manager”) or any fund managed by any Commonfund entity (each, a “Fund”). Accordingly, the views presented herein may not be relied upon as an indication of trading intent on behalf of Commonfund, any Manager or any Fund.

Statements concerning Commonfund’s views of possible future outcomes in any investment asset class or market, or of possible future economic developments, are not intended, and should not be construed, as forecasts or predictions of the future investment performance of any Fund. Such statements are also not intended as recommendations by any Commonfund entity or any Commonfund employee to the recipient of the presentation. It is Commonfund’s policy that investment recommendations to its clients must be based on the investment objectives and risk tolerances of each individual client. All market outlook and similar statements are based upon information reasonably available as of the date of this presentation (unless an earlier date is stated with regard to particular information), and reasonably believed to be accurate by Commonfund. Commonfund disclaims any responsibility to provide the recipient of this presentation with updated or corrected information or statements. Past performance is not indicative of future results. For more information please refer to Important Disclosures.

Stay connected with the Insights Blog

Popular Blog Posts


Market Commentary | Insights Blog

Chart of the Month | U.S. Budget Deficit Hits Record Highs

In his first 100 days as President of the United States, Joe Biden has introduced three domestic funding proposals, totaling close to $6.0 Trillion, reflecting a desire to enhance the role of the...
Perspectives | Insights Blog

The Case for Using the Higher Education Price Index® (HEPI) to Define Inflation for Colleges

When calculating return targets for an endowment portfolio, a conventional piece of the equation is often the Consumer Price Index (CPI). CPI plus 5% is the common short-hand formula for institutions...
Market Commentary | Insights Blog

Chart of the Month | The Surprising Relationship Between Money Supply and Inflation

The potential for rising inflation is becoming a top concern for many investors and consumers. Many believe that inflation is already here as evidenced by price increases in commodities, homes,...

Disclaimer

Certain information contained herein has been obtained from or is based on third-party sources and, although believed to be reliable, has not been independently verified. Such information is as of the date indicated, if indicated, may not be complete, is subject to change and has not necessarily been updated. No representation or warranty, express or implied, is or will be given by The Common Fund for Nonprofit Organizations, any of its affiliates or any of its or their affiliates, trustees, directors, officers, employees or advisers (collectively referred to herein as “Commonfund”) or any other person as to the accuracy or completeness of the information in any third-party materials. Accordingly, Commonfund shall not be liable for any direct, indirect or consequential loss or damage suffered by any person as a result of relying on any statement in, or omission from, such third-party materials, and any such liability is expressly disclaimed.

All rights to the trademarks, copyrights, logos and other intellectual property listed herein belong to their respective owners and the use of such logos hereof does not imply an affiliation with, or endorsement by, the owners of such trademarks, copyrights, logos and other intellectual property.

To the extent views presented forecast market activity, they may be based on many factors in addition to those explicitly stated herein. Forecasts of experts inevitably differ. Views attributed to third-parties are presented to demonstrate the existence of points of view, not as a basis for recommendations or as investment advice. Market and investment views of third-parties presented herein do not necessarily reflect the views of Commonfund, any manager retained by Commonfund to manage any investments for Commonfund (each, a “Manager”) or any fund managed by any Commonfund entity (each, a “Fund”). Accordingly, the views presented herein may not be relied upon as an indication of trading intent on behalf of Commonfund, any Manager or any Fund.

Statements concerning Commonfund’s views of possible future outcomes in any investment asset class or market, or of possible future economic developments, are not intended, and should not be construed, as forecasts or predictions of the future investment performance of any Fund. Such statements are also not intended as recommendations by any Commonfund entity or any Commonfund employee to the recipient of the presentation. It is Commonfund’s policy that investment recommendations to its clients must be based on the investment objectives and risk tolerances of each individual client. All market outlook and similar statements are based upon information reasonably available as of the date of this presentation (unless an earlier date is stated with regard to particular information), and reasonably believed to be accurate by Commonfund. Commonfund disclaims any responsibility to provide the recipient of this presentation with updated or corrected information or statements. Past performance is not indicative of future results. For more information please refer to Important Disclosures.