The Commonfund Higher Education Price Index® (HEPI) is an inflation index for colleges and universities. It has been calculated since 1983 and includes inflation data going back to 1961. Commonfund Institute assumed responsibility for the HEPI in 2002 and publishes the index and a full report annually in December. In May 2019, the Institute announced that it would begin releasing quarterly estimates, along with occasional regional and cohort reports.
In this article, Commonfund Institute Executive Director, Cathleen Rittereiser explains why and how the HEPI matters to trustees and how they can and should employ it to achieve intergenerational equity.
A singularly important responsibility for a higher education trustee is to ensure that their institution has the financial strength to continue its mission into the future. The most important ways for trustees to carry out that responsibility is to understand and manage costs and to oversee the endowment with a focus on achieving intergenerational equity.
The concept of intergenerational equity was originated by Yale economist James Tobin in 1974. He wrote, “The trustees of endowed institutions are the guardians of the future against the claims of the present. Their task in managing the endowment is to preserve equity among generations.” In investment terms, intergenerational equity is the principle that an endowed institution's spending rate must not exceed its compound return after inflation, so that investment gains are spent equally on current and future constituents of the endowed assets.
Even in a low-inflation investment environment, inflation is a significant risk for endowments because costs will increase and require larger distributions to maintain the same level of services. The nominal return on an investment is the rate at which the dollar value of the investment grows. In contrast, the real return, also known as the inflation-adjusted return, is the rate at which the purchasing power of the dollars will grow. Higher inflation rates lead to larger differences between nominal and real returns. Trustees who seek to support their institution’s mission into the future cannot afford to lose their grip on inflation. Thus they cannot afford to measure and track inflation incorrectly.

— James Tobin, Yale Economist
Is your institution using the right index to measure inflation? What does your institution need to know about inflation indexes? What do you need to do to project future costs accurately and establish appropriate return objectives?
While the consumer price index (CPI) is the index that matters to individuals, it’s not an accurate measure of the consistently higher and idiosyncratic costs colleges and universities must meet and that they must achieve in their endowment returns. The Higher Education Price Index (HEPI) is the only inflation index designed specifically for higher education and is a more accurate and custom-tailored indicator of changes in costs for colleges and universities than the CPI. Besides being a more precise indicator of the factors that contribute to college costs, the HEPI is a far superior tool for keyboard and administrative functions such as projecting the need for budget increases and for determining investment objectives.
In the rest of this article, we describe the HEPI and compare it to the CPI. We explain how most institutions currently use the HEPI for budgeting and forecasting and why trustees need to use it for setting endowment investment objectives. We also provide a way to receive the HEPI information as soon as it is released.
What is the HEPI?
The HEPI is an inflation index, calculated on the July 1–June 30 fiscal year used by most higher education institutions. The HEPI is designed specifically for higher education and may be a more accurate indicator for colleges and universities than the CPI. It is released annually in December accompanied by a full report. Commonfund Institute also releases quarterly estimates and will begin releasing periodic regional and cohort analysis in 2020.
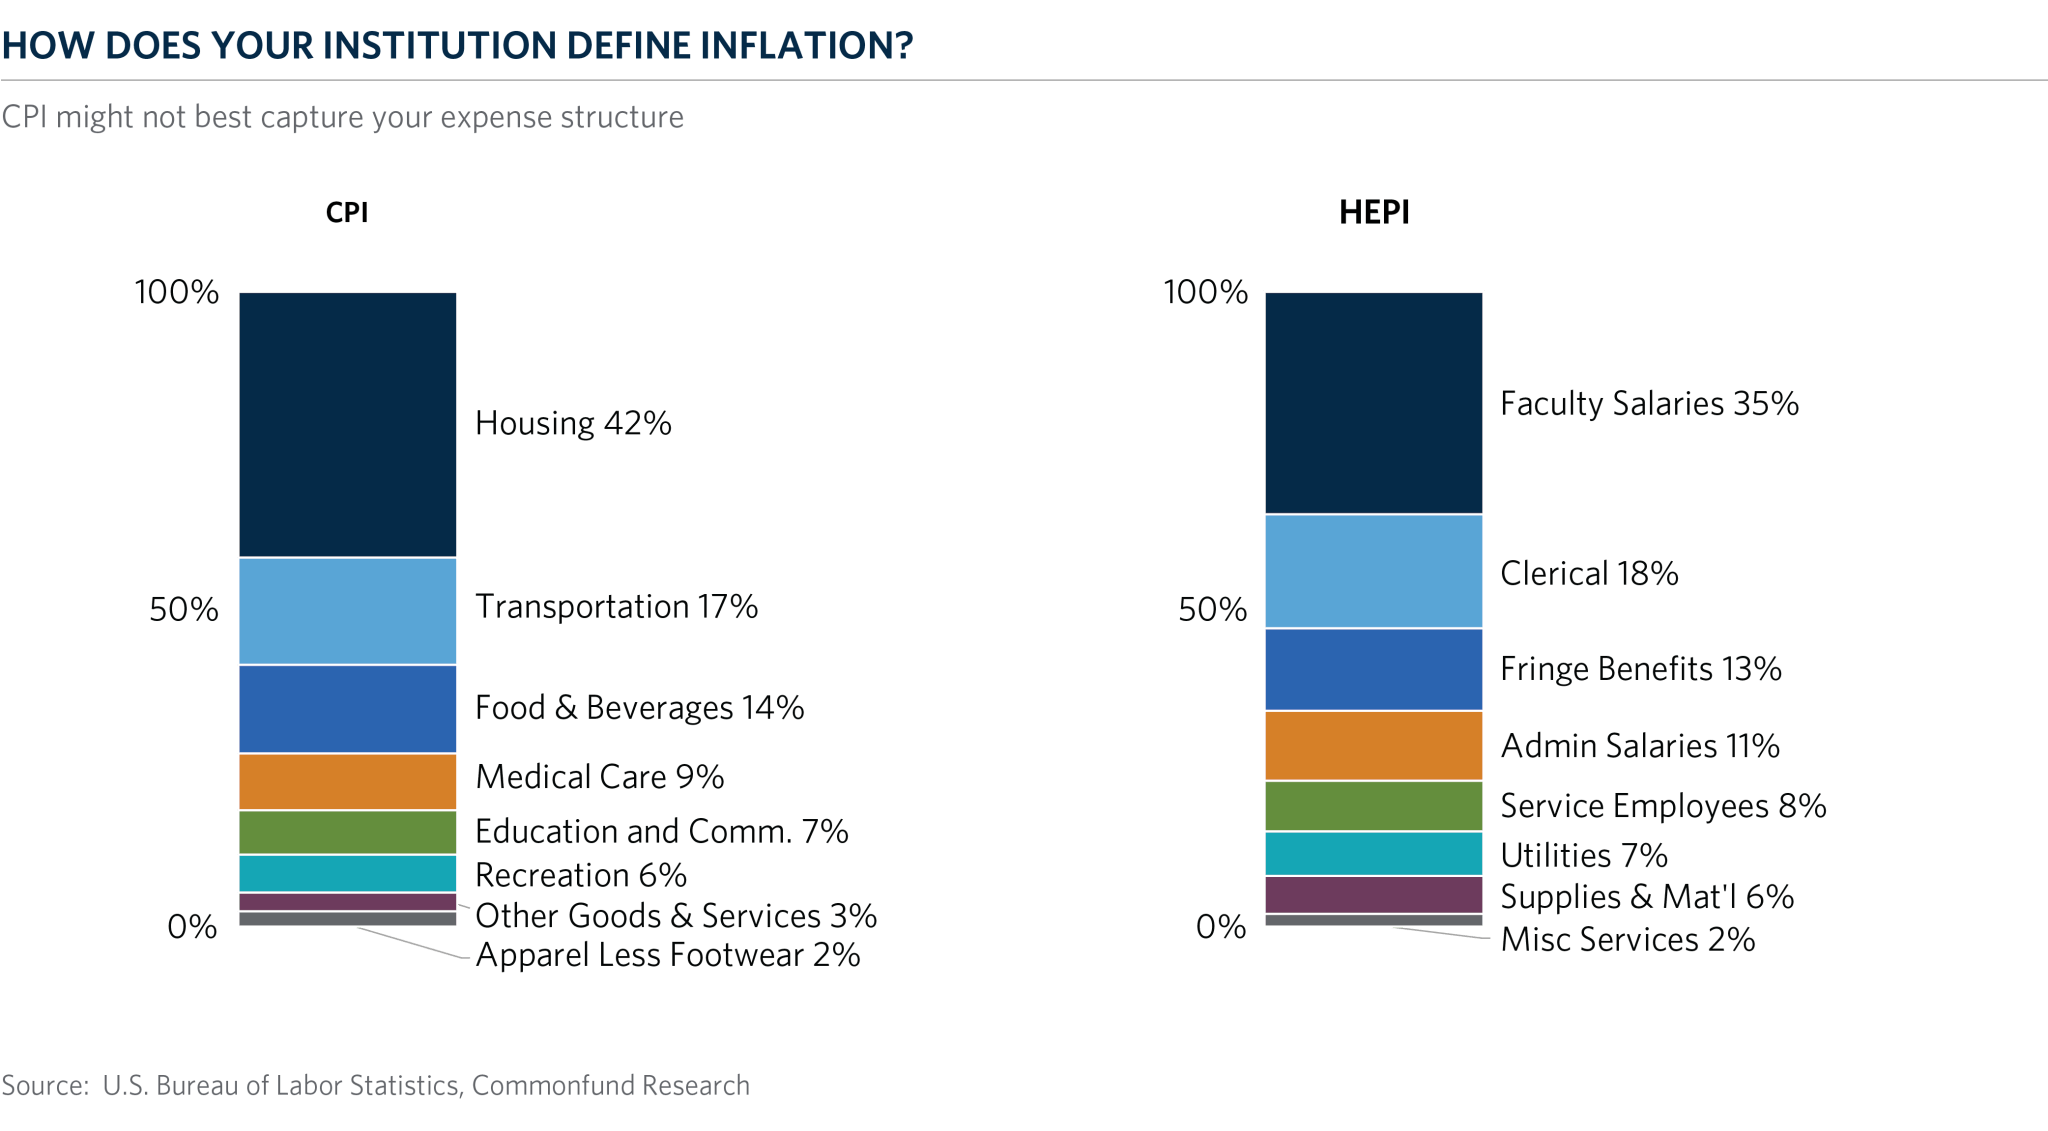
Compiled from data reported by governmental and industry sources, the HEPI measures the average relative level in the prices of a fixed basket of goods and services purchased by colleges and universities each year. The HEPI includes eight components that cover most of the current operational costs of colleges and universities and is an essential tool enabling schools to determine increases in funding necessary to maintain purchasing power and investment. The HEPI components are based on price data for 45 budget components that all schools can report, organized in eight component subindexes: faculty salaries; administrative salaries; clerical salaries; service employee salaries; fringe benefits; miscellaneous services; supplies and materials; and utilities.
How do the HEPI and the CPI Compare?
To appreciate the value of the HEPI, it’s useful to compare it with the CPI. The bulk of educational costs are related to personnel, mainly college faculty, whose salary increases are usually different than the average worker measured by the CPI. For instance, from 1980 to 2000, the price of goods and services purchased by colleges and universities increased by 154 percent while inflation measured by the CPI increased 118 percent.
Another significant difference between the HEPI and the CPI is how the indices treat changes in quality. The HEPI is a straightforward measurement of costs, whereas the CPI is a measure of quality-adjusted prices. For example, let’s say it costs $2,000 to replace an old computer that originally cost $1,500. The new computer, however, is twice as fast as the old one. The HEPI would report that as a $500 increase, while the CPI would report the new computer as a $500 price decrease due to the quality adjustment.
By reporting only price increases, without quality or quantity changes, the HEPI makes it possible for staff to determine the additional revenues needed to continue business as usual. Most trustees and donors would agree that funding should maintain—if not improve—the status quo. Thus price indices such as the HEPI can reliably report increased funding requirements that are essential for the institution to maintain the same level of services.
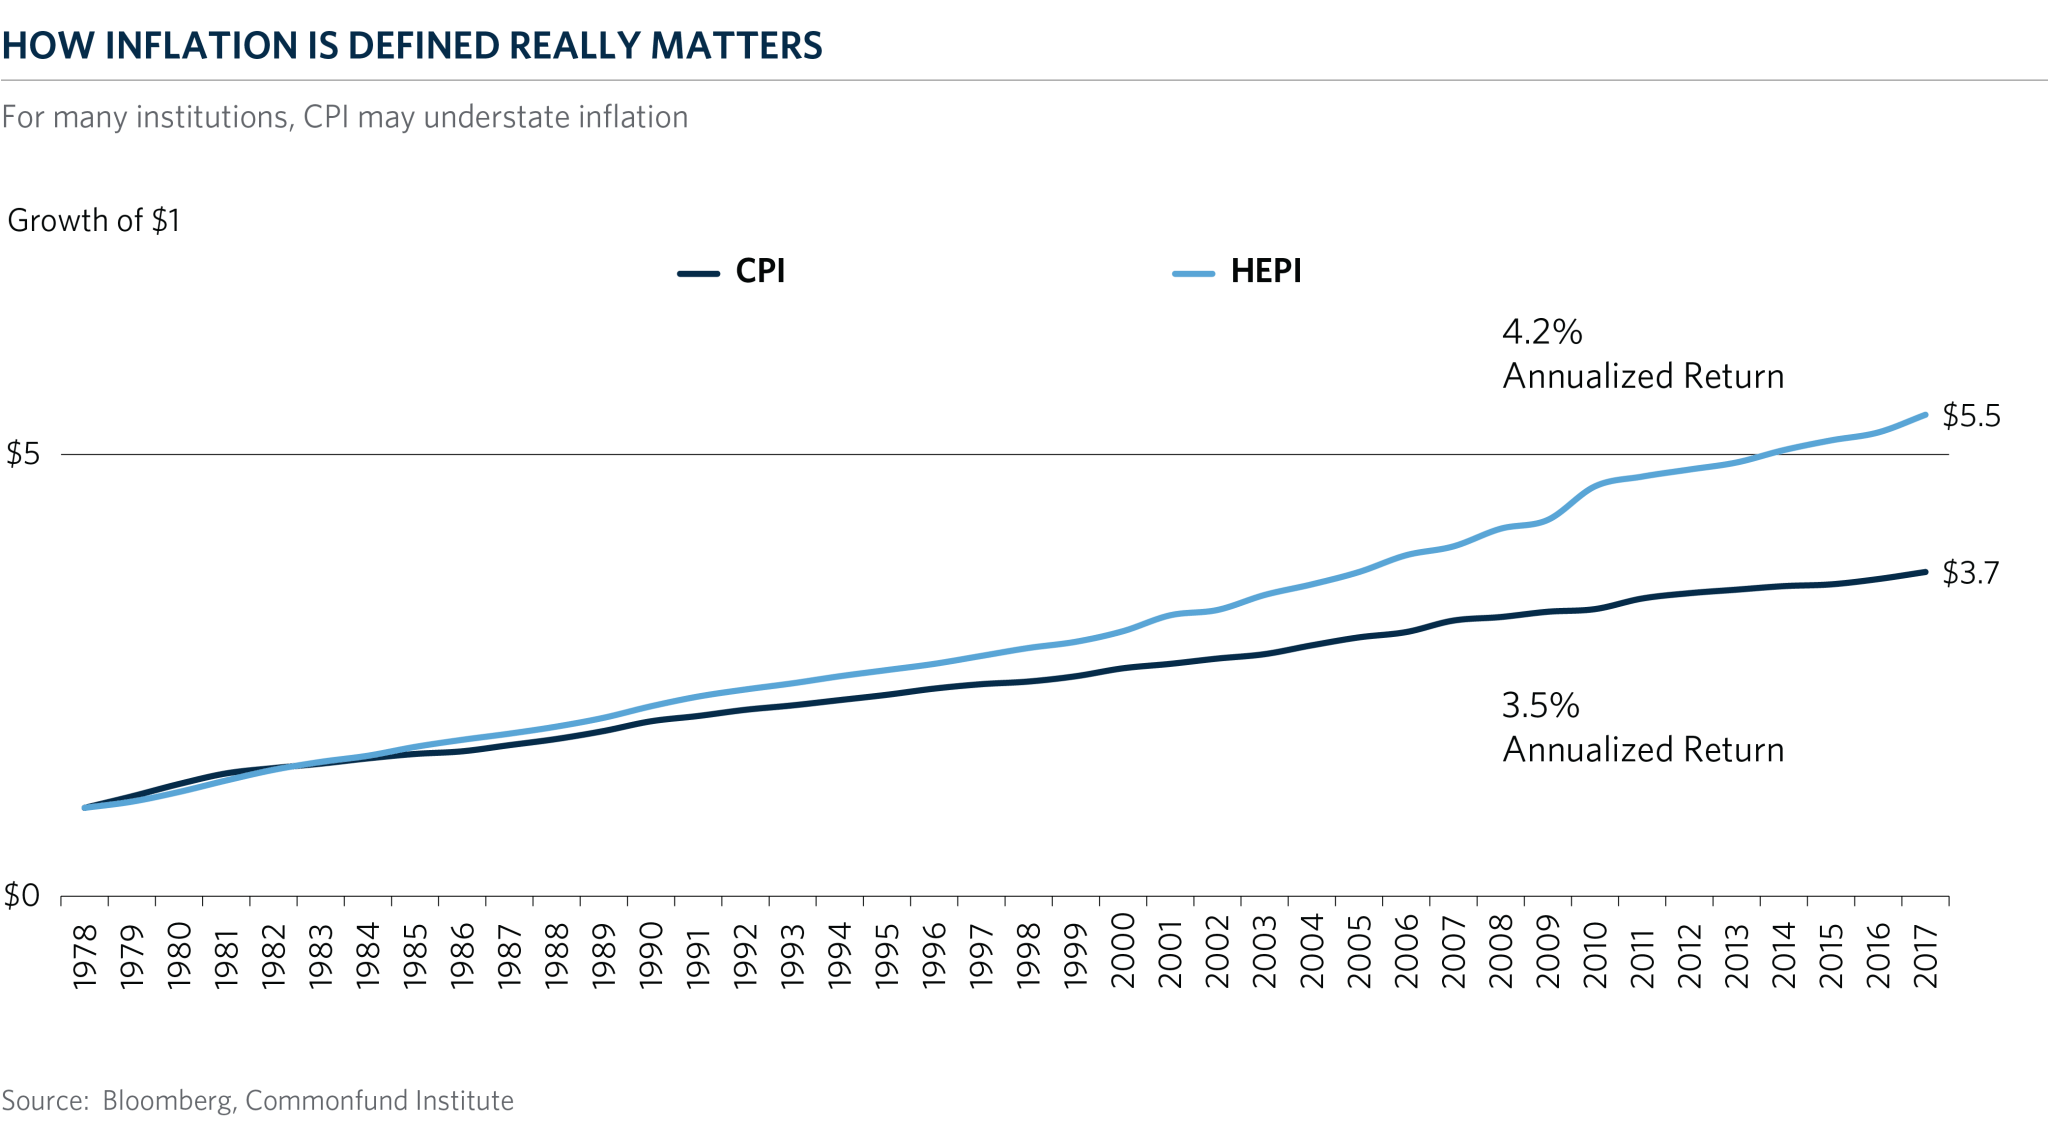
For colleges and universities, how inflation is defined really matters in terms of their ability to meet current and future spending needs as can be seen in the graph below comparing the growth of $1 inflated by the CPI versus the HEPI.
The difference in value between the CPI and the HEPI over time demonstrates that cost increases for higher education historically run at a rate substantially higher than the CPI. It is essential that trustees understand this difference and plan and act accordingly.
How Do Institutions Currently Use the HEPI?
The HEPI is used primarily to project future budget increases required to preserve purchasing power. It is a measure of inflation for current operations, for budget hearings to justify the minimum funding requirements to maintain purchasing power, and a guideline for trends in other expense areas such as faculty salaries. For example, if next year’s inflation is expected to be 3 percent, then the budget must be increased by that amount to purchase the same level and quality of goods and services. The HEPI is a key input when formulating spending policy. Some business officers report that they use regional the HEPI comparisons extensively because costs vary so significantly from region to region.
Why Should Institutions Use the HEPI to Establish Investment Return Targets?
Because trustees and business officers use the HEPI to forecast costs and spending needs in order to formulate endowment spending policy and distribution rates, it follows that the HEPI ought to be used to calculate return objectives. For many institutions and their advisors, the conventional wisdom has been to base return objectives off the CPI. The CPI plus 5 percent, or “CPI plus 5” is a common shorthand expression for the annual return needed to achieve intergenerational equity, to grow the endowment, and maintain purchasing power. Although CPI +5 percent is used widely, we believe it does not capture the expense structure of colleges and universities. And it does not accurately reflect the objectives colleges and universities need to set for themselves, as shown in the graph below.
The HEPI more accurately reflects the costs institutions need to meet and should be a factor not just for planning and budgeting but also for setting investment return targets. For one thing, it is imperative to use consistent indices across the entire enterprise. Since the HEPI is a consistently higher number and used in budgeting and planning, not using the HEPI when setting return targets is likely to result in a mismatch between rising costs and the ability for the investment pool to achieve intergenerational equity over time.
In recent annual reports, Princeton University, Stanford University and Brown University used the HEPI as their inflation index when presenting returns. The Commonfund Institute conducted research with a number of similar institutions and learned that many use the HEPI to set return targets and benchmark their investment performance. Some report that they use the HEPI in their investment process across all asset classes to determine return expectations.
How Can Trustees Benefit from Using the HEPI?
Our research demonstrated the value the HEPI provides to all colleges and universities across the finance department, the investment office, and in the boardroom. We learned of a demand for more frequent HEPI forecasts and more granular data tailored to types of institutions and regions. As a result, Commonfund Institute will be regularly releasing the HEPI estimates throughout the year in order to enable institutions to more accurately plan their future budgets and return expectations in advance of the annual HEPI report published in December. The Institute will introduce regional variants of the HEPI, which will cover nine geographic regions across the United States. The Institute also plans to launch specialized versions of the index for different categories of higher education institutions.
Click here to download the most recent HEPI Report and subscribe to updates and quarterly forecasts.
What Can You Do about the HEPI Today to Prepare for Tomorrow?
We urge trustees to incorporate the HEPI as the primary inflation index in all your institution’s budget forecasting and investment return targeting. Discuss the HEPI with your chief investment officer, outsourced CIO, consultant, and investment committee to determine whether your current investment return targets need to be revised. You should also ask the asset managers in your endowment’s portfolio to use the HEPI as their inflation index when they estimate, calculate, and report returns.
As an intentionally designed inflation measure, the HEPI allows colleges and universities to more accurately plan for the future. Using the HEPI as your inflation index will enable trustees to meet their objectives on the budget side as well as the investment side.
While “HEPI plus 5” does not roll off the tongue so easily today, it will be a lot easier to explain to the students of tomorrow why you made it your investment objective. And the trustees of tomorrow will thank you for it.
© 2020 Association of Governing Boards of Universities and Colleges. Reprinted with permission. This was originally published in the January/February 2020 issue of Trusteeship magazine, published by the Association of Governing Boards of Universities and Colleges.
Sources
The Impact of Inflation on Endowment Assets. Research in Higher Education Journal Kathryn Birkeland, University of South Dakota, David L. Carr University of South Dakota, Angeline M. Lavin University of South Dakota https://files.eric.ed.gov/fulltext/EJ1064696.pdf
https://en.wikipedia.org/wiki/Intergenerational_equity
