The Misperception of Illiquid Investments

May 15, 2017 |
4 minute read
|

With many market participants expecting low nominal returns across traditional asset classes in the coming years, the challenge of structuring a portfolio to achieve CPI +5%, or long-term purchasing power, has become even more formidable for investment committees and chief investment officers.

As part of the solution, these investors may be looking to increase their exposure to illiquid asset classes such as private equity and venture capital. The hope of capturing a liquidity premium, however, is offset by the fact that investors must enter into illiquid investment structures and therefore requires an evaluation of whether locking up capital for 10-plus years is ‘worth it.’

The answers to this question include the possibility of achieving excess return over more liquid, efficient investment strategies as well as the potential diversification benefit of investing in a universe of smaller companies not available in the public market.

Many, including Commonfund, have written about and demonstrated that, historically, a “liquidity premium” has existed in the past. Moreover, we believe it will continue to exist in the future. The potential for premium returns, however, is not the subject of this article.

Instead, we address head-on investors’ misperception about illiquid investments: they aren’t as illiquid as many fear.

For the purposes of this article, we focus on private equity, an investment strategy generally structured as 10- to 12-year partnerships. As such, there is a perception that investors lock up their capital for more than a decade. The reality is that capital is only exposed (i.e., illiquid) for a portion of that time. An investor commits to providing capital for 12 years, yet much of that commitment remains undrawn over the life of the investment.

At Commonfund Capital, for example, we typically commit to underlying private equity managers over a two- to three-year period following the final close of one of our funds. Our managers then call capital to invest in portfolio companies over an average period of three to six years. We structure our funds with a 12-year term in order to cover the full life cycle of those underlying manager investments.[1] However, each underlying company (and the resulting distribution) will, on average, have a much shorter lifecycle, as illustrated below.
img-chart-illiquid-2017

Lock-up Time: A Case History

In order to determine how long private equity dollars are exposed to the market, we quantified the capital call and distribution pace for a fund-of-funds program using several different methods. We selected a U.S.-focused private equity fund-of-funds as a representative fund for our analysis. This fund was formed in January 2000 as the fourth in a series of multiple-manager, U.S. private equity programs. The fund received $452.2 million in capital commitments from investors. The fund made commitments to 16 private equity managers and has called approximately $441.3 million, or 98 percent of investor commitments to date. As of March 31, 2017, the fund had distributed $874.7 million to investors, or approximately 2.0x invested capital. We selected this fund since it was formed in the 2000s and has experienced a full private equity life cycle. Of course, past performance does not guarantee future results. This analysis is for illustrative purposes only, and does not necessarily represent the actual returns an investor may have received.

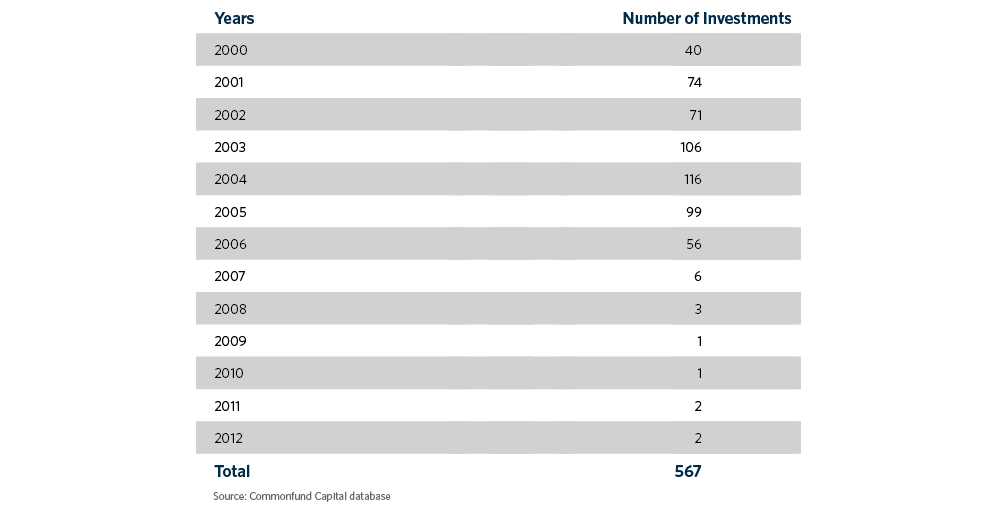
First, we looked at the average age of fully realized companies in the fund. The underlying managers in the fund invested in 576 portfolio companies with the majority of those investments made between 2001 and 2005. Approximately 480 investments in the portfolio were fully realized as of September 30, 2016, with the average time between initial investment and final exit date of those 480 realized companies being 5.7 years.
img-table-1-illiquid-2017

Time Between Capital Call and Distribution

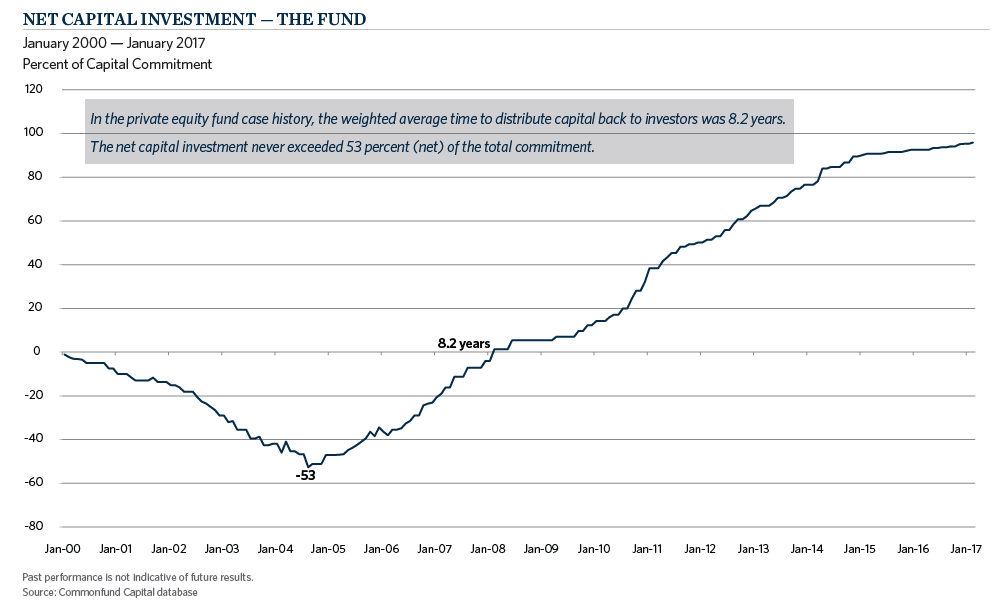
Second, we calculated a duration of the weighted average cash flows, using monthly data for the U.S. private equity program. The fund called capital from investors between January 2000 and August 2007. The average time it took to call capital, weighted by the size of the capital call, was 4.0 years. The fund first distributed capital back to investors in December 2000. The average time it took to distribute capital back to investors, weighted by the size of the distribution, was 8.2 years. The delta between the average capital call and distribution duration was 4.2 years, demonstrating that the dollar-weighted average time between capital being invested and capital being distributed is substantially less than half of the 12-year term of the fund.

The fund began distributing capital back to investors while continuing to make new commitments to managers and also making capital calls. The “net capital investment,” or percentage of investors’ capital invested, never exceeded 53 percent of the total commitment amount over the life of the fund when netted against distributions.


...the actual time investors’ capital is locked up may be less than half of the 12-year life of a typical private capital partnership.

Return Goal On Cash Invested

Finally, we considered the average time for each capital call to achieve a return of 1.8x to investors, which is our goal for return multiples on our private equity strategies. For this analysis, we assumed the capital committed in the first capital call was returned as the first distribution, much like a first-in-first-out, or “FIFO,” calculation where the first dollar invested is the first dollar distributed. (We note that this would not always be the case as investment time periods vary widely by company.) Using this assumption, we calculated that each dollar invested returned $1.80 (1.8x) in cash back to investors within an average of 4.6 years (weighted by dollars called).

As our analysis demonstrates, it can take approximately four to five years for companies to become fully realized and capital distributed. Below is a table summarizing results of our analyses.

img-table-2-illiquid-2017

Conclusion

When considering their illiquidity budget and liquidity needs, institutional investors should understand the true illiquidity of a private capital program. The data cited here provides evidence that the actual time investors’ capital is locked up may be less than half of the stated 12-year life of a partnership. We also note that the private equity industry has evolved since the 2000s and more modern private equity portfolios utilize more capital efficient strategies such as secondaries and co-investments into the portfolio construction mix. These secondary transactions and co-investments have a tendency to return capital sooner and potentially shorten the overall life of a thoughtfully designed private equity investment program.

In the private equity fund case history, the weighted average time to distribute capital back to investors was 8.2 years. The net capital investment never exceeded 53 percent (net) of the total commitment.

This article was originally published in Insight Online in the Fall 2013 issue titled as “What? Me, Illiquid”.

  1. The life cycle of a manager’s investment generally has the following components: sourcing and performing due diligence on an investment; providing initial funding; transforming the company through value creation activities (such as growing revenues through adding product lines and geographic expansion, making strategic acquisitions, etc.); sometimes committing follow-on funding; harvesting/selling the company; and making a distribution back to investors.
Timothy T. Yates, Jr.

Author

Timothy T. Yates, Jr.

President and CEO, Commonfund OCIO

Disclaimer

Certain information contained herein has been obtained from or is based on third-party sources and, although believed to be reliable, has not been independently verified. Such information is as of the date indicated, if indicated, may not be complete, is subject to change and has not necessarily been updated. No representation or warranty, express or implied, is or will be given by The Common Fund for Nonprofit Organizations, any of its affiliates or any of its or their affiliates, trustees, directors, officers, employees or advisers (collectively referred to herein as “Commonfund”) or any other person as to the accuracy or completeness of the information in any third-party materials. Accordingly, Commonfund shall not be liable for any direct, indirect or consequential loss or damage suffered by any person as a result of relying on any statement in, or omission from, such third-party materials, and any such liability is expressly disclaimed.

All rights to the trademarks, copyrights, logos and other intellectual property listed herein belong to their respective owners and the use of such logos hereof does not imply an affiliation with, or endorsement by, the owners of such trademarks, copyrights, logos and other intellectual property.

To the extent views presented forecast market activity, they may be based on many factors in addition to those explicitly stated herein. Forecasts of experts inevitably differ. Views attributed to third-parties are presented to demonstrate the existence of points of view, not as a basis for recommendations or as investment advice. Market and investment views of third-parties presented herein do not necessarily reflect the views of Commonfund, any manager retained by Commonfund to manage any investments for Commonfund (each, a “Manager”) or any fund managed by any Commonfund entity (each, a “Fund”). Accordingly, the views presented herein may not be relied upon as an indication of trading intent on behalf of Commonfund, any Manager or any Fund.

Statements concerning Commonfund’s views of possible future outcomes in any investment asset class or market, or of possible future economic developments, are not intended, and should not be construed, as forecasts or predictions of the future investment performance of any Fund. Such statements are also not intended as recommendations by any Commonfund entity or any Commonfund employee to the recipient of the presentation. It is Commonfund’s policy that investment recommendations to its clients must be based on the investment objectives and risk tolerances of each individual client. All market outlook and similar statements are based upon information reasonably available as of the date of this presentation (unless an earlier date is stated with regard to particular information), and reasonably believed to be accurate by Commonfund. Commonfund disclaims any responsibility to provide the recipient of this presentation with updated or corrected information or statements. Past performance is not indicative of future results. For more information please refer to Important Disclosures.

Stay connected with the Insights Blog

Popular Articles


Investment Strategy | Articles

Challenges of Nonprofit Healthcare Organizations and Endowment Management

Facing cost pressures and a new regulatory regime, healthcare organizations — especially those in the small and mid-sized range — should consider adopting the principles of the endowment model....
Diversity | Articles

Affirmative Action: Implications for Endowments, Foundations, and the Broader Industry

Affirmative action, a practice used since the 1960s to edge toward equity and address historical and ongoing injustice through higher education attainment, was struck down last month by the Supreme...
Investment Strategy | Articles

Viewpoint | The Yin and Yang of Risk and Return

The conundrum of risk and return is that you can’t have one without the other. The key is finding the right balance for your foundation.

Disclaimer

Certain information contained herein has been obtained from or is based on third-party sources and, although believed to be reliable, has not been independently verified. Such information is as of the date indicated, if indicated, may not be complete, is subject to change and has not necessarily been updated. No representation or warranty, express or implied, is or will be given by The Common Fund for Nonprofit Organizations, any of its affiliates or any of its or their affiliates, trustees, directors, officers, employees or advisers (collectively referred to herein as “Commonfund”) or any other person as to the accuracy or completeness of the information in any third-party materials. Accordingly, Commonfund shall not be liable for any direct, indirect or consequential loss or damage suffered by any person as a result of relying on any statement in, or omission from, such third-party materials, and any such liability is expressly disclaimed.

All rights to the trademarks, copyrights, logos and other intellectual property listed herein belong to their respective owners and the use of such logos hereof does not imply an affiliation with, or endorsement by, the owners of such trademarks, copyrights, logos and other intellectual property.

To the extent views presented forecast market activity, they may be based on many factors in addition to those explicitly stated herein. Forecasts of experts inevitably differ. Views attributed to third-parties are presented to demonstrate the existence of points of view, not as a basis for recommendations or as investment advice. Market and investment views of third-parties presented herein do not necessarily reflect the views of Commonfund, any manager retained by Commonfund to manage any investments for Commonfund (each, a “Manager”) or any fund managed by any Commonfund entity (each, a “Fund”). Accordingly, the views presented herein may not be relied upon as an indication of trading intent on behalf of Commonfund, any Manager or any Fund.

Statements concerning Commonfund’s views of possible future outcomes in any investment asset class or market, or of possible future economic developments, are not intended, and should not be construed, as forecasts or predictions of the future investment performance of any Fund. Such statements are also not intended as recommendations by any Commonfund entity or any Commonfund employee to the recipient of the presentation. It is Commonfund’s policy that investment recommendations to its clients must be based on the investment objectives and risk tolerances of each individual client. All market outlook and similar statements are based upon information reasonably available as of the date of this presentation (unless an earlier date is stated with regard to particular information), and reasonably believed to be accurate by Commonfund. Commonfund disclaims any responsibility to provide the recipient of this presentation with updated or corrected information or statements. Past performance is not indicative of future results. For more information please refer to Important Disclosures.