Some foundations have responded to the call of mission by increasing spending in response to exceptional needs created by COVID-19. But there is a trade-off: the potential erosion of endowment value over the long term. We surveyed what foundations are doing now and modeled potential future implications of higher spending today.
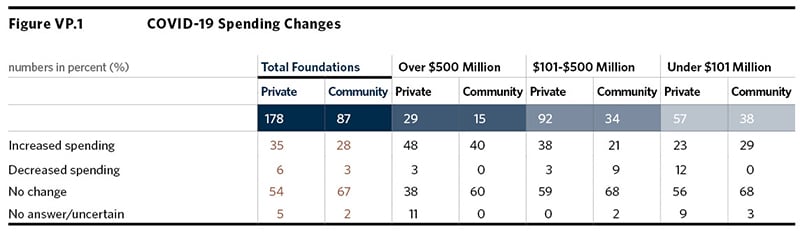
With the coronavirus pandemic exploding into a worldwide healthcare and economic crisis, we followed up our questionnaire about 2019—the focus of the 2019 Council on Foundations–Commonfund Study of Investment of Endowments for Private and Community Foundations®—with a question about an action related to 2020: What changes has your foundation made to spending in response to the virus? Most respondents reported holding their effective spending rate steady: fifty-four percent of private foundations and 67 percent of community foundations said that at the time of taking the survey they had made no change to their spending rate in response to the pandemic.
Among foundations changing their spending rate, those reporting increases were well in excess of those reporting decreases. Thirty-five percent of private foundations and 28 percent of community foundations reported increasing their spending rate; just 6 percent of private foundations. Among community foundations, 28 percent said they increased their spending rate compared with just 3 percent reporting they decreased it. (Five percent of private foundations and 2 percent of community foundations gave no answer or were uncertain.)
As the accompanying table shows, 48 percent of private foundations with assets over $500 million reported increasing their spending rate, while just 3 percent decreased it. In the same size cohort, 40 percent of community foundations said they increased their rate, 60 percent held it steady and none reduced it. As data in the table show, the majority of respondents in the other two size cohorts reported no change.
We should note that the question about 2020 spending asked respondents to report any spending changes they had already made at the time of taking the survey related specifically to the COVID-19 pandemic, not any changes they planned to make going forward. A complementary study conducted by the Council on Foundations, Philanthropy California and Dalberg Advisors looked at what changes in giving foundations plan to make as a result of 2020’s compounding crises of COVID-19 and racial justice. To see the results of that study, please see Shifting Practices, Sharing Power? How the US Philanthropic Sector is Responding to the 2020 Crises.
Today’s Need … and Tomorrow’s
A commitment to increase spending in the face of a crisis without precedent in living memory is laudable and consistent with the missions of a great many foundations participating in the Study. At the same time, it raises questions about intergenerational equity: How will stepping up to an immediate need today impact the ability to respond to a crisis in the future? What is the likelihood that higher spending today—even if temporary—will diminish future endowment value and thus future spending?
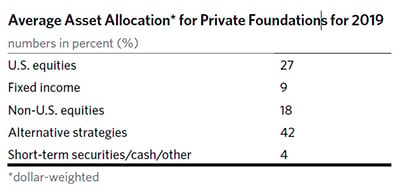
We sought answers to these questions by creating models based on various spending scenarios, and using the actual asset allocations as reported by private foundations participating in this year’s Study (shown in the table below) – with the assumption of maintaining intergenerational equity. We chose to concentrate our analysis on private foundations because they generally do not engage in fund-raising and, instead, rely upon the founder’s (or founders’) original endowment. Community foundations choosing to elevate their spending levels in response to COVID-19 may decide to support that increase through fund-raising, and thus may not have to increase their draw
on existing endowment assets.
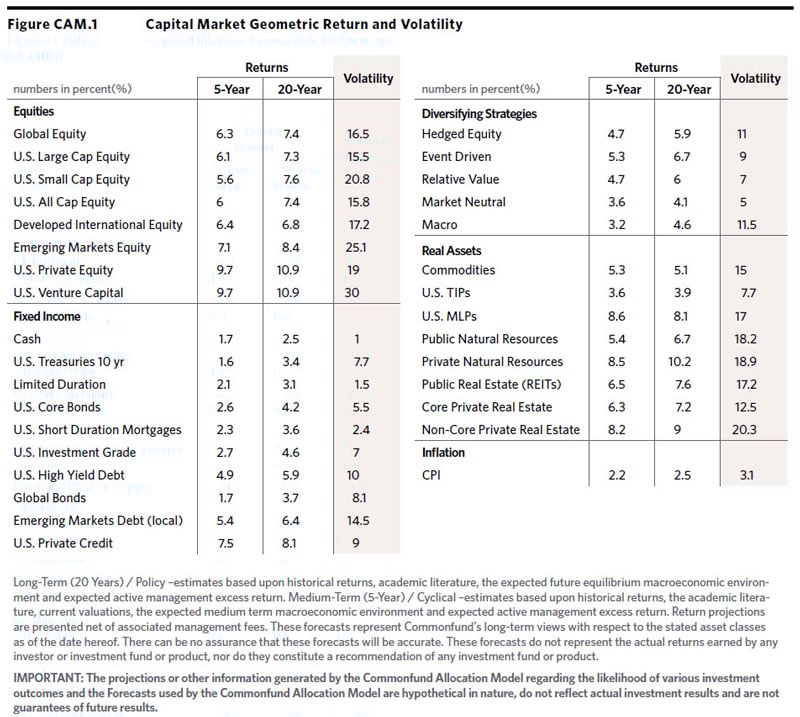
 We used the Commonfund Allocation Model (CAM) to analyze the effects of the various spending scenarios over a 20-year period. The CAM creates Monte Carlo simulations based on user forecasts for returns, volatility and correlation (and, in this case, spending) and runs these simulations for the time period specified. Analyzing the distribution of thousands of data points, the CAM can calculate model annualized returns, medians, standard deviations, market values and percentiles for different outcomes for entire portfolios.1 The CAM model is one of many models used to forecast spending scenarios and the information below is based on certain assumptions. Each foundation making spending decisions should use models that take their specific circumstances into account.
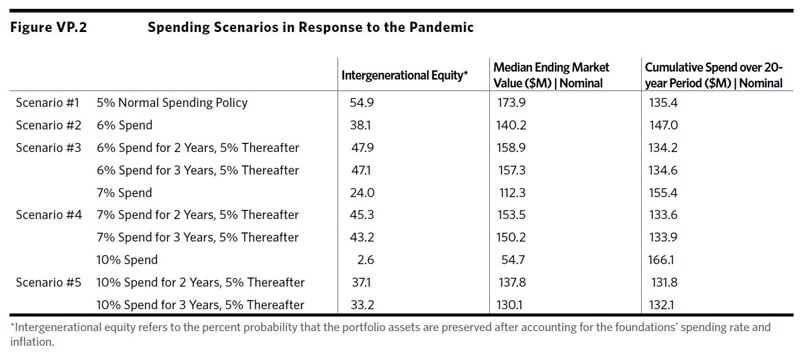
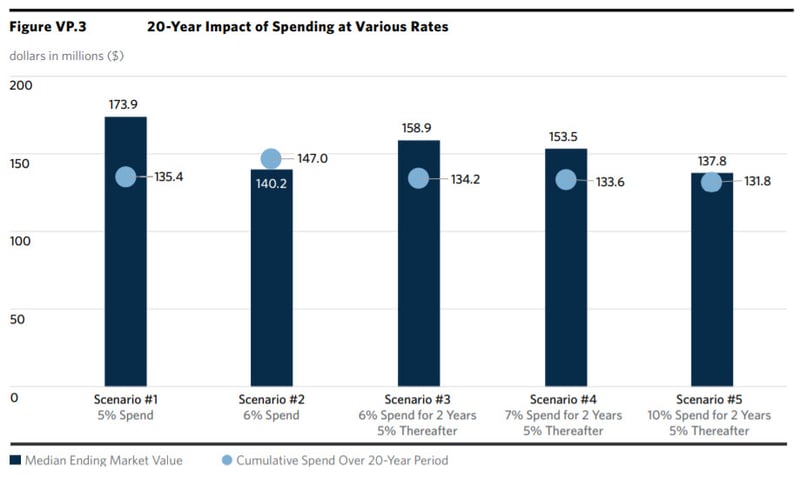
Figure VP.2 shows how the CAM projects the 20-year outcomes of spending at various levels—with an assumption of wanting to maintain intergenerational equity. A closer look at five of these scenarios illustrates the trade-off between spending rates and preservation of endowment values as well as the size of the fund after 20 years and total dollars distributed (these five scenarios are shown graphically in Figure VP.3).
Scenario #1
A foundation with a $100 million endowment has a policy of spending 5 percent of a moving three-year average of endowment value. At that effective spending rate, the model calculates a 54.9 percent chance of maintaining the endowment’s value in real terms over 20 years or "intergenerational equity." The median ending market value is projected to be $173.9 million and the cumulative spending over that 20-year period is projected to total $135.4 million.
Scenario #2
If the same foundation increased its spending policy to 6 percent for the entire period, there is only a 38.1 percent chance of maintaining purchasing power over 20 years. Although the cumulative spend rises to $147.0 million, the median ending market value of the endowment increases only to $140.2 million, as compared to the $173.9 million median market value in the 5 percent spend scenario.
Scenario #3
What if the foundation with a 5 percent spending policy decided to increase its spending rate to 6 percent for two years and then revert to the normal 5 percent spend for the remainder of the time period? In this case, there is a 47.9 percent likelihood of achieving intergenerational equity. The median ending market value of the endowment would be $158.9 million and cumulative spending would total $134.2 million. (Compare this to Scenario #1. How is it that spending more for the first two years results in a lower cumulative spend than a level 5 percent over the 20-year period, i.e., $134.2 million versus $135.4 million? Because spending more for two years reduces the amount available to compound over the remaining 18 years.)
Scenario #4
An approach that may strike a balance between immediate needs and long-term capital preservation is spending 7 percent for two years and returning to the 5 percent spending policy thereafter. In this case, there is a 45.1 percent probability of maintaining endowment purchasing power. Spending would total $133.6 million and the median ending market value would be $153.5 million.
Scenario #5
A foundation may feel that needs stemming from the pandemic are serious enough to double spending to 10 percent for two years before reverting to the 5 percent policy rate thereafter. In this case, the foundation is spending off an ever-smaller base and the chance of achieving intergenerational equity after 20 years is only 37.1 percent. Moreover, this leads to the smallest cumulative spend over the entire time period, $131.8 million, of all the scenarios modeled.
Conclusion
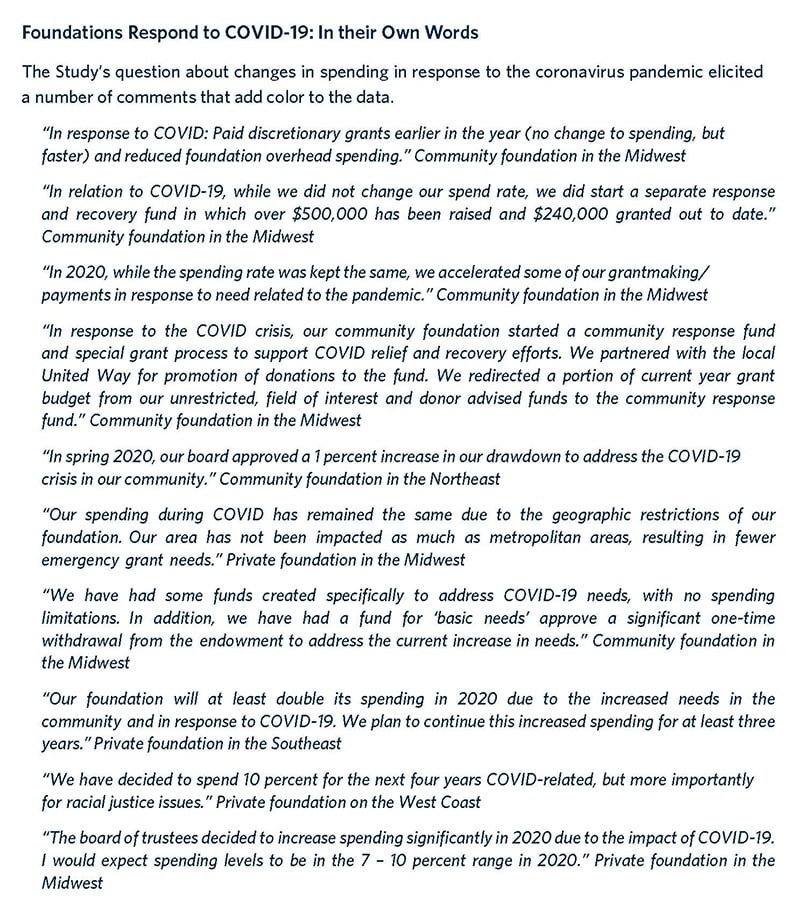
There is no right or wrong approach to any of these spending scenarios. Foundations are in business to fulfill their mission and exceptional circumstances may mandate an exceptional response. However, understanding the trade-offs with the help of models or scenario analyses can be helpful.2 The verbatim comments submitted by Study respondents that accompany this Viewpoint clearly substantiate the human commitment felt by many foundations (the verbatim comments are drawn from community foundations as well as private foundations to provide a representative sample of responses).
In the final analysis, decisions such as these are the essence of strategic governance…what trustees should focus on as they guide their foundations into an uncertain future. Today’s COVID-19 pandemic, coupled with continued calls for racial justice, indeed represents more than one crisis. But what of the next crisis…what, when, where and how severe? A natural disaster? Another pandemic? Does meeting today’s need compromise the ability to meet tomorrow’s? The future is unknowable—but thinking about it long and hard can only lead to better decisions. To help facilitate these important strategic conversations, we have provided the following additional resources.
Additional Resources
Balancing Purpose, Payout, and Permanence: Strategy Guide: National Center for Family Philanthropy and Council on Foundations
- No financial model or simulation can predict the future or account for the infinite number of possible outcomes in forecasting investment returns or risks.In order to assess the predictive value of any forecast, one should seek to understand the underlying assumptions and information that are used to generate the forecast. The results of CAM will vary with any change to the inputs: asset allocation, spending rates or methods, contributions, or beginning market value. The results will also change with any periodic updates to the model starting point. Because the model uses asset class returns, it is not intended to evaluate or simulate the results of any specific investment program offered by Commonfund. The assumptions used for these models can be found here. These simulations and the assumptions used are just one of many ways to model scenarios to help with spending decisions and the scenarios presented here are not meant to represent definitive or absolute ways in which to model these scenarios. Important notes pertaining to the CAM tool used to model these scenarios can also be found here.
- The assumptions used for these models can be found here. These simulations and the assumptions used are just one of many ways to model scenarios to help with spending decisions and the scenarios presented here are not meant to represent definitive or absolute ways in which to model these scenarios. Important notes pertaining to the CAM tool used to model these scenarios can also be found here.
Commonfund Allocation Model Important Notes
WHAT IS THE COMMONFUND ALLOCATION MODEL?
The Commonfund Allocation Model (the “CAM”) is a custom application of Windham Portfolio Advisor® application. The CAM is a financial simulation tool that can help investors understand possible outcomes and potential risks of an investment strategy and the interrelationships of the underlying asset classes comprising that investment strategy. The CAM produces a potential distribution of returns for the subject investment strategy. The returns depicted by the output of the CAM are hypothetical and do not represent the actual returns earned by any investor or investment fund or product. The CAM output should not be treated as a recommendation concerning any specific investment or asset class, or any mix thereof, or as a tool that can predict specific investment outcomes. The CAM does not guarantee or assure any future investment results.
HOW DOES THE CAM WORK?
The CAM creates Monte Carlo simulations based on user inputted forecasts for returns, volatility and correlation. The model runs these simulations for the time period specified by the user. Every simulation describes a potential future trajectory of the economy. The projections generated by the CAM are based on assumptions about performance and risk characteristics of various asset classes that may prove to be incorrect. Analyzing the distribution of thousands of returns, the model can derive statistical summaries including medians, standard deviations and percentiles for different outcomes for each asset class. With 20 year projections, Commonfund can calculate model annualized returns, medians, standard deviations, market values, and percentiles for different outcomes for entire portfolios over 5-year, 10-year, 15-year, and 20-year time periods. These returns allow Commonfund to see the effects of compounding, in terms of both return and risk, as well as examine the “tail risk” of the distribution. Where applicable, spending policies, gifts, and capital campaigns are important considerations in decision-making and are also incorporated into the model.
UNDERLYING ASSUMPTIONS OF FORECASTS
All simulations rely upon certain forecasts for expected returns, volatility and correlation. The forecasts employed in the CAM are based on Commonfund’s expectations about performance and risk characteristics of various asset classes, which are derived from historical data, academic and professional literature, and the judgment of Commonfund investment personnel. The reasonableness of the input assumptions (including asset allocations, inflation expectations, spending policies, capital gifts and rebalancing rules) made by Commonfund determines to a significant degree the reasonableness of the forecasts. For example, the forecasts take into consideration historical returns from periods experiencing interest rate environments that may be considerably different from future interest rate environments; or, the forecasts project excess returns for active strategies as compared to passive strategies, which Commonfund believes is a reasonable expectation but may or may not be realized in the future. Commonfund cannot guarantee the accuracy of the information it used in generating the forecasts, nor does it represent that the information used will necessarily represent market conditions in the future. In all cases, the statistical confidence in the predictions falls as the simulation period gets shorter.
INDICES
The process of forecasting long and medium term asset class return begins with the selection of a representative index for each asset class. An index is a hypothetical measure of performance based on the ups and downs of securities that make up a particular market. An index does not show actual investment returns or reflect payment of management or brokerage fees, which would lower the index's performance. Commonfund analyzes the historical characteristics of all appropriate indices and selects the one whose composition and factor exposures most closely resembles the asset class under consideration. Data may go back as far as 1970 for certain indices but only as recently as 1996 for newer indices. Where no representative index exists, Commonfund have used historical data from Commonfund's experience as an investor in that particular asset class (e.g. natural resources). Representative indices help the forecasting process for all relevant CAM inputs, including returns, volatility and correlation. Indices are also used in instances where portfolios are designed to include passive investments and to assess the value added from active management.
The blended return of a portfolio of indices is based on historical performance and is provided for illustrative purposes only. It does not necessarily represent the actual performance of any investor, or an investment recommendation. The goals, risk tolerance and circumstances of each investing institution should be taken into account in determining whether any such blended investment might be appropriate for it. In addition, the reader should be aware that the assumption underlying these returns - namely, that the investor maintained a steady allocation among the indices and rebalanced annually - is artificial in that it does not take into account changes that might be made in response to significant market events, etc. The depicted performance is also based on an assumption that the investor is not being charged any asset allocation or overall portfolio fee.
RISK REPORTING
The projected portfolio return, volatility and value at risk outputs from the CAM tool, if any, are used solely for illustration, measurement or comparison purposes and as an aid or guideline for prospective investors to evaluate a particular investment strategy. The outputs reflect a variety of factors including, among others, investment strategy, portfolio composition, prior performance of selected asset classes, volatility measures and market conditions. Volatility and performance will fluctuate, including over short periods, and should be evaluated over the time period indicated and not over shorter periods. Performance targets or objectives should not be relied upon as an indication of actual or projected future performance. Actual volatility and returns will depend on a variety of factors including overall market conditions and the ability of the investment manager to implement the investment strategy and reasonably manage the inherent risk. No representation is made that these targets or objectives will be achieved, in whole or in part, by any investment product.
FORECASTS MAY NOT COME TRUE
No financial model or simulation can predict the future or account for the infinite number of possible outcomes in forecasting investment returns or risks. In order to assess the predictive value of any forecast, one should seek to understand the underlying assumptions and information that are used to generate the forecast.
THE RESULTS OF FORECASTS WILL VARY
The results of the CAM will vary with any change to the inputs: asset allocation, spending rates or methods, contributions, or beginning market value. The results will also change with any periodic updates to the model starting point. Because the model uses asset class returns, it is not intended to evaluate or simulate the results of any specific investment program offered by Commonfund.
FORECASTS USE ESTIMATED FEES AND EXPENSES
Commonfund’s forecasts are based on projected returns net of all fees. These net returns reflect Commonfund’s projections for active management returns in excess of both the benchmark and active manager fees. In the case of an actual investment portfolio, fees and expenses may deviate from those projected by Commonfund. To the extent that returns exceed benchmarks for investments that incur incentive fees, fees may be higher. Alternatively, managers in a specific investor portfolio may be different from those employed in the simulation.
INVESTMENT RISKS
The investment asset classes used in the CAM involve varying degrees of investment risk. Alternative assets in particular may involve reduced liquidity and risky investment strategies. Investors in any of these asset classes could lose some or all of their principal. In particular cases (including investments on margin, short selling and similar strategies), investors could lose more than their principal investment.
GENERAL GUIDE, NOT SPECIFIC ADVICE
Monte Carlo simulations do not replicate the investment experience of an investor. As such, the results of the CAM should only be used as a general guide. In no way should the CAM be a substitute for the important policy choices that an investor must make in developing its investment program.
HOW DOES THE CAM COMPARE TO OTHER FORECASTING MODELS?
A traditional mean variance optimization model uses historical-based inputs and/or user inputs to produce an efficient frontier along which reside optimal portfolios for a given expected return and standard deviation. Monte Carlo simulation, in contrast, generates distributions for projected returns and risks. With this type of analysis, the user is able to analyze the likelihood of achieving goals rather than merely focusing on a mean and standard deviation of an “optimal” portfolio produced by a mean variance optimization. Although no analytical tool can completely replace informed professional judgment, the CAM can provide a foundation on which to base that judgment.
KEY TERMS
Frequency distribution: shows the number of observations within the ranges as defined by the horizontal axis.
Directional hedge strategies: an investing strategy that consists of a core holding of long equities hedged at all times with short sales of stocks and/or stock index options.
Depending on the mix of long and short positions the portfolio may have either a long or short bias. Not necessarily providing complete market neutrality, there will be some movement with the market.
Relative value strategies: an investing strategy that typically targets some kind of absolute-return objective, without reference to any market index and emphasizes capital preservation and risk control. Examples of these strategies include arbitrage strategies (e.g. convertible, fixed income and statistical) as well as credit strategies.
Mean variance optimization: a quantitative asset allocation technique that creates optimal portfolios using return, risk and correlation forecasts that maximize return for different levels of risk. A graph of all optimal portfolios is called the efficient frontier.
Percentile: a value on a scale of one hundred that indicates the percent of a distribution that is equal to or below it.
Standard deviation: a statistical measure of the degree to which an individual value in a probability distribution tends to vary from the mean of the distribution; the larger the standard deviation, the greater the degree of dispersion around the average value.
Daily/monthly/quarterly liquidity: investment purchases and/or redemptions may be transacted once per day, month or quarter.
Illiquid: investment programs (e.g. limited partnerships) in which redemptions may be transacted only at liquidation of the investment program, typically after a number of years.
HEPI: Higher Education Price Index.
CPI: Consumer Price Index.
Market Beta: a measure of the volatility of a portfolio in comparison to a particular market as a whole (i.e. the S&P 500, Barclays US Aggregate Bond Index, etc.).
Sharpe Ratio: A risk-adjusted measure calculated using standard deviation and excess return to determine reward per unit of risk. A greater Sharpe Ratio indicates better historical risk-adjusted performance.
Value at Risk: measures the left tail risk of a distribution, calculated by estimating the probability of portfolio losses based on a confidence level of 95%. Larger Value at Risk (VaR) measures are more attractive than lower VaR measures (i.e. a VaR of -3% is more attractive than a VaR of -9%).
Conditional Value at Risk: a measure of left tail risk on the condition that a given confidence level (95%) is exceeded, calculated by estimating the probability of portfolio losses beyond a given confidence level. Larger Conditional Value at Risk (CVaR) measures are more attractive than lower CVaR measures (i.e. a CVaR of -3% is more attractive than a CVaR of -9%).
Max Drawdown: the peak-to-trough decline during a time agnostic period of a portfolio. Smaller values are more attractive than larger values; calculated by finding the largest peak to trough decline of the 1,000 projected scenarios.
