The Endowment Model Proves Its Worth (Again)

October 17, 2022 |
1 minute read
|

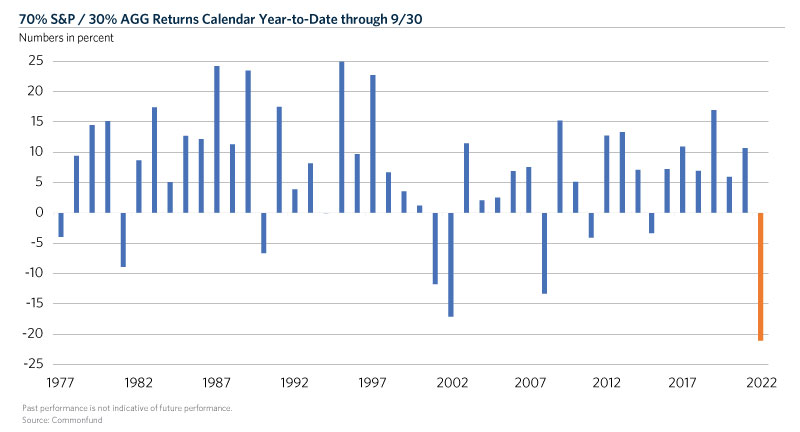
Unless you’ve been on a remote island with no Wi-Fi for the past nine months, you are well aware that it has been a rough start for capital markets. In fact, it has been a historically rough start to the year for a traditional stock/bond portfolio.

We analyzed the returns of a 70 percent S&P 500 (“S&P”) and 30 percent Bloomberg Barclays U.S. Aggregate Bond Index (“AGG”) portfolio and were surprised to learn that this was the worst start to a calendar year through the month of September since…well, ever1.

Chart1-EMPIW

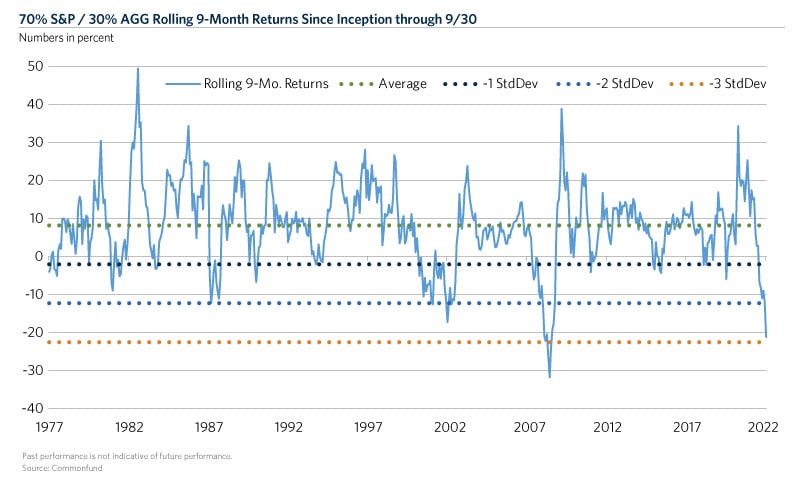
We then analyzed all rolling nine-month returns of this 70/30 portfolio back to 1976 and unfortunately it doesn’t tell a better story. The calendar year-to-date return through September 30, 2022, ranked as the fifth worst nine-month stretch for this traditional U.S. portfolio ever. Across 541 data points, that means we’re currently living through the worst 1 percent of this data set, or roughly three standard deviations2 away from the mean. The only worse stretch occurred during the 2008-09 Great Financial Crisis.

Chart2-EMPIW

On a brighter note, a portfolio employing the “endowment model” of investing, which incorporates various diversification levers mainly through alternative investments like private equity, private credit, hedge funds, natural resources, etc., has fared much better to start the year. Some of those asset classes, namely hedge funds and natural resources, were the most “unloved” parts of the market over the past several years. Those who stuck with them, however, are sure glad they did in 2022. We like to tell our clients that you’re not fully diversified unless you really dislike something in your portfolio. Right now, unfortunately, that’s stocks and bonds. However, for those investing with a long-term time horizon these types of severe market returns have a historically presented compelling buying opportunities. 

Visit our investment strategy page to learn more


  1. Inception date of the AGG is August 1976
  2. https://www.investopedia.com › ... › Financial Ratios
    Standard deviation is a statistic that measures the dispersion of a dataset relative to its mean and is calculated as the square root of the variance.
Anthony Peretore

Author

Anthony Peretore

Managing Director

Disclaimer

Certain information contained herein has been obtained from or is based on third-party sources and, although believed to be reliable, has not been independently verified. Such information is as of the date indicated, if indicated, may not be complete, is subject to change and has not necessarily been updated. No representation or warranty, express or implied, is or will be given by The Common Fund for Nonprofit Organizations, any of its affiliates or any of its or their affiliates, trustees, directors, officers, employees or advisers (collectively referred to herein as “Commonfund”) or any other person as to the accuracy or completeness of the information in any third-party materials. Accordingly, Commonfund shall not be liable for any direct, indirect or consequential loss or damage suffered by any person as a result of relying on any statement in, or omission from, such third-party materials, and any such liability is expressly disclaimed.

All rights to the trademarks, copyrights, logos and other intellectual property listed herein belong to their respective owners and the use of such logos hereof does not imply an affiliation with, or endorsement by, the owners of such trademarks, copyrights, logos and other intellectual property.

To the extent views presented forecast market activity, they may be based on many factors in addition to those explicitly stated herein. Forecasts of experts inevitably differ. Views attributed to third-parties are presented to demonstrate the existence of points of view, not as a basis for recommendations or as investment advice. Market and investment views of third-parties presented herein do not necessarily reflect the views of Commonfund, any manager retained by Commonfund to manage any investments for Commonfund (each, a “Manager”) or any fund managed by any Commonfund entity (each, a “Fund”). Accordingly, the views presented herein may not be relied upon as an indication of trading intent on behalf of Commonfund, any Manager or any Fund.

Statements concerning Commonfund’s views of possible future outcomes in any investment asset class or market, or of possible future economic developments, are not intended, and should not be construed, as forecasts or predictions of the future investment performance of any Fund. Such statements are also not intended as recommendations by any Commonfund entity or any Commonfund employee to the recipient of the presentation. It is Commonfund’s policy that investment recommendations to its clients must be based on the investment objectives and risk tolerances of each individual client. All market outlook and similar statements are based upon information reasonably available as of the date of this presentation (unless an earlier date is stated with regard to particular information), and reasonably believed to be accurate by Commonfund. Commonfund disclaims any responsibility to provide the recipient of this presentation with updated or corrected information or statements. Past performance is not indicative of future results. For more information please refer to Important Disclosures.

Stay connected with the Insights Blog

Popular Blog Posts


Market Commentary | Insights Blog

Chart of the Month | U.S. Budget Deficit Hits Record Highs

In his first 100 days as President of the United States, Joe Biden has introduced three domestic funding proposals, totaling close to $6.0 Trillion, reflecting a desire to enhance the role of the...
Perspectives | Insights Blog

The Case for Using the Higher Education Price Index® (HEPI) to Define Inflation for Colleges

When calculating return targets for an endowment portfolio, a conventional piece of the equation is often the Consumer Price Index (CPI). CPI plus 5% is the common short-hand formula for institutions...
Market Commentary | Insights Blog

Chart of the Month | The Surprising Relationship Between Money Supply and Inflation

The potential for rising inflation is becoming a top concern for many investors and consumers. Many believe that inflation is already here as evidenced by price increases in commodities, homes,...

Disclaimer

Certain information contained herein has been obtained from or is based on third-party sources and, although believed to be reliable, has not been independently verified. Such information is as of the date indicated, if indicated, may not be complete, is subject to change and has not necessarily been updated. No representation or warranty, express or implied, is or will be given by The Common Fund for Nonprofit Organizations, any of its affiliates or any of its or their affiliates, trustees, directors, officers, employees or advisers (collectively referred to herein as “Commonfund”) or any other person as to the accuracy or completeness of the information in any third-party materials. Accordingly, Commonfund shall not be liable for any direct, indirect or consequential loss or damage suffered by any person as a result of relying on any statement in, or omission from, such third-party materials, and any such liability is expressly disclaimed.

All rights to the trademarks, copyrights, logos and other intellectual property listed herein belong to their respective owners and the use of such logos hereof does not imply an affiliation with, or endorsement by, the owners of such trademarks, copyrights, logos and other intellectual property.

To the extent views presented forecast market activity, they may be based on many factors in addition to those explicitly stated herein. Forecasts of experts inevitably differ. Views attributed to third-parties are presented to demonstrate the existence of points of view, not as a basis for recommendations or as investment advice. Market and investment views of third-parties presented herein do not necessarily reflect the views of Commonfund, any manager retained by Commonfund to manage any investments for Commonfund (each, a “Manager”) or any fund managed by any Commonfund entity (each, a “Fund”). Accordingly, the views presented herein may not be relied upon as an indication of trading intent on behalf of Commonfund, any Manager or any Fund.

Statements concerning Commonfund’s views of possible future outcomes in any investment asset class or market, or of possible future economic developments, are not intended, and should not be construed, as forecasts or predictions of the future investment performance of any Fund. Such statements are also not intended as recommendations by any Commonfund entity or any Commonfund employee to the recipient of the presentation. It is Commonfund’s policy that investment recommendations to its clients must be based on the investment objectives and risk tolerances of each individual client. All market outlook and similar statements are based upon information reasonably available as of the date of this presentation (unless an earlier date is stated with regard to particular information), and reasonably believed to be accurate by Commonfund. Commonfund disclaims any responsibility to provide the recipient of this presentation with updated or corrected information or statements. Past performance is not indicative of future results. For more information please refer to Important Disclosures.