A deep dive into independent school endowment's trends FY2005-FY2022, including analysis of asset allocation, performance, spending and contributions, plus a perspective on future developments.
Managing endowed assets of independent schools requires a long-term view, as the ultimate goal is to maintain the purchasing power of these assets. Doing so enables an institution to provide similar or increasing levels of support for both the current and future generations of students. In investment parlance, a generation is often defined by a period spanning 20-30 years, but the nature of independent school governance models often lends itself to measuring performance and trends over much shorter periods.
The Commonfund Benchmarks Study® of Independent Schools, produced annually in partnership with NBOA since FY2005, surveys independent schools on endowment management and governance practices. While still in the early stages of data gathering relative to traditional investment market cycles, we thought highlighting a few early trends based on data from the 18 annual studies conducted over this time would be of interest.
Asset Allocation
The majority of the periods analyzed between FY2005 and FY2022 can be generally characterized as conducive for growth-based assets, given the post financial-crisis boom supported by a prolonged period of low-interest rates and inflation, strong employment, sustained corporate earnings, and accommodative fiscal policies. Not surprisingly, this has led to an increase in allocations to growth (or risk-based) assets in portfolios of independent schools.
As noted in the chart below, allocations to public and private equities have grown from 49% to 63% from FY2012 to FY2022, largely at the expense of defensive strategies, including marketable alternatives (hedge funds), which declined from 12% to 5% in this same period, and fixed income/cash, which dropped from 32% to 27%.
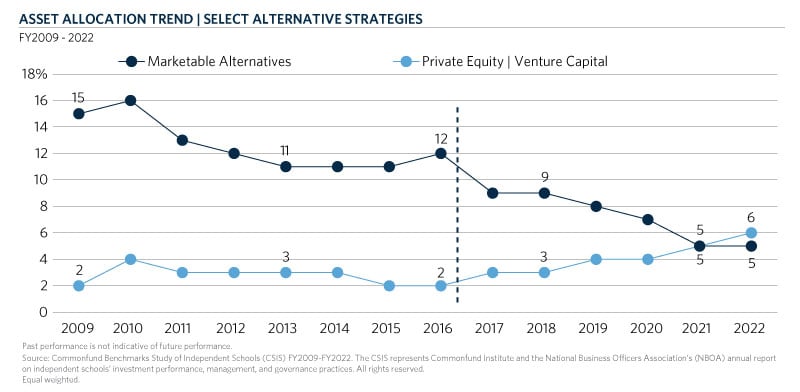
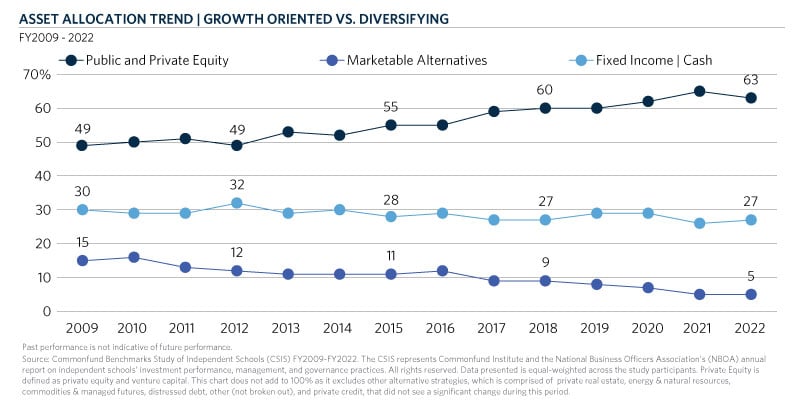 The shift in the composition of independent schools’ allocations to alternative strategies has been quite dramatic in recent years. In FY 2016, the average (equal-weighted) allocation to marketable alternatives (hedge funds) was 12%, which represented 67% of the total allocation to alternative strategies in that particular year. At the same time, the combined average allocation to private equity and venture capital was a modest 2%, representing approximately 12% of the total allocation to alternatives.
Since this time, there has been a steady increase in the inclusion and build-out of private equity and venture capital allocations, while the predominant use of marketable alternative strategies as an equity substitute has waned as institutions place greater emphasis on growth-oriented strategies. In FY2022, independent schools’ average allocation of 6% to private equity and venture capital has supplanted marketable alternatives (5% equal-weighted allocation) as the largest allocation within the alternative strategies bucket (38 % vs. 33% of the total alternatives asset mix, respectively).
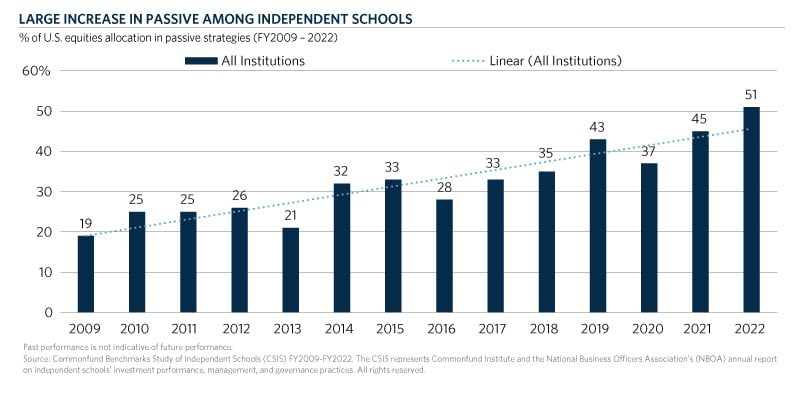
 A similar trend has also emerged in the increasing allocation to passive index exposures, particularly within U.S. equities. The mix of passively managed funds held as part of a school’s allocation to U.S. equities has grown from 19 in FY2009 to 51% in FY2022. This is consistent with broader market trends, as data reported by the Investment Company Institute suggests that FY2022 represents the first time that passively managed funds account for a larger share of ownership of the U.S. stock market than actively managed funds. This is not entirely surprising given the proliferation of exchange-traded funds and a growing view that the U.S. equity market is among the most difficult to consistently generate excess returns from active management.
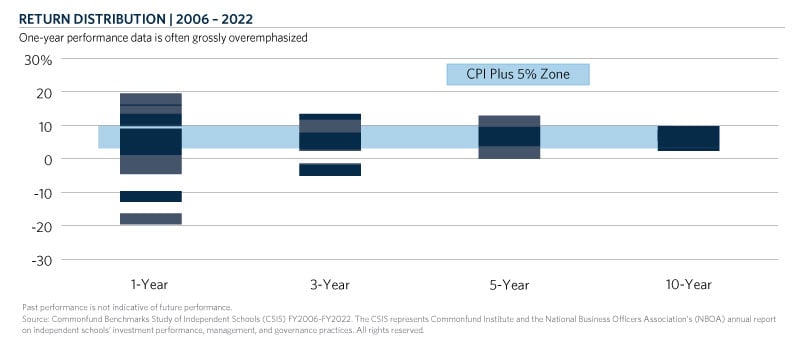
 It is often cited that perhaps the least relevant figure reported in the annual endowment study report is the average one-year performance number. Given an endowment pool’s long-term focus and its ultimate goal of maintaining purchasing power to support the mission of the school, a one-year performance number offers little insight regarding the alignment of the portfolio’s historic performance and its long-term return objectives.
For example, an institution that takes a 5% spending draw from the endowment annually should have an implied return objective over the long-term to generate a return that is sufficient to meet the 5% payout and keep pace with inflation. As a result, future draws from the endowment should have a similar level of impact on the operating budget or other areas supported by the endowment spending. As such, this sample institution’s return objective would be 5% + inflation (e.g., the Consumer Price Index (CPI) or the Higher Education Price Index (HEPI)) to ensure that the portfolio maintains its purchasing power and provides intergenerational equity in its support of the School’s mission into perpetuity.
Given the nature of the capital markets and exposure to wide-ranging levels of volatility in different economic cycles, there often is significant dispersion in the annual endowment returns reported by schools over time. Therein lies the problem of comparing a short-term return with a long-term investment goal.
The chart below illustrates this challenge as it plots the range of 1, 3, 5, and 10-year returns reported into each annual endowment study from FY2006 through FY2022 against a similar range of CPI + 5 % returns for the same time periods. There are significant outliers from the ‘CPI + 5% zone’ when comparing returns in shorter time periods (1 and 3 years). Conversely, there is much more consistency in the distribution of returns from both the endowment portfolios in comparison to the CPI + 5% zone range over longer time periods (5 years and 10 years), reinforcing the sentiment that comparative endowment performance should be viewed through a long-term lens.
 As noted at the beginning of this article, the trend data that we are analyzing is still in the early stages relative to long market cycles. Major market dislocations can have an outsized effect on shorter to intermediate-term data trends, showing dramatic peaks and troughs and painting a bleak picture that may be less alarming when viewed in the context of a much longer cycle.
While the data from the collective studies only dates back to FY2005, it is clear that the large drawdown experienced during the Great Financial Crisis of FY2009 impacted the average independent school’s ability to generate the sufficient long-term annualized returns needed to keep pace with spending and inflation for a good portion of the ensuing decade. The average reported drawdown of -18.1% in FY2009 contributed to tempered rolling 10-year returns that largely fell short of a traditional inflation plus spending goal. The chart below notes that it has taken a full decade for average endowment long-term returns to again outpace spending plus inflation (represented by CPI + 5% in this example).
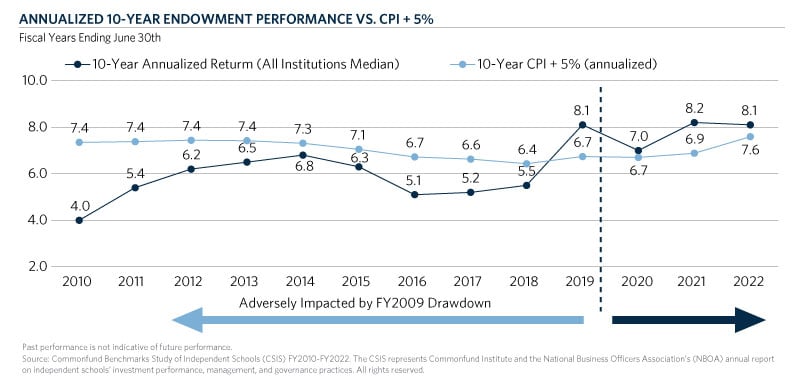
The challenges associated with keeping pace with a CPI + 5% return hurdle over the long-term is one of several factors that have likely influenced the shift in asset allocation to greater incorporation of growth-based strategies over the past decade. As previously noted, independent schools have increased their exposure to public and private equities from 49% to 63% of the total portfolio since FY2012. Moreover, allocations to private equity and venture capital have tripled since FY2016 as institutions pursue capturing a liquidity premium over traditional public markets to potentially enhance longer-term return profiles.
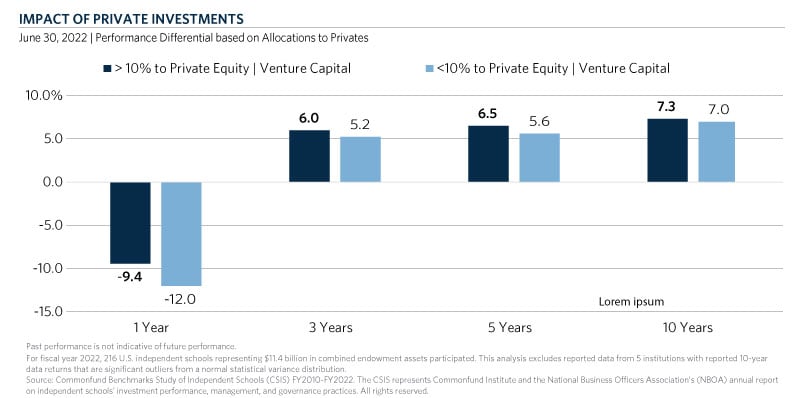
Based on the most recent endowment study data as of June 30, 2022, there has been evidence of a positive impact on returns for institutions with higher levels of investments in these private investment strategies. The chart below highlights the difference in reported 1, 3, 5, and 10-year returns for institutions with 10% or more invested in private equity and venture capital compared to peers with less than 10% invested in these strategies:
Spending and Contributions
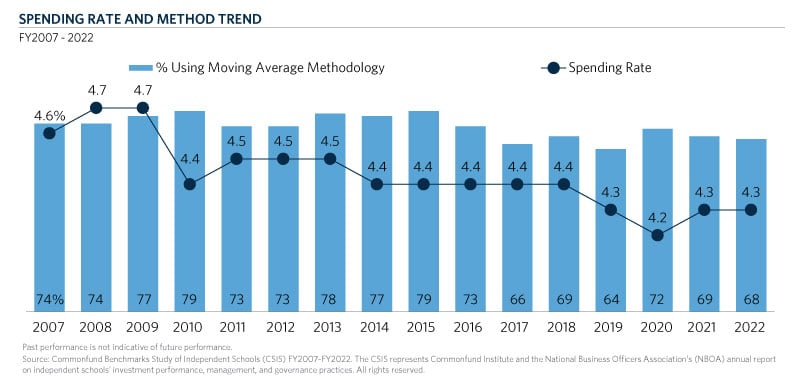
While CPI +5% is often used as the standard proxy reference for measuring long-term performance, the reality is that the average applied policy spending rate peaked at 4.7% in fiscal years 2008 and 2009 and has steadily declined over the subsequent years to 4.3%, as schools have made a concerted effort to adjust rates to more sustainable levels given future return expectations. Interestingly, most of the changes noted have been specific to applied spending rates as the vast majority of independent schools continue to utilize a moving average market value calculation methodology.
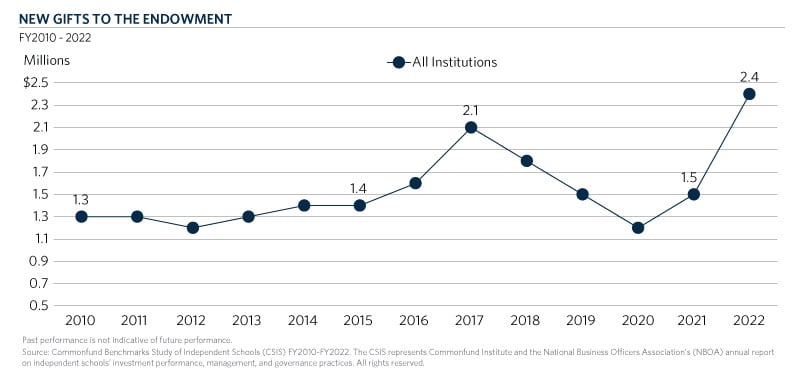
Among the most noteworthy findings in the FY2022 study was the sharp increase in new gifts to the endowment. In FY2022, new gifts to the endowment jumped to an average of $2.4 million, the highest level since the inception of the endowment study. This increase represents an encouraging recovery from the steady decline from the previous high of $2.1 million in FY17 to a recent low of $1.2 million during FY2020 (likely impacted by the onset of the COVID pandemic). In the FY2020 study report, we presented an in-depth analysis of trends in new giving to the endowment, seeking to better understand the decline in giving from FY2017–FY2020. There were any number of potential reasons for the trend, including the impact of the Tax Cut and Jobs Act of 2017 or a desire of philanthropists to donate money beyond endowment and schools, stressing giving to the annual fund over the endowment. Stronger markets in 2021, aided by an accommodative Fed, may have also helped fuel the recent bounceback. This is a trend that we will continue to watch closely in the coming years as the transfer of wealth from the baby boomer generation continues to unfold.
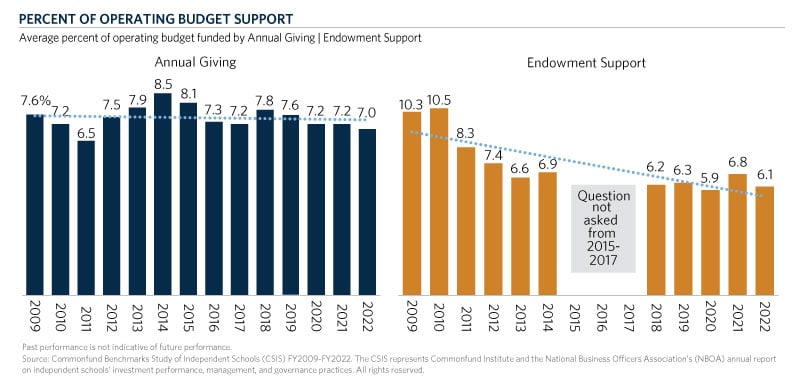
While new gifts to the endowment have been unpredictable over the past eight fiscal years, support to the operating budget from annual giving has been remarkably consistent for most of the past decade, largely hovering between 7 to 8% of the total operating budget. During this same period, we’ve witnessed a decline in the level of operating budget support provided by endowment spending. Since the question was introduced in FY2009, there has been a significant drop from the peak level of 10.5% to 6.1% in FY2022.
Many factors have contributed to this decline, including the impact of the major endowment drawdown experienced in FY2009, contributing to long-term returns not keeping pace with spending plus inflation over most of the decade, the concerted effort of institutions to lower spending rates (the average dropped from 4.7% to 4.3% during this same period), and the expansion of operating budgets as per-student expenses continued to escalate throughout much of the decade.
Looking Ahead
Former U.S. President John F. Kennedy is quoted as saying: “Change is the law of life. Those who look only to the past and present are certain to miss the future.” Independent schools have seen a significant amount of change since NBOA’s inception 25 years ago across many facets of business management. Endowment management has been no exception as investment policies evolve to adapt to a changing world.
As we look ahead, there is no doubt that there will be an abundance of headwinds that will continue to shape the endowment landscape and subsequent trends reported in future benchmark study reports. Given expected challenges related to enrollment cliffs, anticipated recessions, slowing global growth, and rising costs in schools, it is highly likely that endowment portfolios will be under pressure to generate higher returns and provide an increasing level of support to institutions in the coming years.
We may be seeing some of the early signs with shifts in asset allocation favoring growth strategies. As exposure to risk-based assets increases in portfolios, so do expectations for a greater level of portfolio volatility, which can impact the consistency of spending payouts for most institutions that rely on the traditional moving average market value calculation methodology. Perhaps the next trend will see disruption of the long-standing status quo spending methodology as institutions seek to optimize the consistency of support during greater times of need.
In addition to the continued evolution of the traditional endowment trends noted above, we also expect to see the emergence of new focus areas for school endowments. Over the past 25 years, we have seen the responsible investing landscape continue to evolve and gain momentum. Since the early 2000s, ESG (Environmental, Social, and Governance) investing has seen an increasing emphasis on research that highlights positive environmental, social and governance factors, and how they may be able to contribute to an endowment’s long-term growth potential. Formerly limited to socially responsible investing processes characterized by negative screens, the opportunities to express ESG values in institutional investing practices have increased.
Analysis of ESG practices demonstrates that they can not only fulfill traditional fiduciary responsibilities but even bolster them. Additionally, research is showing that ESG practices can have positive impact on investment performance. Whether or not a particular institution decides to add ESG practices to its investment toolkit, fiduciaries need to bear in mind its ever-increasing presence and, potentially, its increasing global influence and visibility.
The Study of Independent Schools first started surveying on responsible investing considerations in the FY2018 report. What we found and continue to find in the most recently published study reporting data from FY2022 is that responsible investing practices are increasingly making their way into the discussions of investment committees, but the rate of formal adoption still remains tepid. This is consistent with what we have found in studies we conduct on other markets in the nonprofit sector, as we examine these same trends amongst private foundations and higher education institutions. Just like in other nonprofit verticals, independent school investment committees are continuing to discuss the topic and we expect this will continue.
Percent of Respondents Having Investment Committee Discussion of ESG, SRI, Impacting Investing or Diverse Managers
#s are in percent
| 2019 | 2020 | 2021 | 2022 | |
| # of responding institutions | 176 | 154 | 160 | 161 |
| ESG (environmental social governance factors) | 23 | 23 | 36 | 43 |
| # of responding institutions | 171 | 148 | 160 | 164 |
| SRI (socially responsible investing) | 23 | 24 | 29 | 32 |
| # of responding institutions | 183 | 156 | 168 | 174 |
| Impact Investing | 10 | 13 | 17 | 20 |
| # of responding institutions | 182 | 153 | 160 | 166 |
| Diverse Managers | 12 | 18 | 18 | 25 |
The field of responsible investing is maturing rapidly. Existing challenges include lack of standards, added complexity in reporting, the lack of investment vehicles needed to provide acceptable portfolio diversification and empirical evidence that potential returns are not being negatively impacted. The good news is that these challenges continue to be addressed. At the same time, new challenges are emerging, as ESG and responsible investing have become politicized, making these conversations at the institutional level equal parts more tense and urgent.
Looking forward to the next 25 years, we are confident that these numbers will continue to rise with each iteration of the research we do, as more policies, formal ways to measure and benchmark and more investment options are made available for consideration.
Editor’s note: Originally published on NBOA.org as an article that appeared in Net Assets’ silver anniversary edition (Mar/Apr 2023).