This time of year is always an exciting one. Many look forward to family gatherings during the holidays while others simply enjoy the transition from the dog days of summer to the cold and dark days of winter. For those of us in the endowment world, the excitement of the season is heightened by the annual tradition of many of the largest endowments publishing their performance numbers. With these reports comes the inevitable wave of articles, LinkedIn posts and the like expressing various views about the performance derby, whether the “endowment model” is working, and what asset classes endowments should have more or less of. Each year I am struck by how much focus is placed on a one-year performance number for a group of investors that are looking at perpetual time horizons. Harvard’s first endowed gift was given to that institution in the 1660s, literally a hundred years before the founding of our nation and centuries before SpaceX went public. But, alas, here we are counting every decimal point in our rankings of the highest performers for the fiscal year.
To date, we have tracked 64 institutions that have publicly reported returns for fiscal year 2026 (the twelve months ending June 30, 2026). To be clear, this is a fraction, maybe 10%, of the institutions that will report their results in the NACUBO-Commonfund Study of Endowments (NCSE) to be released in February 2027, so it should be considered a subset of the broader endowment landscape. Given their size, however, they happen to represent a large percentage of endowment assets (roughly 54% as of 6/30/2025) and thus command attention. Because of that, it is difficult to ignore them and, despite all counsel to look beyond one-year numbers, I share some initial observations about this year’s results below.
Let me start with the good news: it was a strong year. The median one-year return among the 64 institutions that reported it was 17.8%, up from 11.1% for the 60 that had reported at this time last year. Strong equity markets were a likely driver. The MSCI All Country World Index (“ACWI”) returned 23.7% for the fiscal year, and a 70/30 mix of global equities and bonds earned roughly 17.6%, almost exactly where the median institution landed.
What stands out is not the middle of the distribution, however, but the tails. Reported returns range from 9.6% to 37.8%, a spread of 28 percentage points compared to 13 last year, and the standard deviation is roughly two and a half times what it was in FY2025. Half of the institutions sit between 15.2% and 21.0%, a six-point band that looks a lot like a diversified portfolio capturing a strong global equity market. The width comes from the ends. Ten institutions returned 25% or more and five of those ten (UNC, WashU, Stanford, Harvard and UVA) have disclosed stakes in one company: SpaceX.
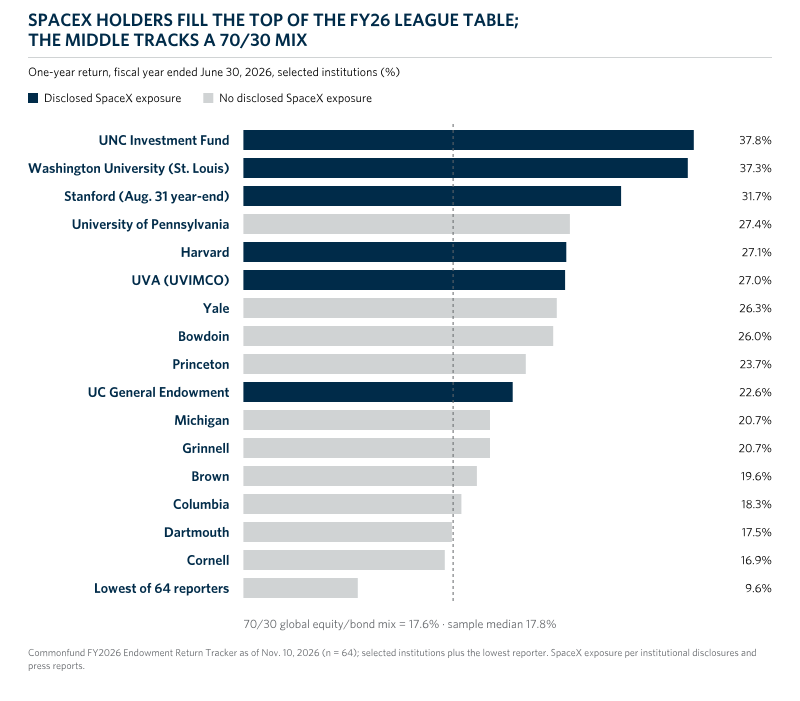
The seven institutions with disclosed SpaceX exposure (six shown above) have a median return of 27.1% versus 17.2% for the other 57. The IPO in June, the largest in history, marked up long-held private stakes just weeks before the fiscal year ended. That timing is worth pausing on, because it brings me back to a point I made last December: how and when private investments are valued matters a great deal in a one-year number. A quarter-lagged valuation (a commonly used methodology to account for the delay in valuations of illiquid assets) would not yet have included the increased valuation at IPO.
To be fair, disclosure is not the same as exposure. Yale, Penn, Bowdoin and Princeton all posted top tier returns with no disclosed SpaceX position, meaning they may have had exposure or something else entirely.
Since many of the institutions I talk to are not Ivies or institutions with multi-billion dollar endowments, let me also say a word about how other institutions fared. The Ivy League beat everyone else as a group, with a median of 21.7% versus 17.2% for the other 56 institutions in our tracker, but the gap comes from four schools, not the whole league. Penn (27.4%), Harvard (27.1%), Yale (26.3%) and Princeton (23.7%) sit well above the field, while Brown, Columbia, Dartmouth and Cornell (16.9% to 19.6%) land within a few points of the non-Ivy median. Many other institutions had a good year, too. Twenty-seven of the 36 non-Ivy institutions with endowments under $5 billion returned 15% or more, and some, like Bowdoin at 26.0%, beat most of the Ivies. Broadly speaking, size and returns did move together, however.
| Endowment size | Institutions | Median FY26 return |
|---|---|---|
| $10 billion or more | 17 | 22.6% |
| $2 billion to under $10 billion | 20 | 18.8% |
| Under $2 billion | 21 | 15.5% |
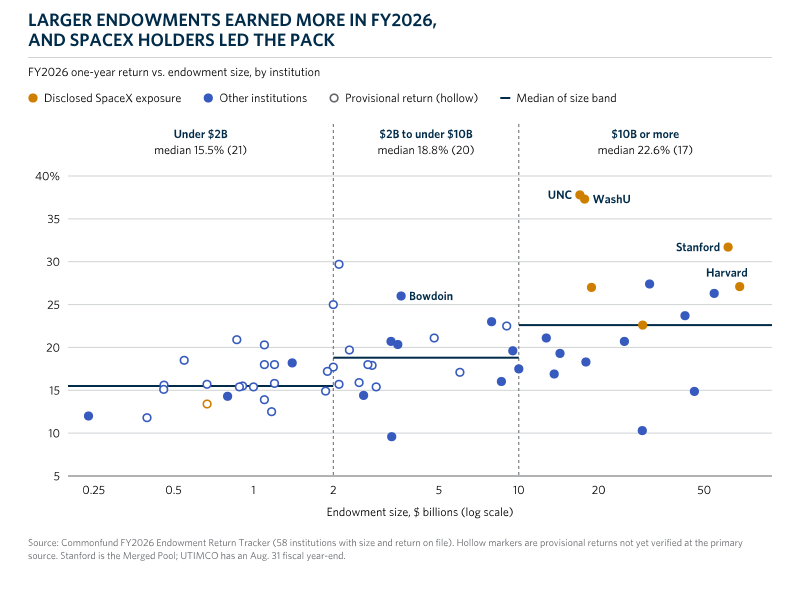
The 7-percentage point gap between the medians of the largest and smallest pools likely reflects differences in asset allocation as well as manager selection and, specifically, potentially access to top venture managers.
All of which brings me back to the question I keep returning to in these posts, and the one I think matters most in the NCSE results: the gap between what institutions need to earn and what they have actually earned. A required return can still be built from the same few inputs I described in A Gap in Reality. The effective spending rate in the 2025 NACUBO-Commonfund Study was 4.9% (up from 4.7% in FY2023), and the Higher Education Price Index, the best measure of the inflation colleges actually experience, rose to 3.6% in fiscal 2025. That is a required return of roughly 8.5% in today’s environment.
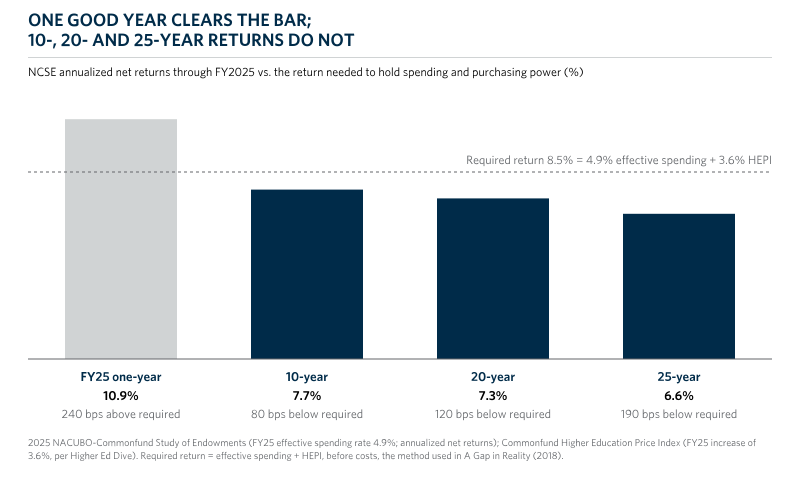
Against a benchmark using HEPI today (and recognizing it has fluctuated historically), a one-year return of 10.9% looks terrific. The 10-year (7.7%), 20-year (7.3%) and 25-year (6.6%) returns do not, and that is after a run of strong years. Meanwhile, the need is growing. Endowments on average funded 15.2% of operating budgets as of FY2025, up from 10.9% just two years earlier. Princeton offers the clearest sign I have seen of an institution considering this conundrum. In a February “State of the University” letter, President Eisgruber announced a reduction in the endowment’s long-term return assumption from 10.2% to 8%, which is likely to result in slowing growth in the support coming from the endowment.
So where does that leave us? I think about the years ahead as a contest between tailwinds and headwinds, and it is worth being clear-eyed about both.
The tailwinds are real. Three strong years in a row (NCSE returns of 11.2% in FY2024 and 10.9% in FY2025, and far higher for many of the endowments that have reported for FY2026) flow straight into spending (most commonly based on a rolling 12-quarter average endowment value), which means more scholarships, research, programs and grants. Philanthropy reached a record $617 billion in 2025, up 3.0% after inflation, although with continued trends in concentration. Income is back, as higher yields restore real income in fixed income and credit. And dislocation is creating opportunities in credit, real estate, hedge fund dispersion, and other areas like secondaries.
The headwinds are just as real and, I would argue, may matter more. Among nonprofits, higher education may be facing the clearest example of operating strain, where enrollment pressure, federal funding uncertainty and cost inflation squeeze every other source of revenue, so many nonprofits are becoming, and are likely to continue becoming more dependent on their endowments. At the same time, returns are likely to be harder to come by. The top ten stocks now make up about 39% of the S&P 500, up from about 23% in 2019, and equity valuations look stretched. In our view, there will be no repeat of the 30-year bond bull market. Record capital flowing into alternatives may compress the premium they earn. And as the recent AI and tech selloff reminded us, sentiment can turn quickly against concentrated positions, while geopolitics keeps oil and inflation volatile.
That is the conundrum. The need for returns has never been greater, and the ability to generate them going forward may be more challenged. A required return is not an expected return, and the gap between them is widening. We cannot control what markets deliver. We can control what we spend, how we allocate our capital and the way we execute. That is why disciplined review of strategic policy, stress testing, liquidity planning and manager selection matter more than ever, and why a year like this one, whether it produced 10% or nearly 40%, is but one datapoint in a much greater mission. Harvard’s first endowed gift arrived more than three-and-a-half centuries ago. Whatever else we can say about the institutions that have endured since then, none of them got there by winning a single year’s league table.

Resources:
For prior blogs on the challenges of evaluating one-year returns please visit the following:- A Gap In Reality
- What Does the NTSE One-year Number Tell You? As it Turns Out, Not Much.
- Why the Way You Count Matters and Why Comparing One-Year Returns Does Not
For the full NCSE data, visit the Commonfund Benchmarks Studies page.
Sources for FY2026 figures (tracker as of Nov. 10, 2026):